Auto-instrumentation Monitoring for Java and Node.js on App Service (Preview)
We are happy to share that Azure Monitor Application Insights monitoring is now available for Java and Node.js apps on App Service for both Windows and Linux! To try it out, create a new Web App from the Portal and click the Monitoring tab to enable App Insights. If you already have a Java or Node.js app on App Service, then go to Application Insights on the web app menu to turn it on. Keep reading for instructions on how to get started!
This integration is currently in technical preview.
Auto-instrumentation from Azure Monitor application insights
Azure Monitor application insights is a cloud native application monitoring service which enables customers to observe failures, bottlenecks, and usage patterns to improve application performance and reduce mean time to resolution (MTTR). With a few clicks, you can enable monitoring for your Node.js or Java apps, auto-collecting logs, metrics, and distributed traces, eliminating the need for including an SDK in your app.
Enabling application insights for your Azure web app will auto-instrument your Java or Node.js application, and you will see the telemetry in Azure Portal no code changes required! Application insights will help you better understand and monitor your applications with features like…
Get Started
New Web App
If you do not have a Java or Node.js web app, create a new one from the Azure Portal.
- Open the Web App create page
-
Select Node.js or Java as your runtime stack (Java SE, Tomcat, and JBoss EAP are all applicable)
- Enter your resource group, region, and App Service Plan
-
Select the monitoring tab at the top, and select Yes for “Enable Application Insights”
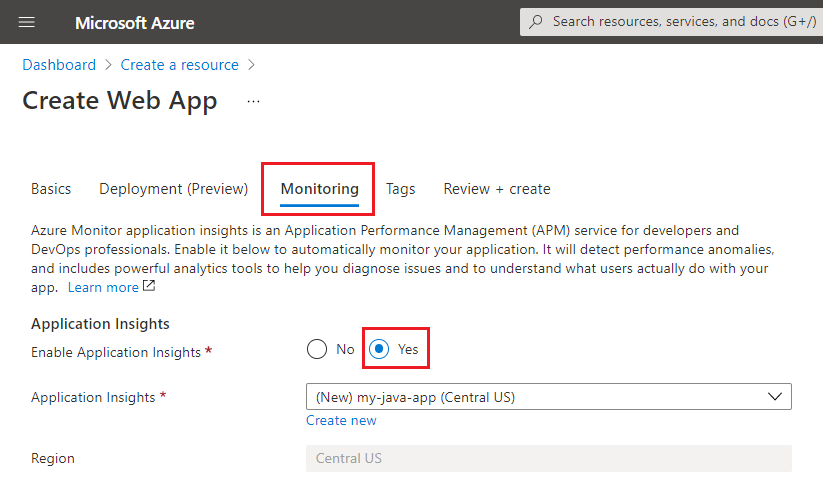
- Go to Review + Create, review your selections, and click Create!
The deployment will create the Web App and Azure Monitor application insights resources. Once the deployment completes, your application telemetry will be visible in the Application Insights resource.
Existing Web App
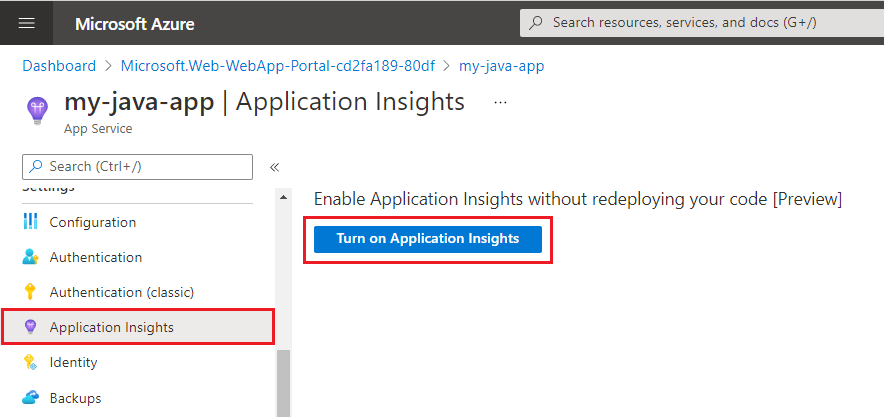
If you already have a Node.js or Java web app, navigate to it from the Portal.
-
On the left side, scroll down to the Application Insights menu item and click “Turn on Application Insights”.
-
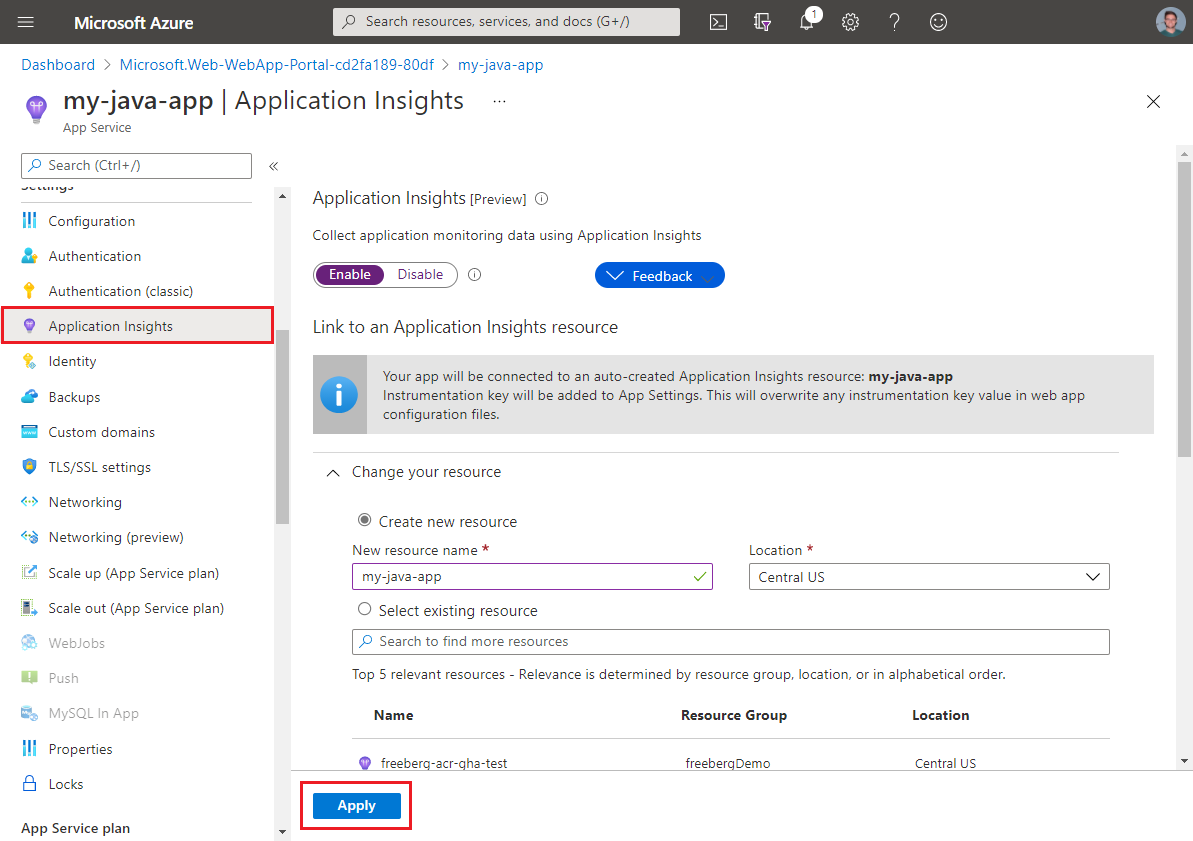
By default, a new application insights resource of the same name as your Web App will be used. You can choose to use an existing application insights resource, or change the name.
-
Click Apply at the bottom.
Your application telemetry will be visible in the Application Insights resource.
Azure Monitor application insights support on App Service
App Service has supported auto-instrumentation monitoring for other languages and operating systems. As of May 10th, this is the current support matrix for App Insights on App Service:
| Language | Windows | Linux |
|---|---|---|
| ASP.NET | ✔️ | N/A |
| .NET 2.1, 3.1, 5 | ✔️ | ❌ |
| Java | ✔️ | ✔️ |
| Node.js | ✔️ | ✔️ |
| Python | ❌ | ❌ |
| Ruby | ❌ | ❌ |
| PHP | ❌ | ❌ |
✔️ Application insights auto-instrumentation monitoring is supported
❌ Application insights auto-instrumentation monitoring is not currently supported