AppServiceAppLogs is now available for ASP .NET apps on Windows
We have added a new log type for ASP .NET web apps on Windows (ASP .NET Core support is not yet supported). The log type, AppServiceAppLogs, captures your app’s log and error statements. This log type is part of the preview of App Service’s integration with Azure Monitor.
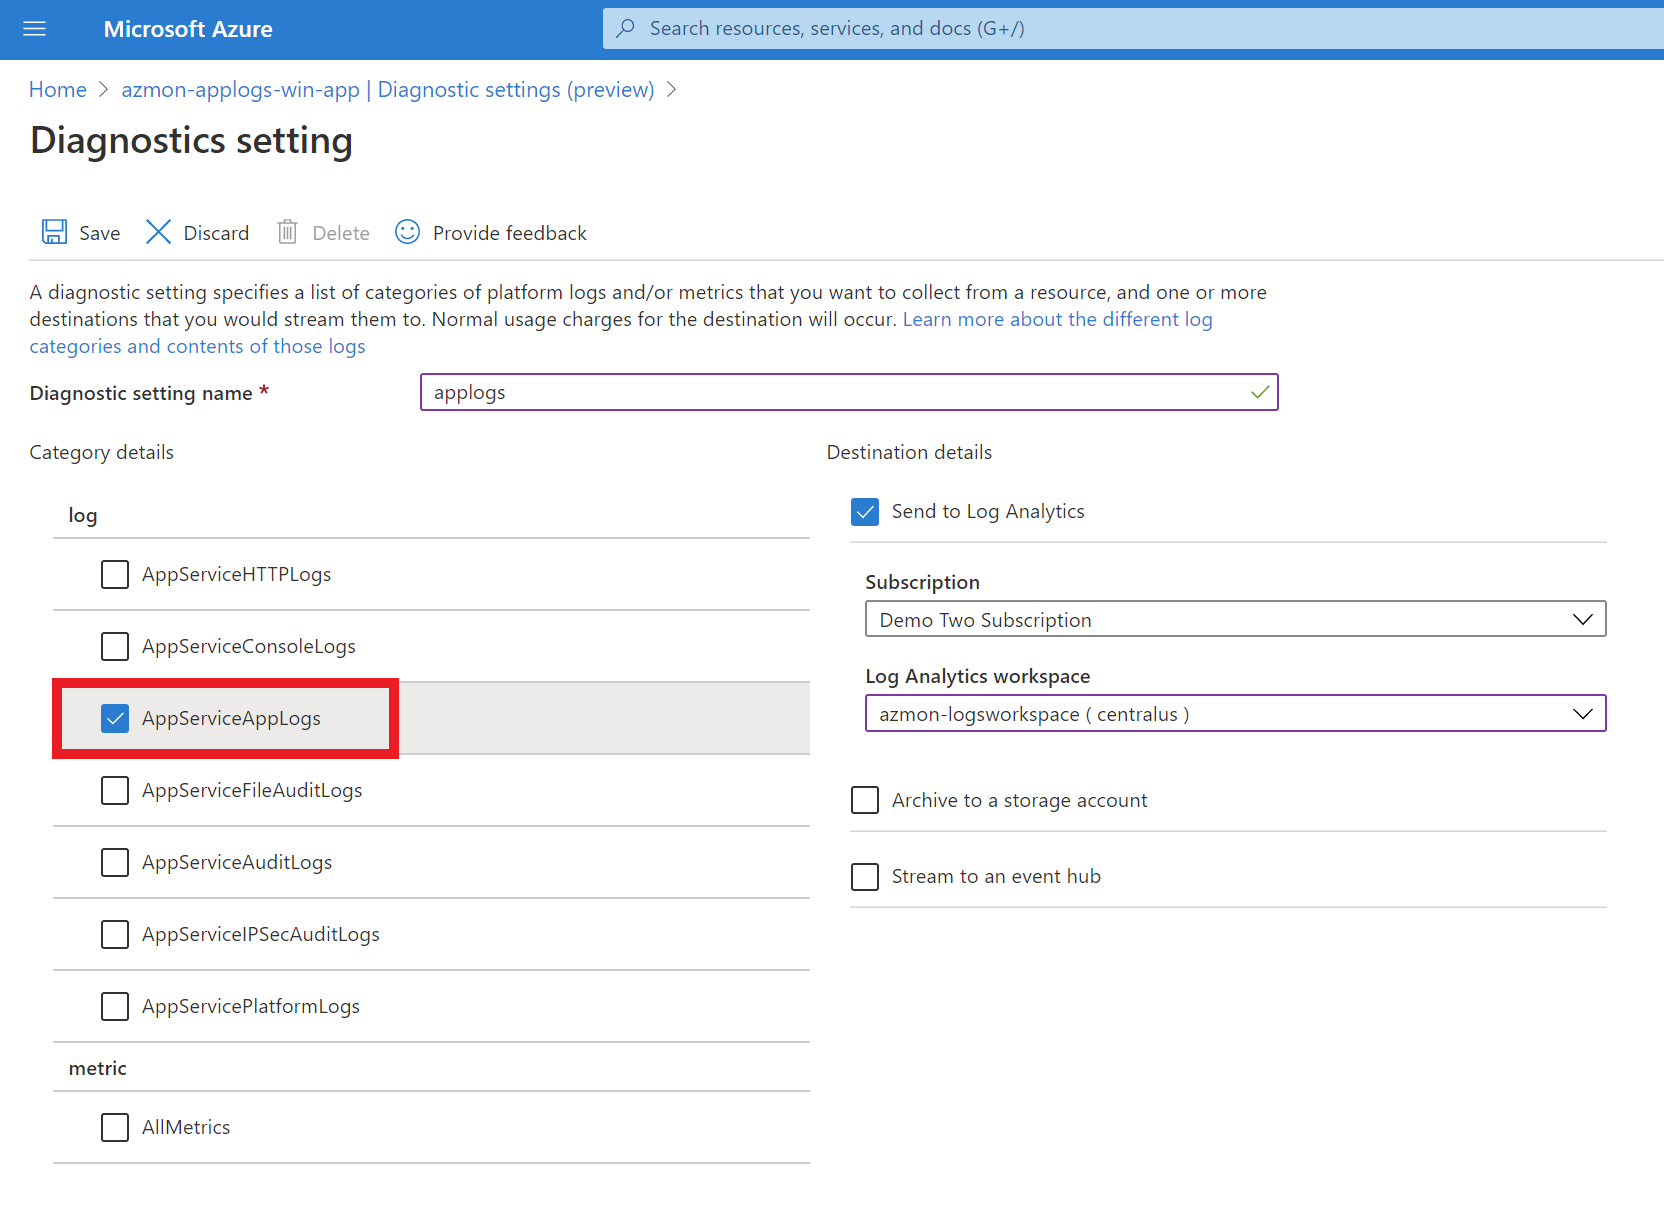
Enable AppSerivceAppLogs
Refer to how to create Diagnostic settings and enable AppServiceAppLogs on the list.
Add log message to your web app
To start using this log type, you need to update the Web.config file and add log statements to your code. Then you can route logs to Log Analytics, Event Hubs, or a Storage Account.
Update your Web.config file
Add the following snippet to your Web.config file in order to declare usage of our Trace Listener. This will configure your application to direct its tracing outputs to our listener.. Logs will not show up if you don’t add this to the Web.config.
  <system.diagnostics>
    <trace>
      <listeners>
        <add name="AzureMonitorTraceListener" type="Microsoft.WindowsAzure.WebSites.Diagnostics.AzureMonitorTraceListener, Microsoft.WindowsAzure.WebSites.Diagnostics, Version=1.0.0.0, Culture=neutral, PublicKeyToken=31bf3856ad364e35" />
      </listeners>
    </trace>
  </system.diagnostics>
Add log statements to your code
You can use the System.Diagnostics.Trace class to log information to the application diagnostic logs. For example:
System.Diagnostics.Trace.TraceError("Error found");
How to filter log trace levels sent to Log Analytics/Storage account/Event hub
If you have various trace levels in your web app but are only interested in having certain levels of logs sent to the logging endpoint, you can set a filter for the minimum level in your application settings under Configuration. By default, even without the app setting, the minimum trace level is set to Warning.
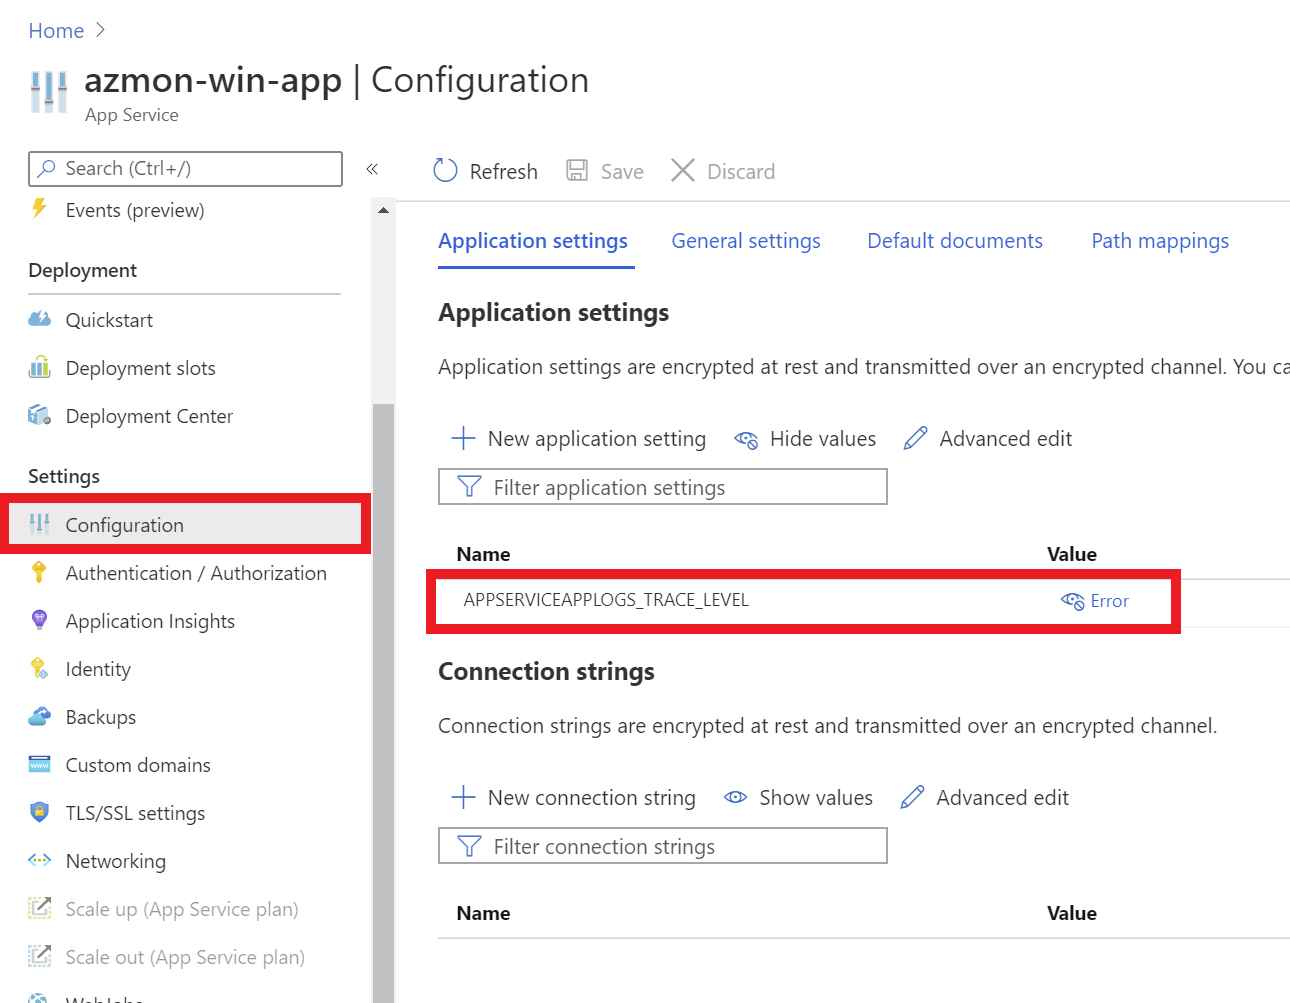
How to set App setting for AppServiceAppLogs level
The application setting name will be APPSERVICEAPPLOGS_TRACE_LEVEL and the value will be the minimum level (ie. Error, Warning, Verbose, etc.). Refer to TraceLevel for more info.
The trace level value is case sensitive. Make sure the first letter is uppercase and the rest is lowercase (ie. Error, Warning, etc.)
For example, if you are only interested in seeing logs that are of level Error and higher, you will set your application setting APPSERVICEAPPLOGS_TRACE_LEVEL to Error.
How logs show up in Log Analytics
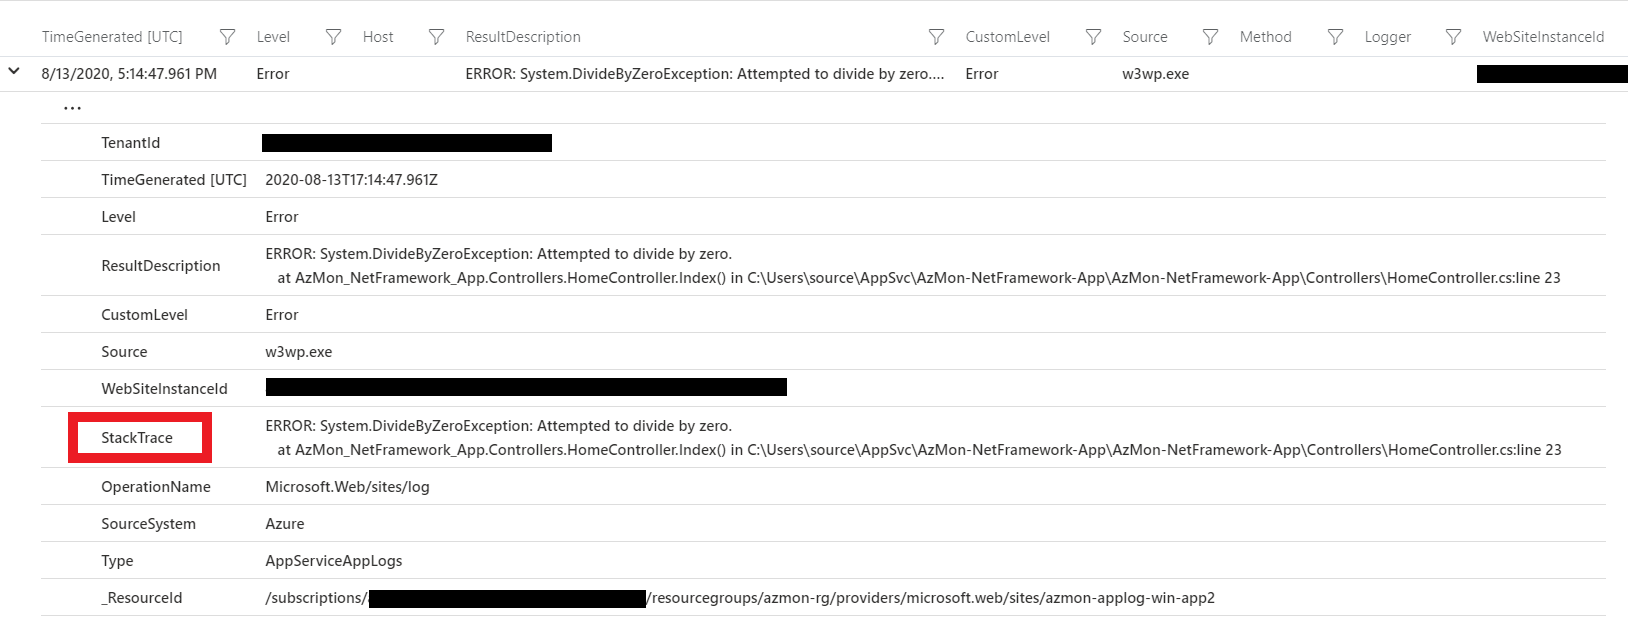
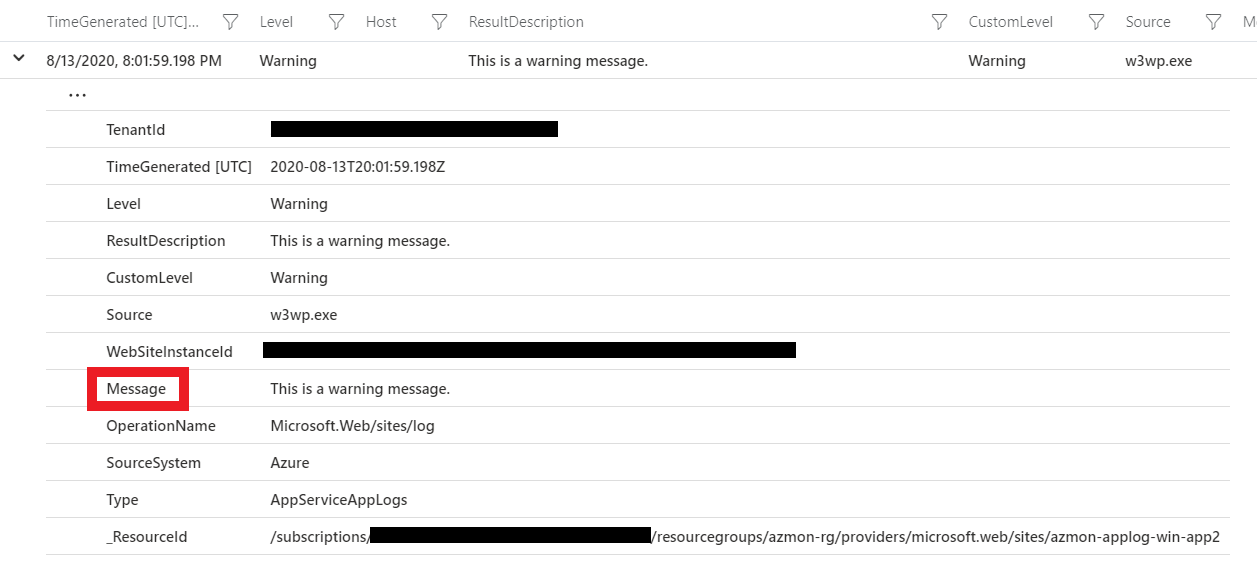
The texts of your logs will generally show up in the “Message” field in Log Analytics, but if you have an Error log, you will find the text in the “StackTrace” field. Look at the samples below and note the difference in the fields.
Below is a sample result from an Error log:
Below is a sample result from an Warning log:
Sample queries in Log Analytics
You can use the different levels of logging such as Error, Information, and etc. in your application and this will show up in your logs in Log Analytics under the “Level” field. You are able to filter out logs based on the level. The example below shows how you can filter for only Error Level logs:
AppServiceAppLogs
| where Level == "Error"
FAQ
Q: I’m not seeing any logs on my Storage account/Log Analytics/Event Hub
A: On Windows, this log is currently only supported for ASP .NET applications. If your application isn’t an ASP .NET application, you won’t be seeing the logs. However, if your application is an ASP .NET application, there are a couple of possible reasons why your logs aren’t showing:
- Did you enable the AppServiceAppLogs?
- Did you update the Web.config file?
- Did you add logs to your code?
Q: Why aren’t my logs that are lower than Warning showing up?
A: By default, Warning logs and higher will be only be sent, however, you can set the minimum trace level of the logs you would like to see. Refer to how to filter log trace levels sent to Log Analytics/Storage account/Event hub. Note that the app setting is case sensitive.
Q: Why can’t I see my Trace, Debug, or Info logs?
A: By default, Warning logs and higher will be only be sent, however, you can set the minimum trace level of the logs you would like to see. Refer to how to filter log trace levels sent to Log Analytics/Storage account/Event hub. Note that the app setting is case sensitive.