App Service Integration with Azure Monitor (Preview)
We are happy to announce that App Service has new and improved integration with Azure Monitor (preview). You can now send your logs from Windows or Linux App Service to Storage Accounts, Event Hubs, or Log Analytics.
Increased visibility into your web apps
Azure Monitor is the central observability service to collect, analyze, and act on telemetry from your other Azure resources. You can use Azure Monitor to set up rule-based alerts, create dashboards, export to third-party services with Event Hubs, or archive logs and metrics for compliance needs.
App Service’s improved integration with Monitor enables new observability scenarios for development and operations teams. Developers can set up automatic emails with full stack traces when an exception is thrown. Operations teams can create dashboards to view the overall performance and stability of their applications. Compliance teams can monitor login attempts and file changes.
App Service integration with Azure Monitor is currently in preview.
Six brand new log types
App Service now outputs the following log types into Azure Monitor.
- AppServiceConsoleLogs: Any logs or output written to the console (also known as standard output or standard error)
- AppServiceHTTPLogs: Access logs from the web server (IIS for Windows web apps, Nginx for Linux)
- AppServiceEnvironmentPlatformLogs: Logs for visibility into ASE operations such as scaling, configuration changes, and status
- AppServiceAuditLogs: Logs for any user login via FTP or Kudu
- AppServiceFileAuditLogs: Logs for file changes (add, delete, or update) via FTP or Kudu
- AppServiceAppLogs: Any logs or exceptions written to the stack’s logging utility. Supports multi-line logs and exceptions
- AppServiceIPSecLogs: Logs request made to the web app with IP info if there were IP access restriction rules set up
- AppServicePlatformLogs: Logs from containers (ie. “docker run”)
- AppServiceAntivirusScanAuditLogs: Logs from the anti-virus scan using Windows Defender (see blog for more information)
The table below shows the current availability for the log categories.
| Log type | Windows | Windows Container | Linux | Linux Container | Description |
|---|---|---|---|---|---|
| AppServiceConsoleLogs | Java SE & Tomcat | Yes | Yes | Yes | Standard output and standard error |
| AppServiceHTTPLogs | Yes | Yes | Yes | Yes | Web server logs |
| AppServiceEnvironmentPlatformLogs | Yes | N/A | Yes | Yes | App Service Environment: scaling, configuration changes, and status logs |
| AppServiceAuditLogs | Yes | Yes | Yes | Yes | Login activity via FTP and Kudu |
| AppServiceFileAuditLogs | Yes | Yes | TBA | TBA | File changes made to the site content; only available for Premium tier and above |
| AppServiceAppLogs | ASP .NET | ASP .NET | Java SE & Tomcat 1 | Java SE & Tomcat 1 | Application logs |
| AppServiceIPSecAuditLogs | Yes | Yes | Yes | Yes | Requests from IP Rules |
| AppServicePlatformLogs | TBA | Yes | Yes | Yes | Container operation logs |
| AppServiceAntivirusScanAuditLogs | Yes | Yes | Yes | Yes | Anti-virus scan logs using Microsoft Defender; only available for Premium tier |
1 For Java SE apps, add the app setting WEBSITE_AZMON_PREVIEW_ENABLED and set it to 1 true.
Getting Started
Prerequisites
Before you start, make sure you have the following resources created.
- Create an App Service app
- Create a Storage Account, Event Hub Namespace, or Log Analytics workspace to send your logs to
Create a Diagnostic setting
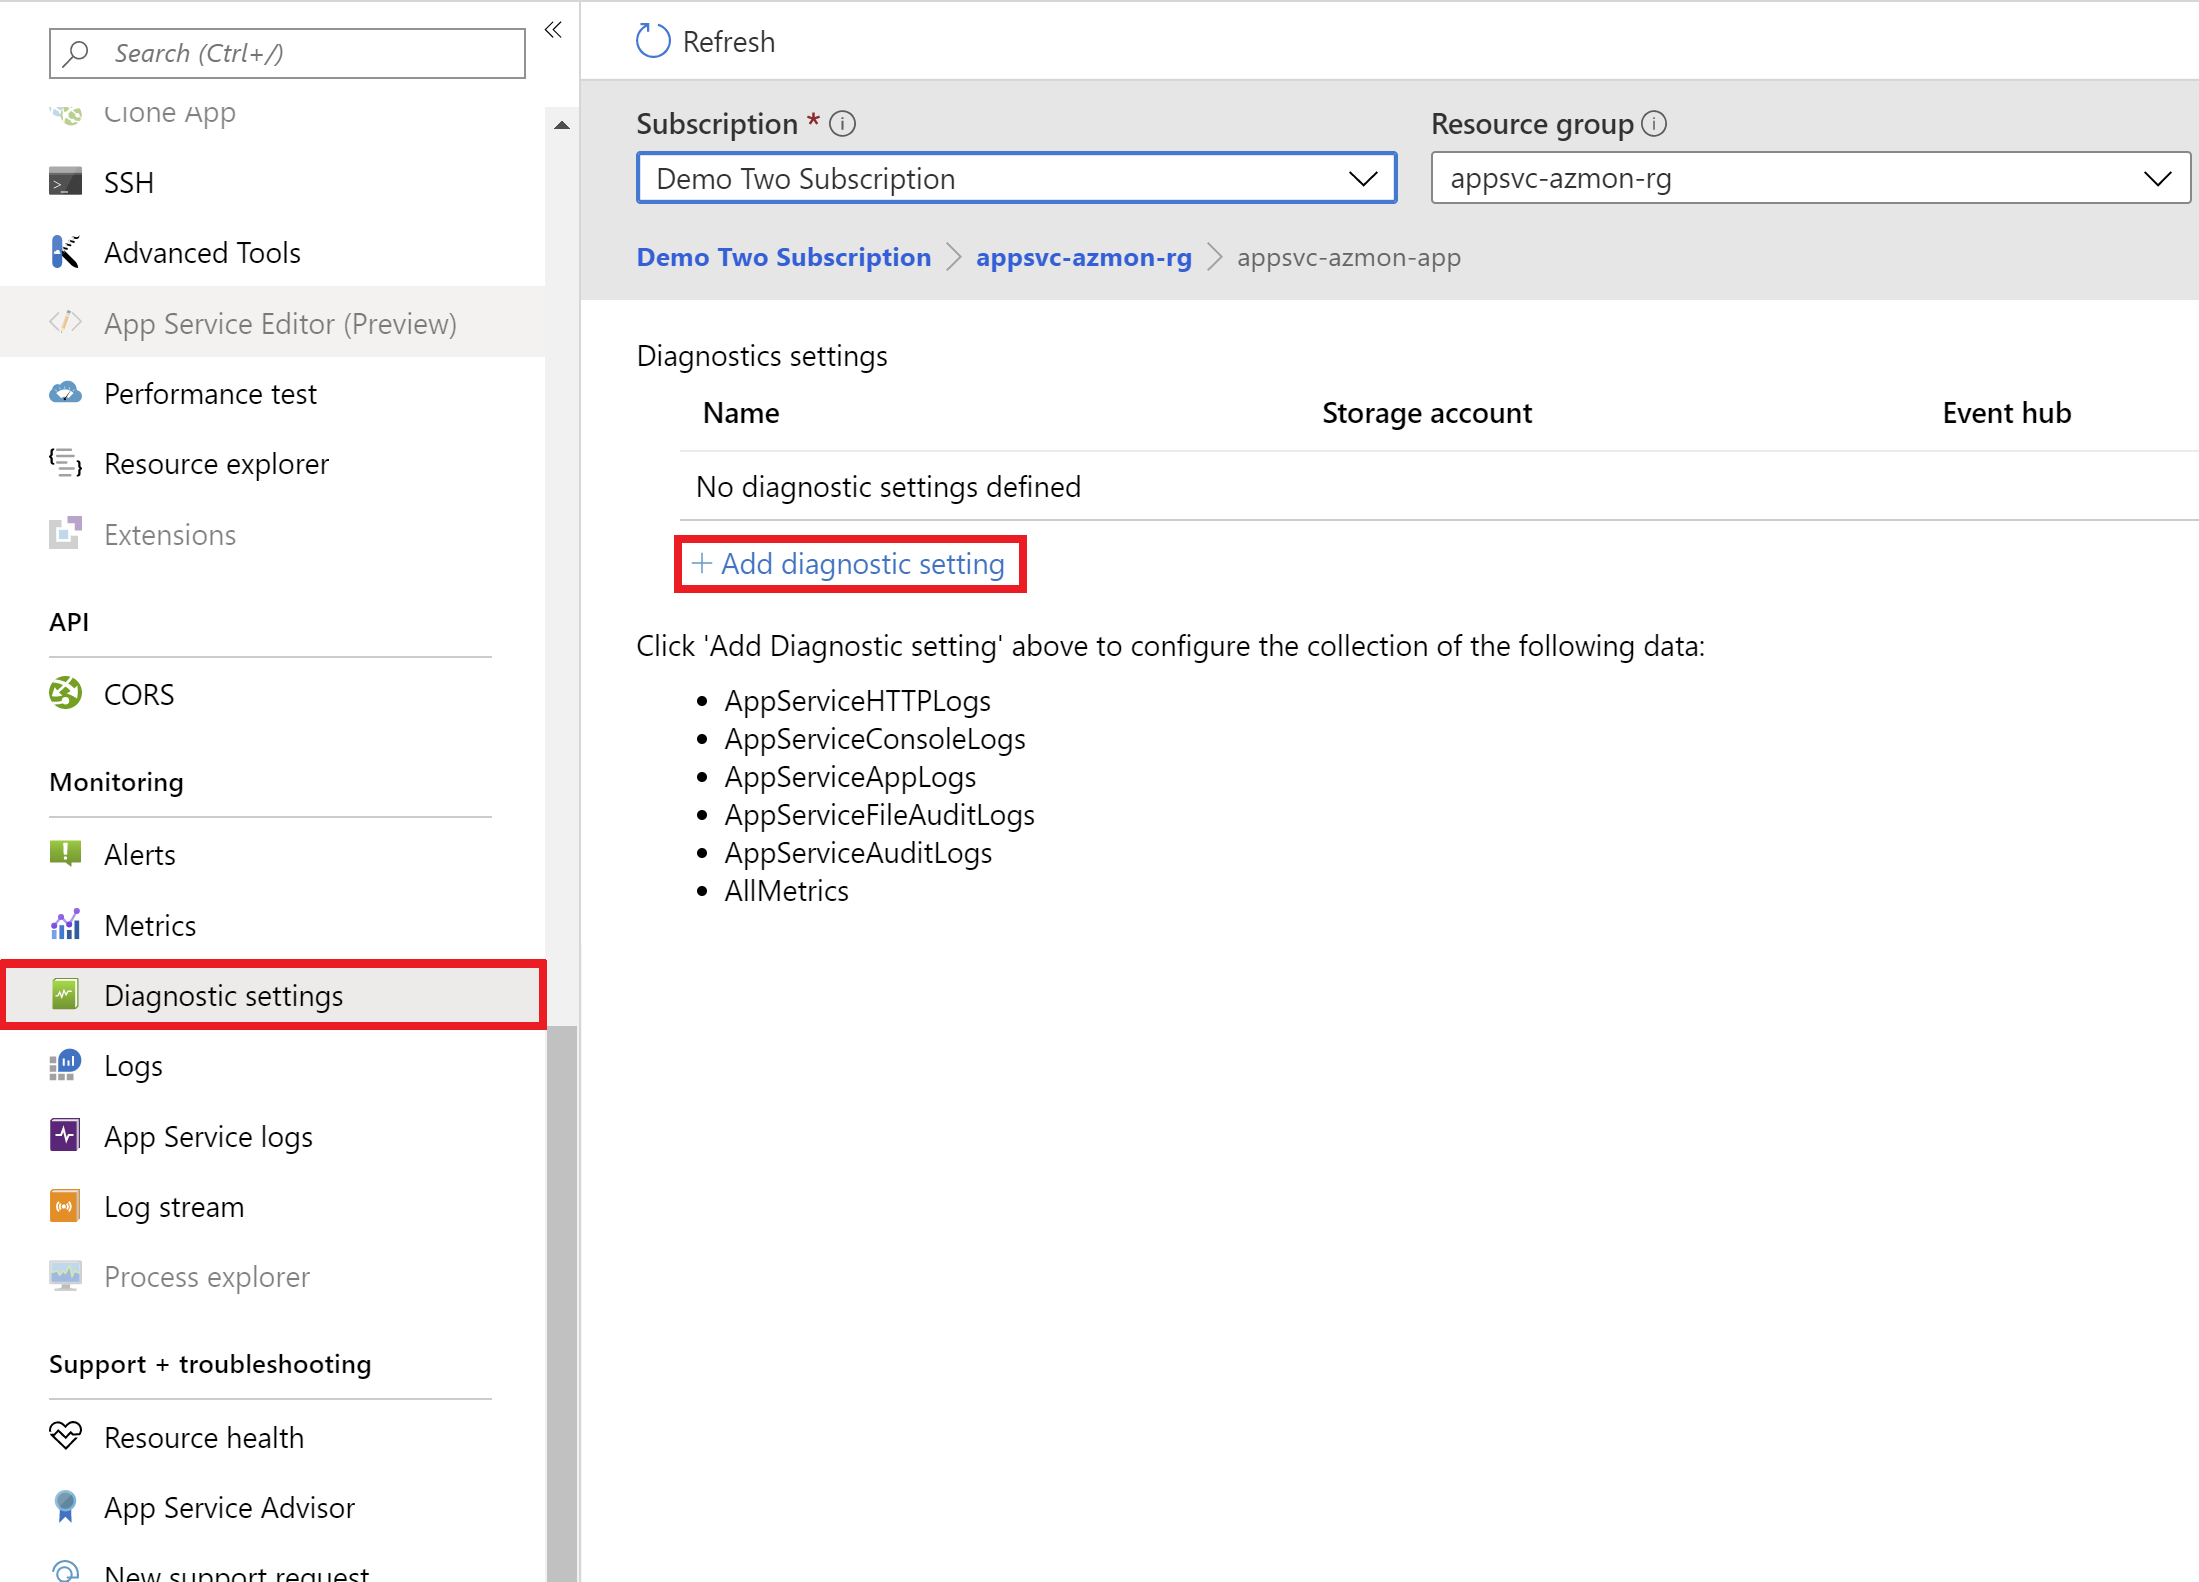
In the Azure portal, navigate to your App Service. Under Monitoring, select Diagnostic settings > Add diagnostic setting.
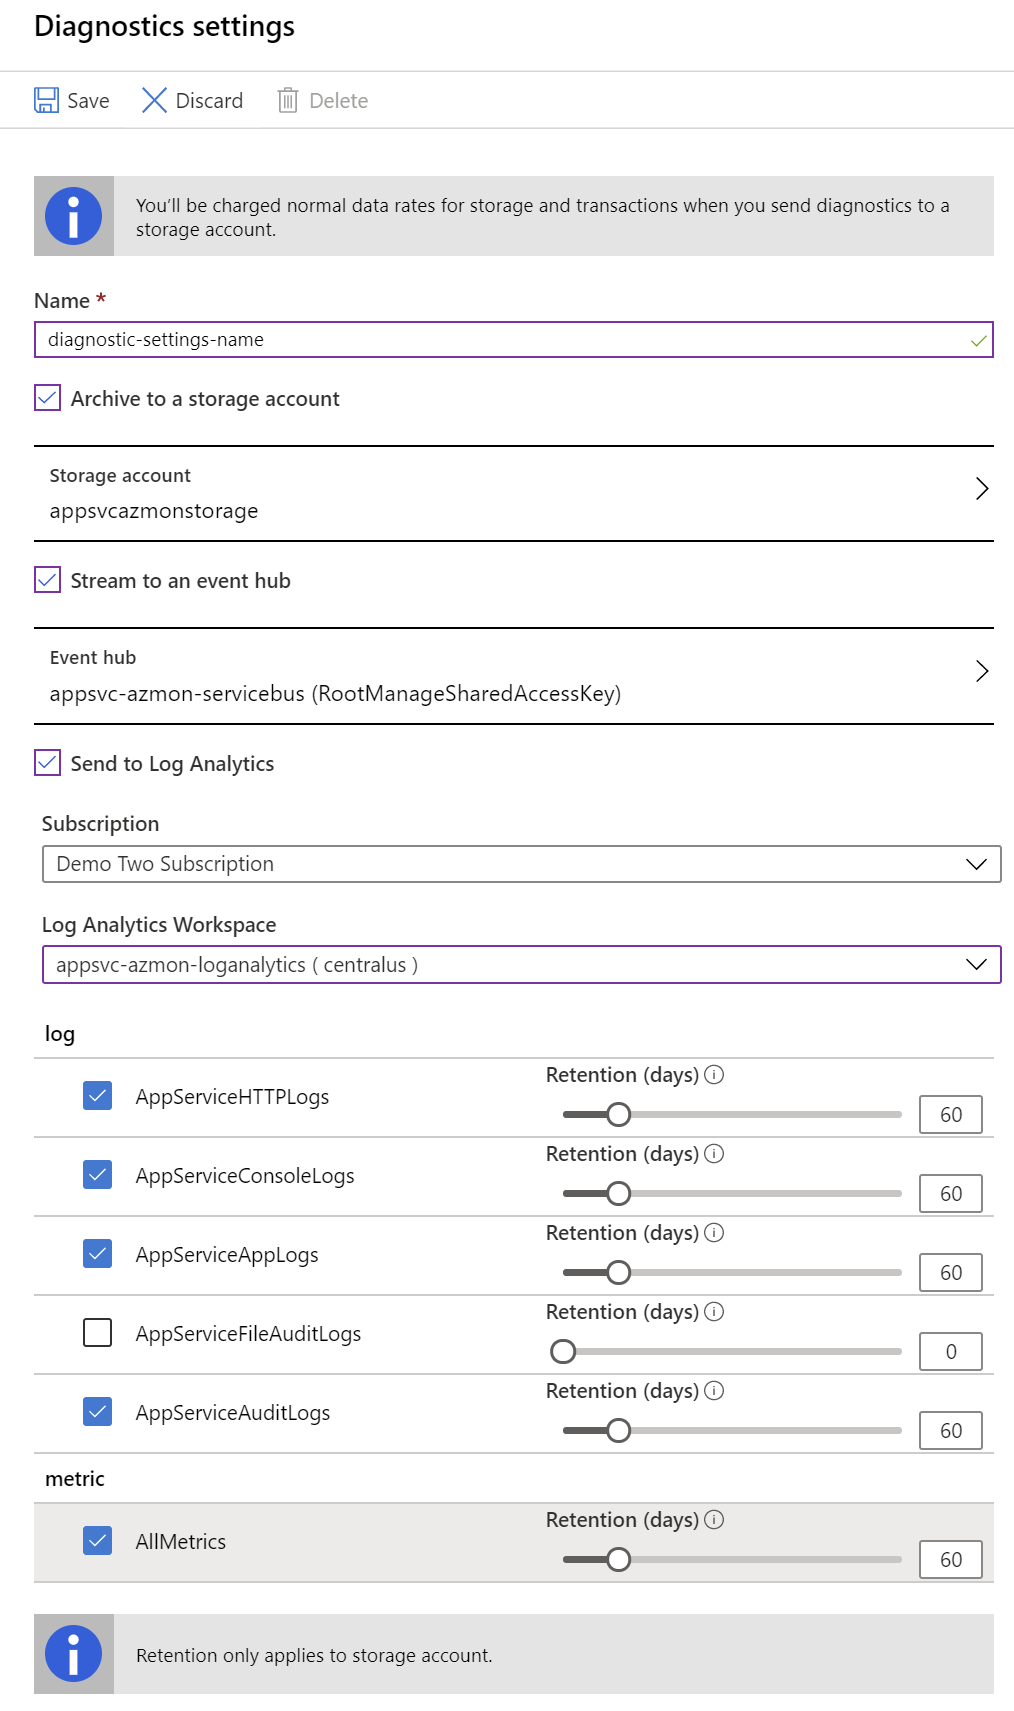
Enter the following information to create the Diagnostic setting.
-
Provide a name for the Diagnostic setting
- Select your desired destination(s) for the logs. There are three possible destinations:
- Storage Account: Archive your logs for auditing or backup
- Needs to be in the same region as your web app
- Configure the retention days for the storage account
- Event Hub: Stream the logs to third-party logging and telemetry systems
- Log Analytics Workspace: Analyze the logs with other monitoring data and leverage Azure Monitor features such as log queries and log alerts
- Storage Account: Archive your logs for auditing or backup
-
Select the desired log categories to export. There are six log categories in addition to your metrics. The table below lists the log types with its description and availability per OS. The earlier section shows the availability of each log type
-
Select Save at the top. This will trigger App Service to begin sending your logs to the chosen destinations.
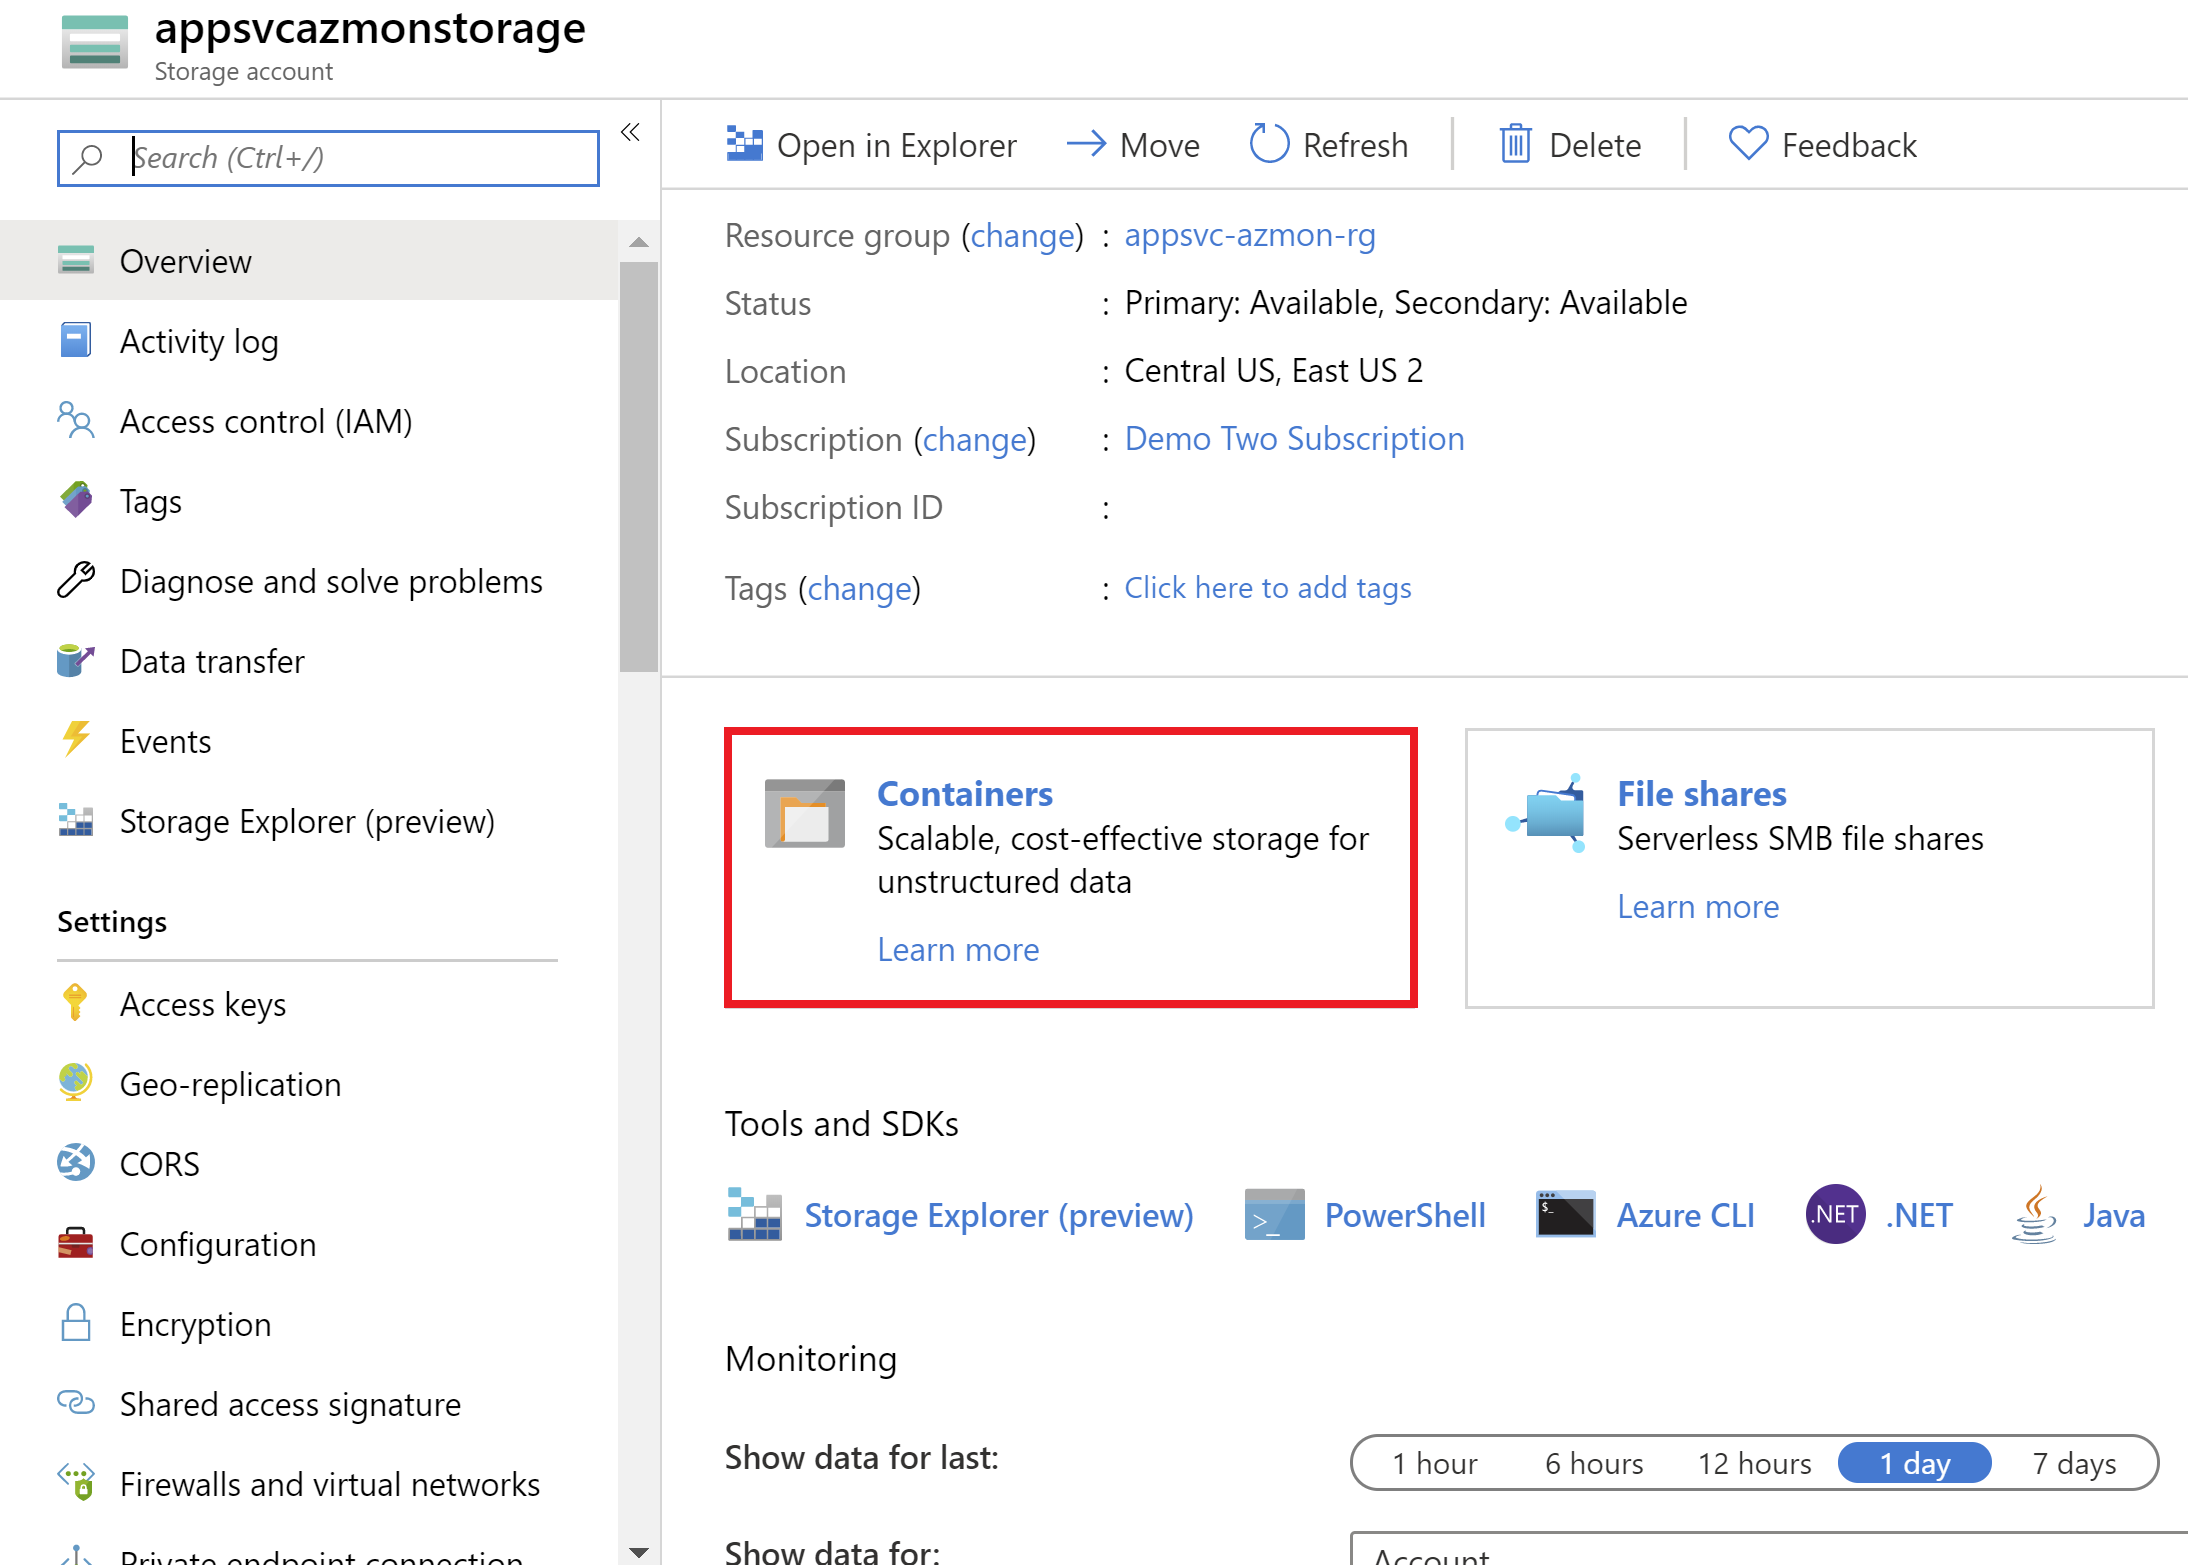
View logs in a Storage account
Open the Storage account you configured in the diagnostic setting. Then select Containers.
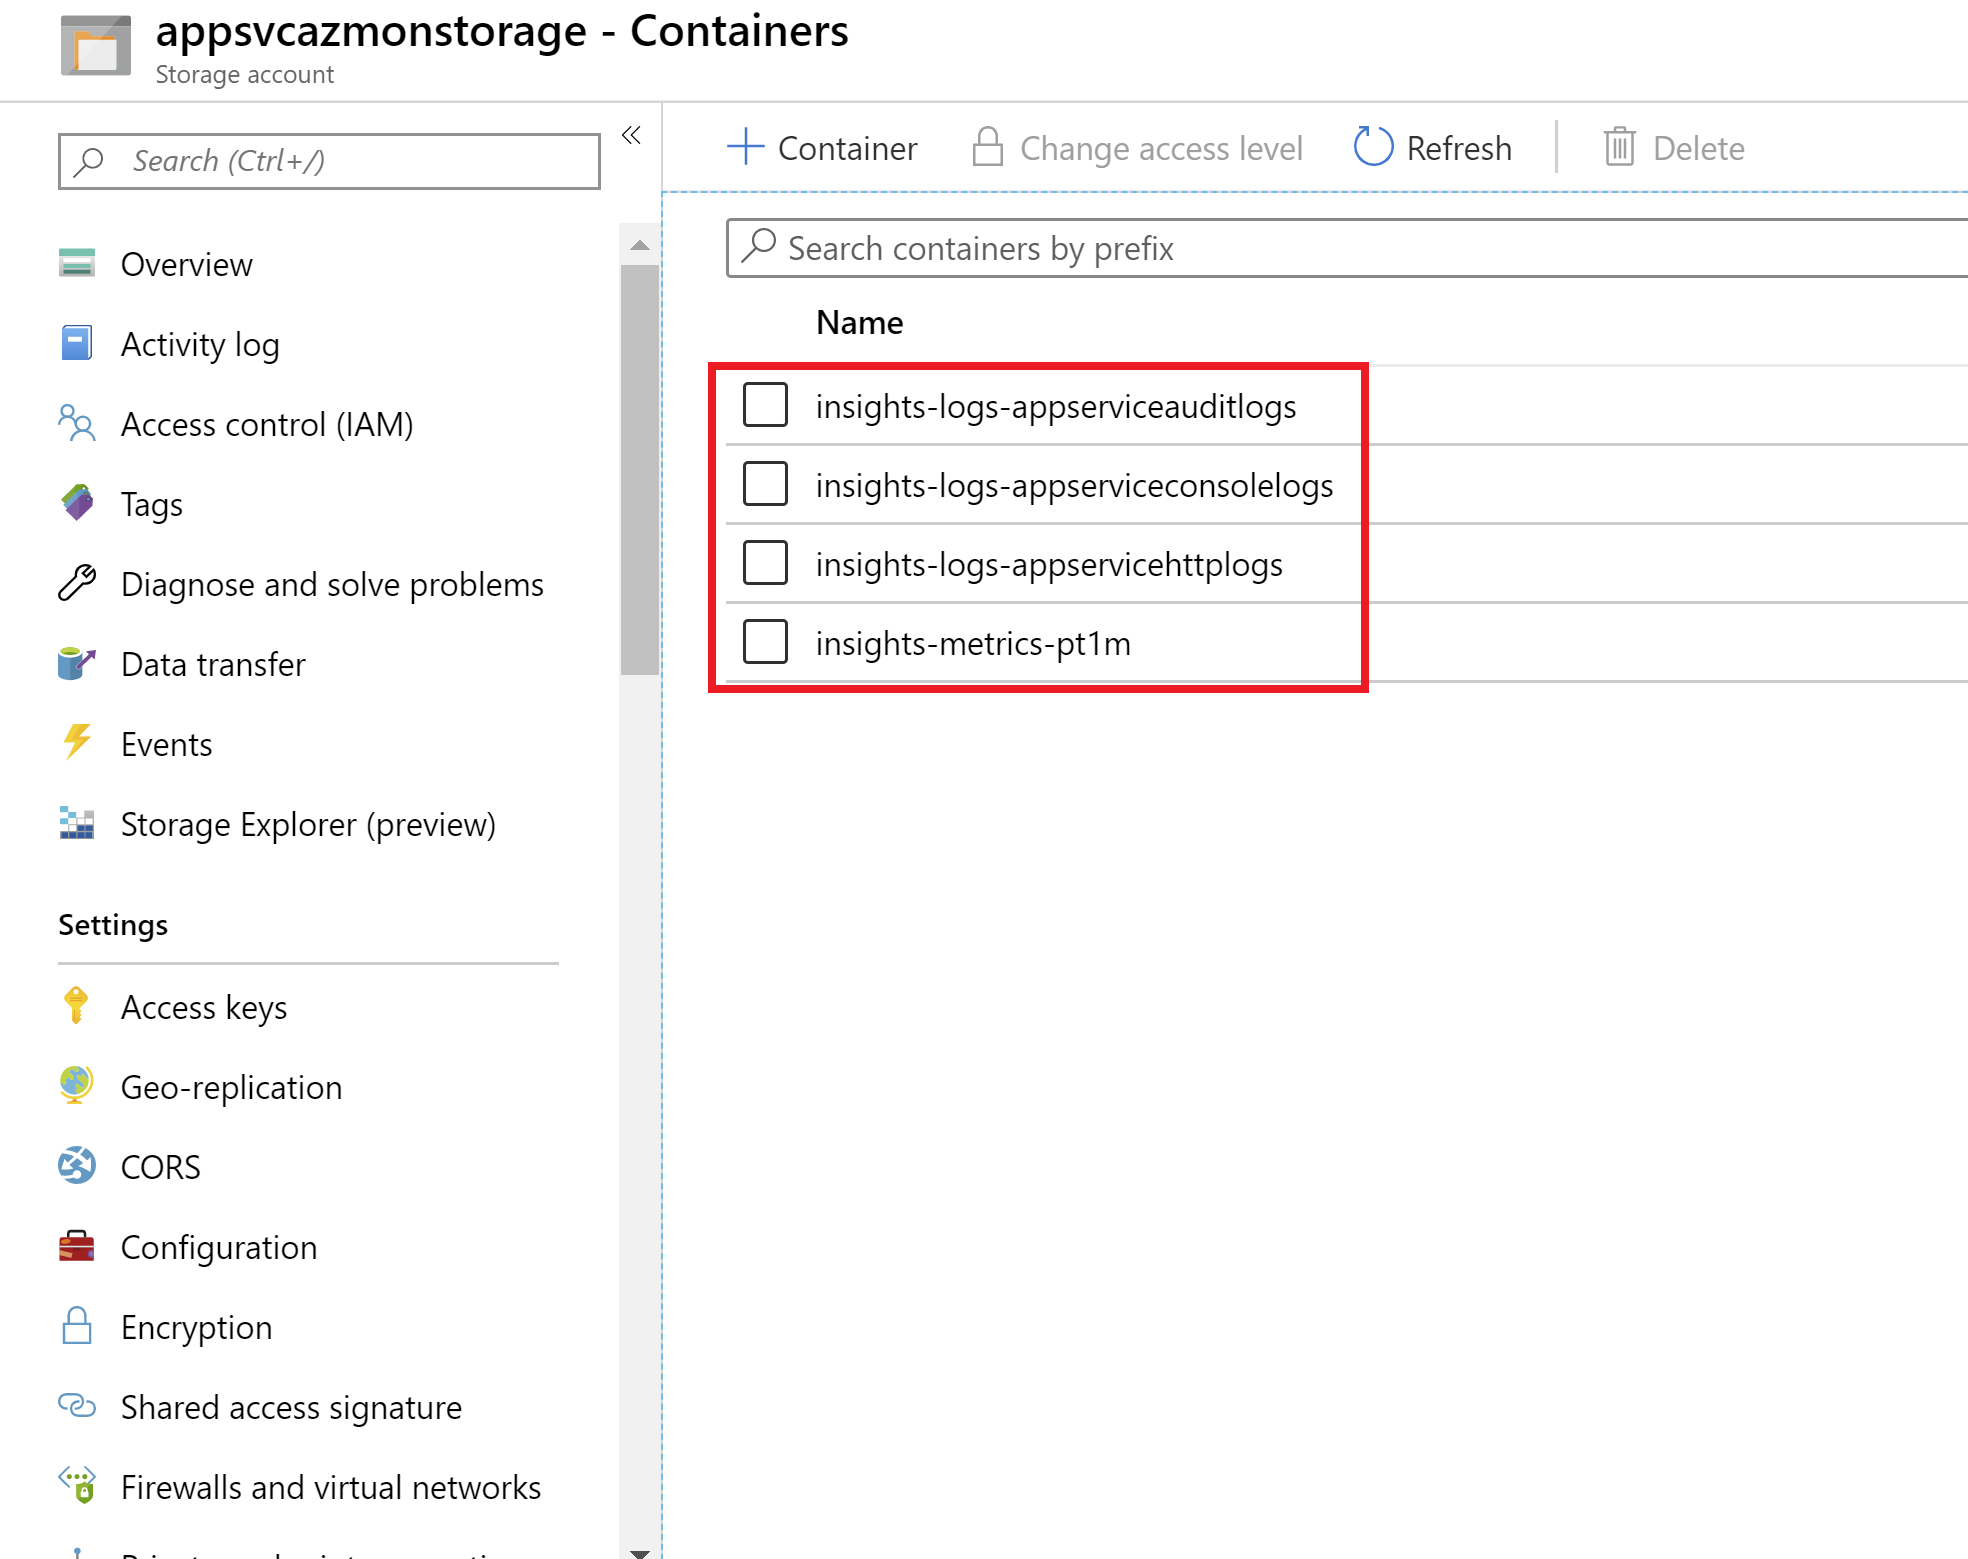
You will see a list of containers that have been automatically created for the logs categories you enabled.
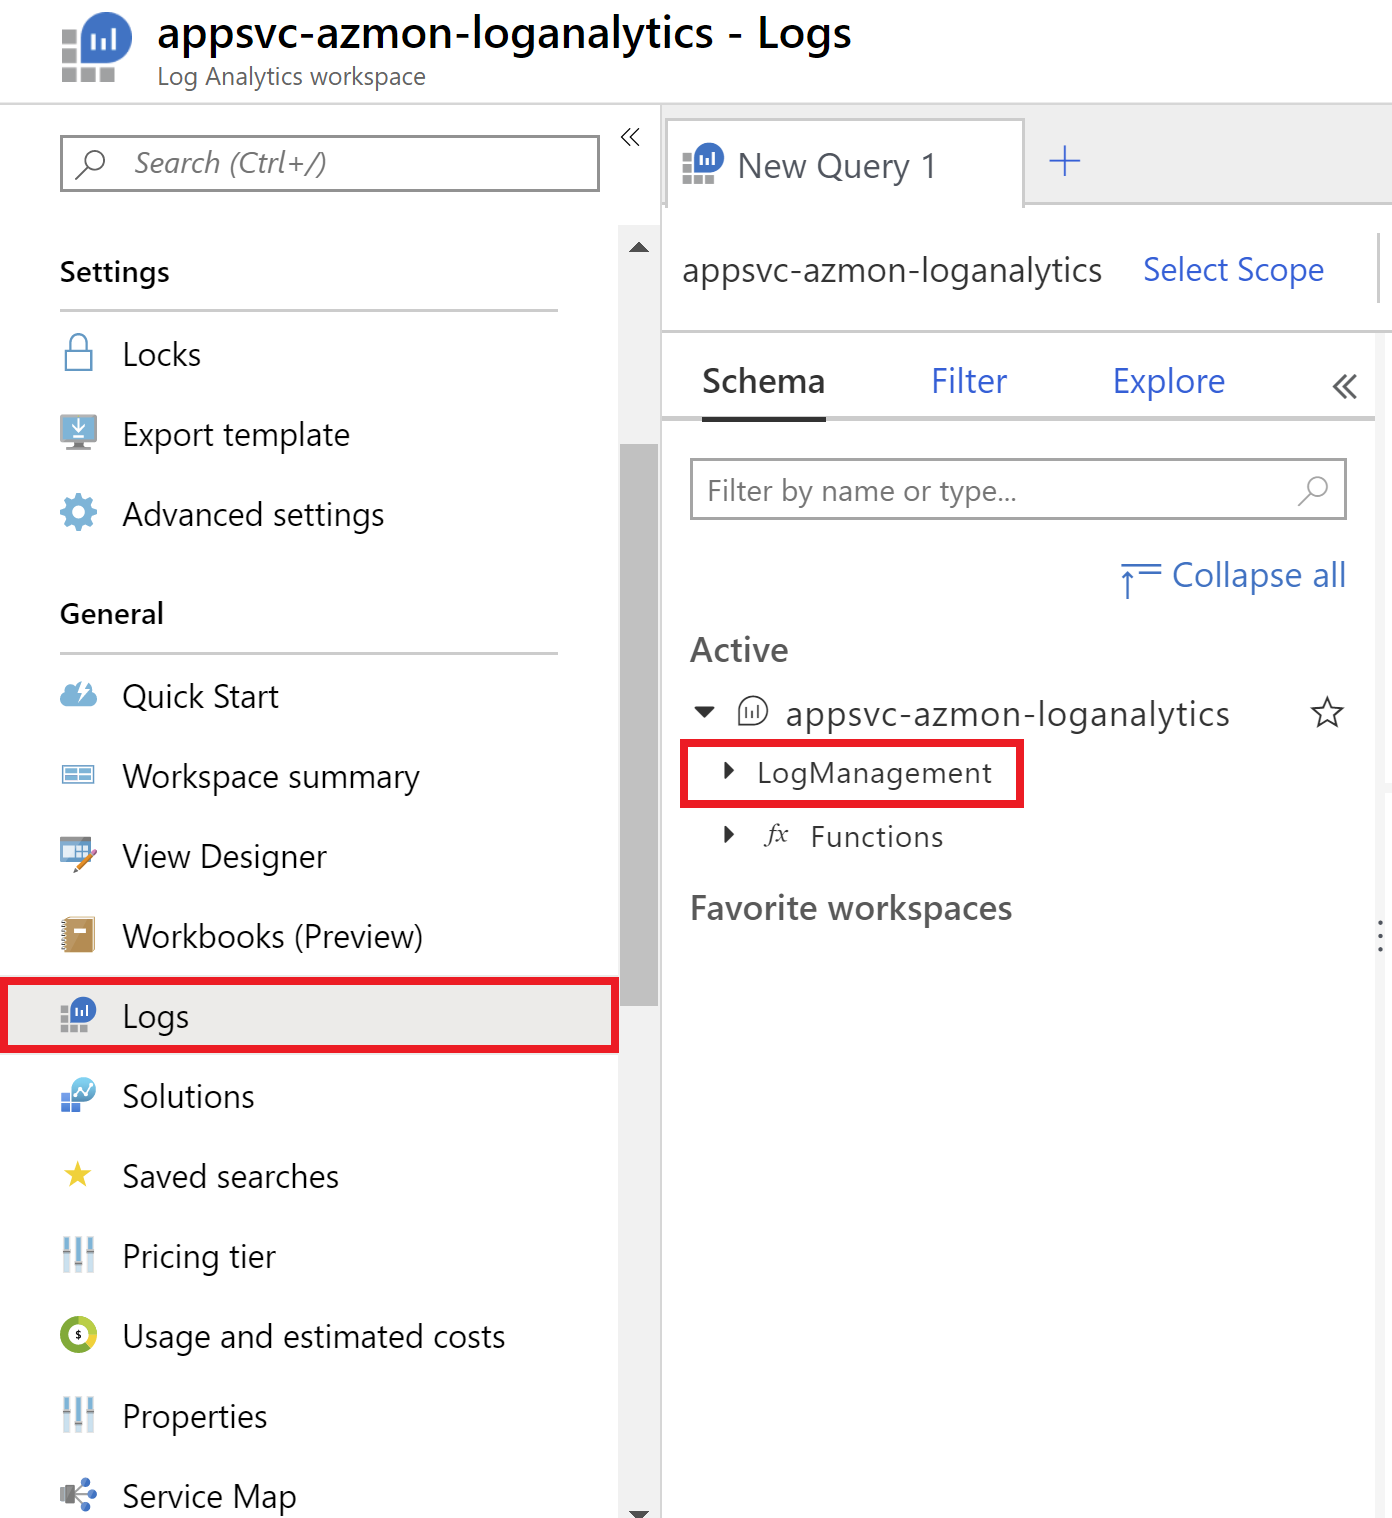
Query logs in a Log Analytics Workspace
Open the Log Analytics Workspace you configured in the diagnostic setting. Select Logs, then select LogManagement. (You will see log categories that you have not enabled.)
The App Service log categories are all prefixed with AppService*. Select an App Service log category, this will copy the table name into the query editor. Select Run above the editor, this will execute a simple query to show all columns of the table.
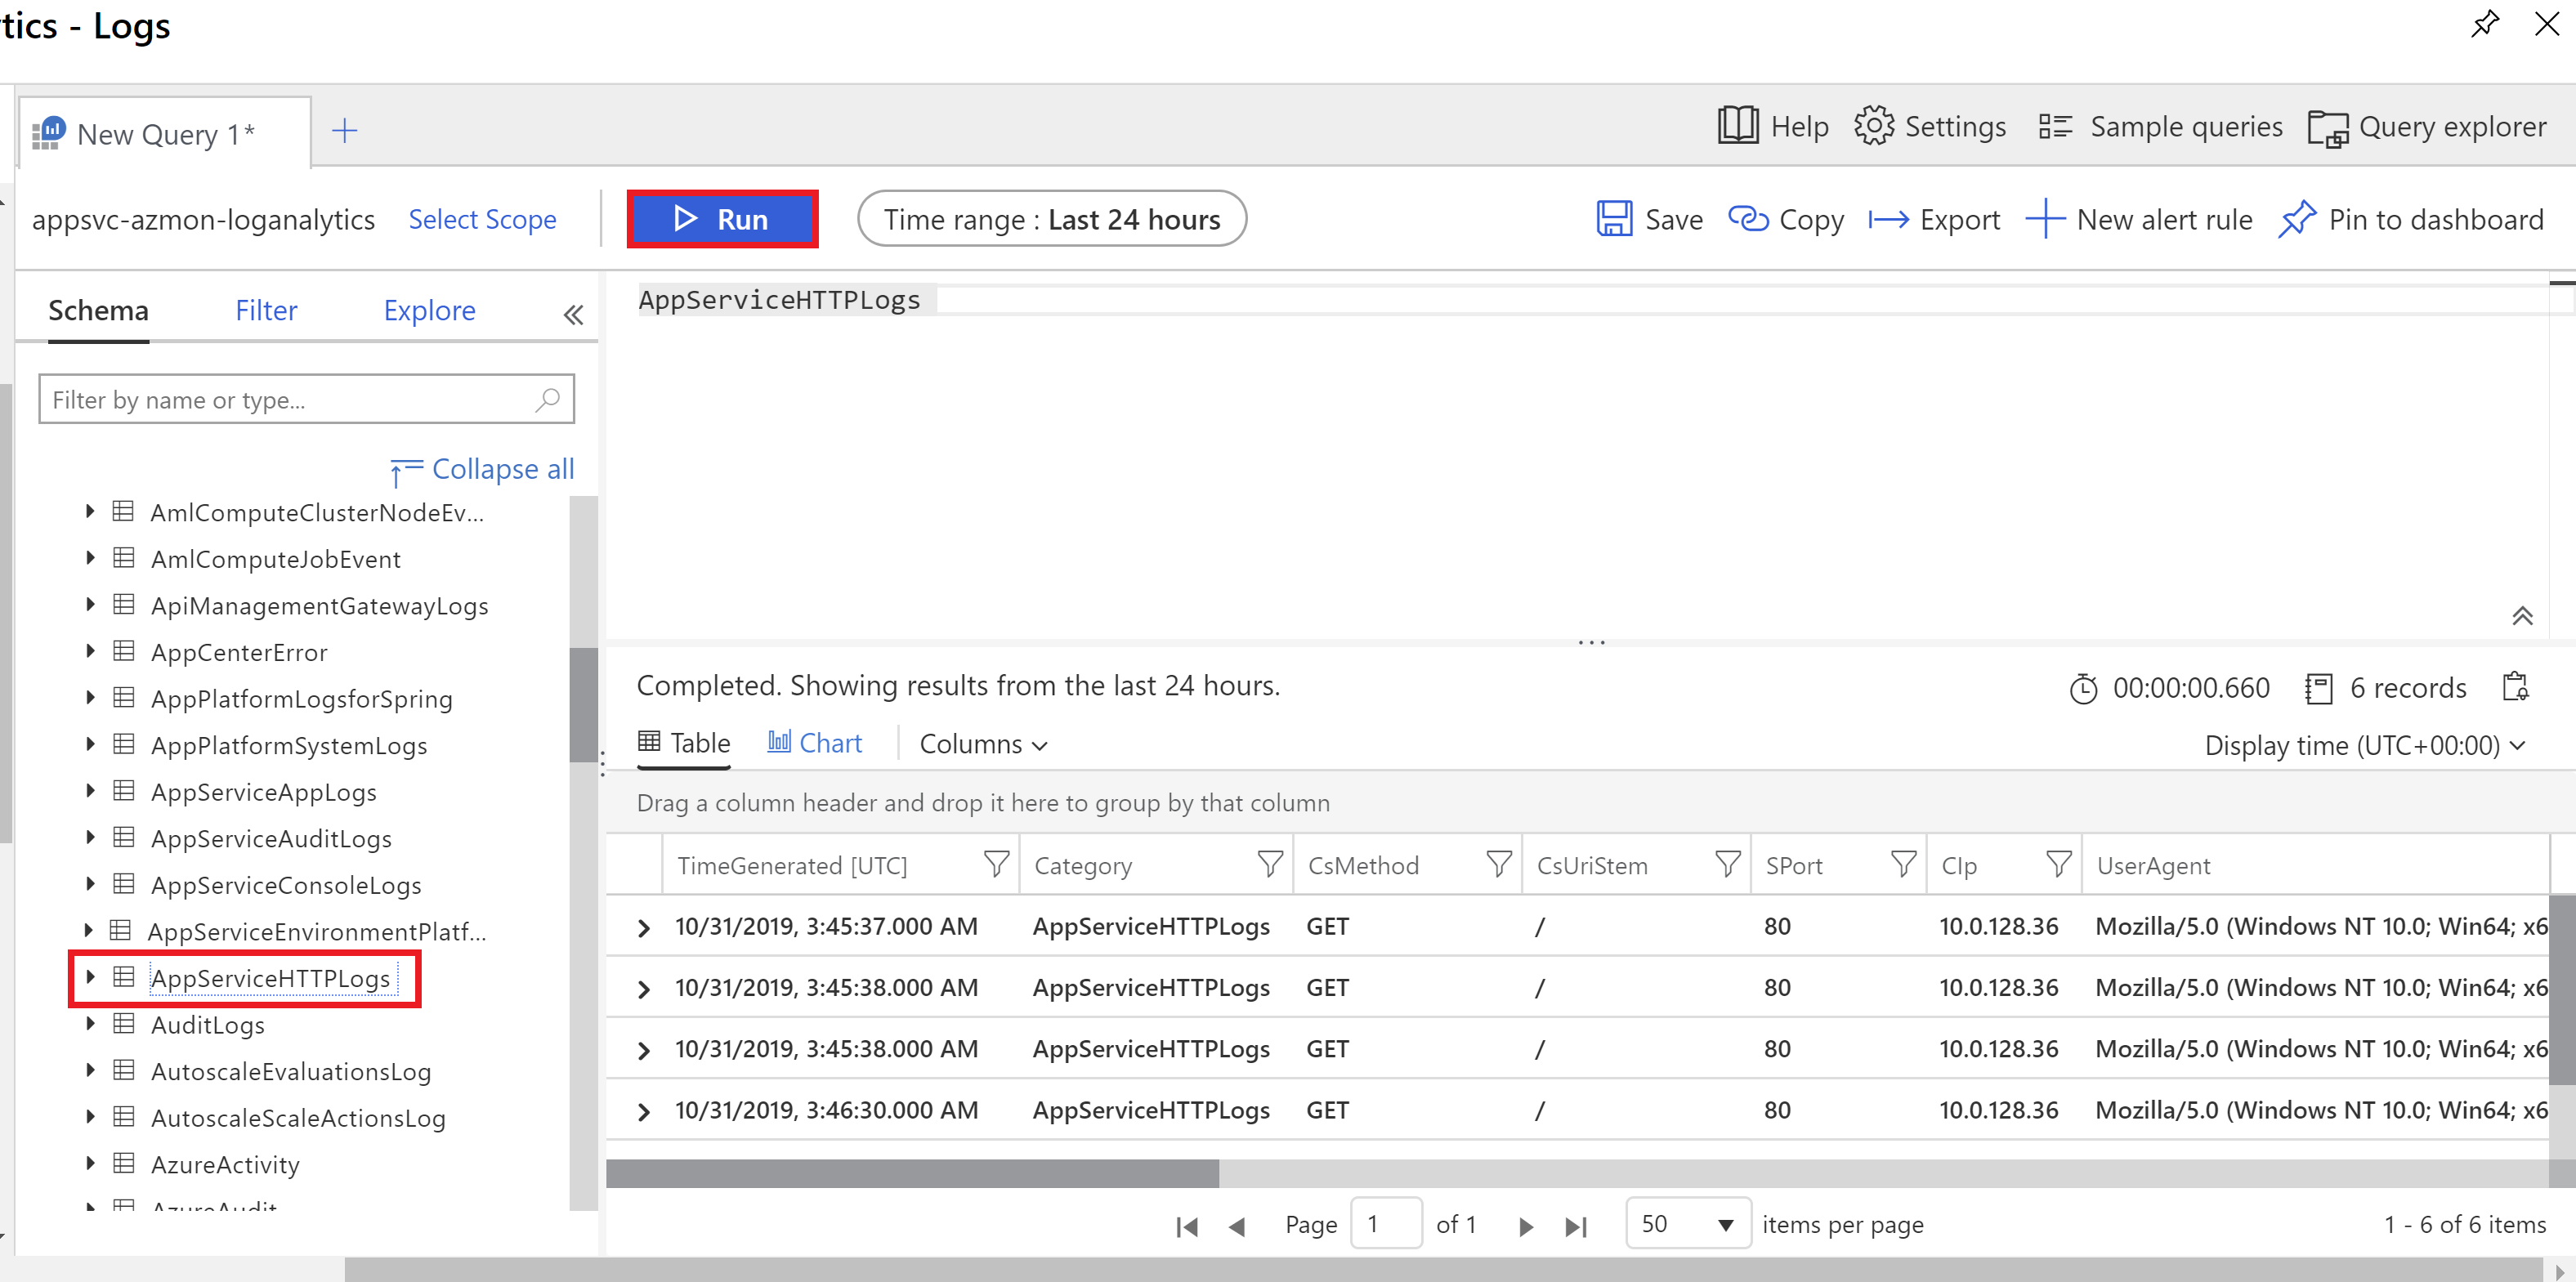
See this article for more information on the Kusto Query Language.
Stream logs from Event Hubs
Event Hubs allows you to stream your logs and metrics to 3rd party logging and telemetry systems or to Power BI. To get started, please see the Event Hubs documentation.