Mitigate your CPU problems before they happen
Currently offered in App Service Diagnostics for Windows web apps.
Imagine there is a CPU spike in your cloud application at 2:00 in the morning, would you like to be woken up to mitigate and troubleshoot the issue or would you rather have the issue mitigated automatically and troubleshoot after a good night’s sleep? For those of us that enjoy a good night’s sleep, Proactive CPU monitoring is an easy, proactive way to take an action when your app or its child process is consuming too much CPU. You can configure CPU rules to temporarily mitigate a high CPU issue until the real cause for the unexpected issue is found.
Finding Proactive CPU Monitoring
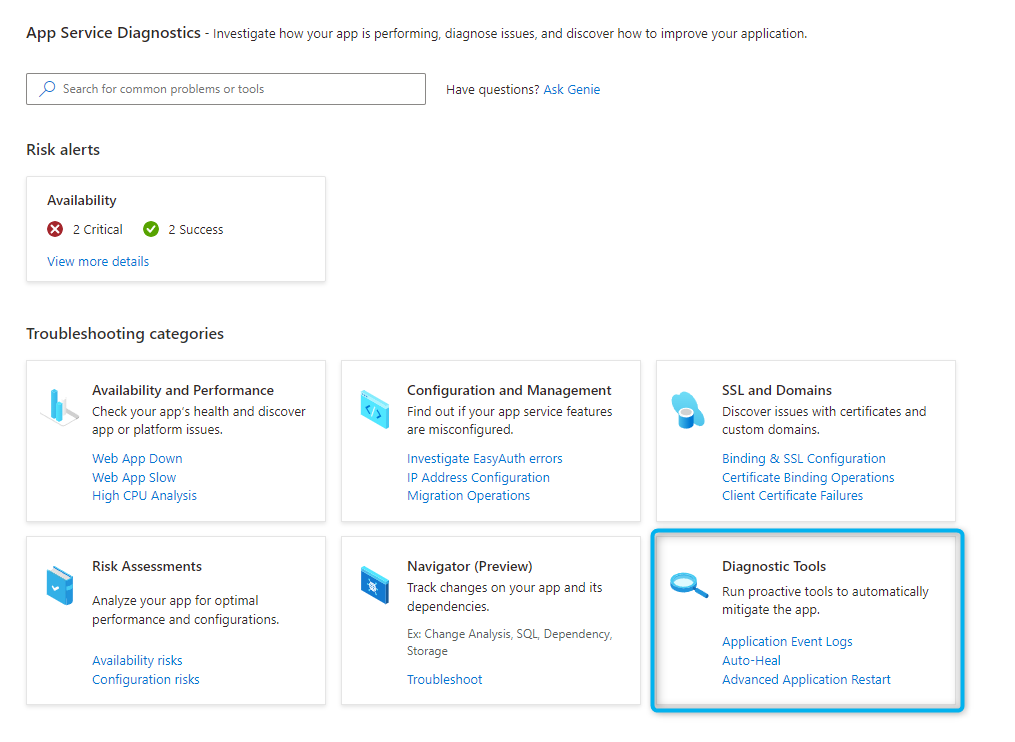
To access Proactive CPU Monitoring, browse to your App Service web app in Azure portal and click Diagnose and solve problems in the left navigation panel. Then, click on the homepage tile named Diagnostic Tools. Once you are inside Diagnostic Tools, click Proactive CPU Monitoring.
Configuring Proactive CPU Monitoring
Proactive CPU monitoring operates based on 5 conditions and 4 modes of action by checking w3wp.exe process of the site or any child processes.
Conditions
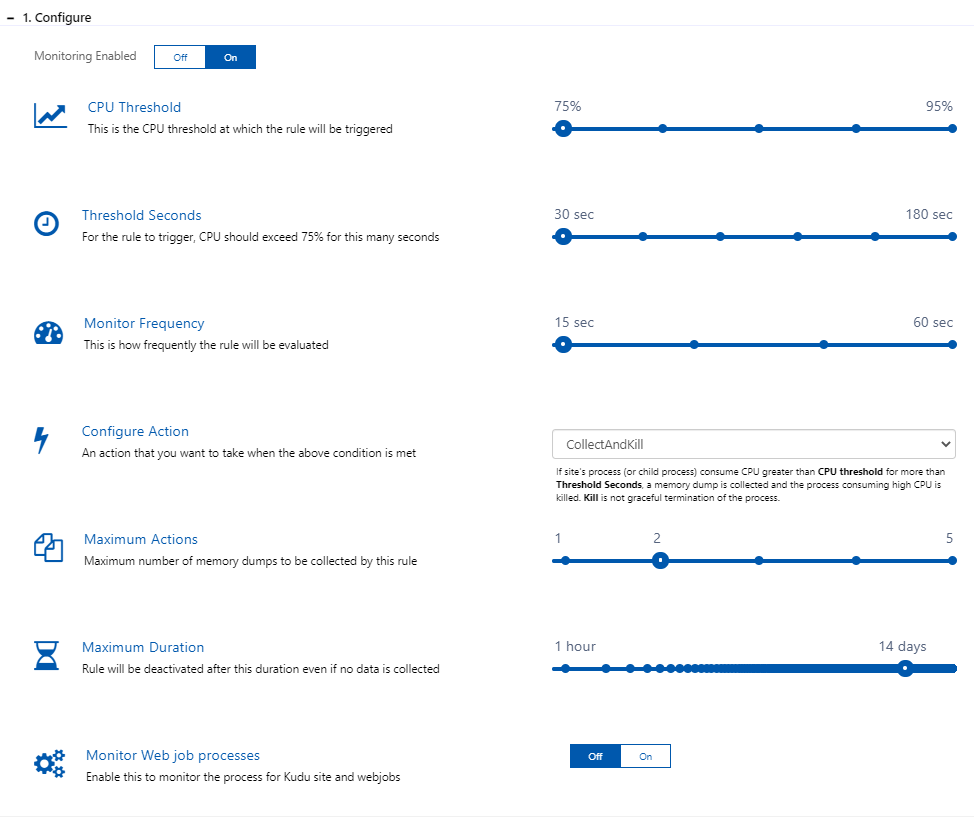
There are five conditions you can configure to tailor to your needs.
- CPU Threshold: the CPU threshold at which the rule will be triggered
- Threshold Seconds: the duration of the CPU exceeding the CPU threshold. The rule will be triggered at the end of the duration.
- Monitor Frequency: defines how often the condition will be evaluated
- Maximum Actions: the maximum number of memory dumps that the rule collects, ensuring no dumps are collected beyond the set amount
- Maximum Duration: the maximum duration of the rule until it becomes deactivated
Actions
Once the conditions are met, your selected action is triggered. Proactive CPU Monitoring offers 4 different modes listed below.
-
Collect: In this mode, a memory dump is collected whenever any process consumes CPU greater than the CPU Threshold for longer than the allowed Threshold Seconds. (Monitor Duration should always be lower than Threshold Seconds) Memory dump is collected via
ProcDump.exe, and the number of dumps (or actions) are controlled by Maximum Actions. Once Maximum Duration is met, the rule becomes deactivated.When the memory dump is collected, the process is frozen until the dump generation completes. The time the process is frozen depends directly on the memory consumed by the process. The size of the dump generated is also directly proportional to the memory consumed by the process.
-
Kill: In this mode, the process is killed when the condition is met. The Maximum Actions is not honored and monitoring stops automatically after Maximum Duration. Kill is a forceful termination of the process and not a graceful exit. All requests that the current worker process is processing will be terminated, and end users may see 502 errors. If system terminates the child process, the error message may even be 500 or some form of application exception based on the stack.
-
Collect and Kill: In this mode, a memory dump is collected and the process consuming high CPU is killed when the site’s process (or child process) consumes CPU greater than CPU threshold for more than Threshold Seconds. No analysis is performed but after the session finishes, you have an option to analyze the memory dump after the session ends by clicking the Analyze button.
-
Collect, Kill, and Analyze: In this mode, a memory dump is collected and the process consuming high CPU is killed when a site’s process (or child process) consumes CPU greater than the CPU threshold for longer than the allowed Threshold Seconds. In addition, CPU dumps are analyzed by DumpAnalyzer tool, and an analysis report is generated. Analyzing a dump with this tool has some CPU impact on the instance and takes roughly 5-7 minutes at minimum to analyze one dump file. Analysis can take longer if the dump size is larger and depending upon what is captured in the dump.
To prevent CPU overhead, only one dump is analyzed by the instance at a time. For example, if there are 10 instances and say the monitoring collected 5 dumps, all instances in parallel can analyze memory dumps. If there is 1 instance and 5 dumps are collected, the dump analysis will happen one after the other.
Watch a Demo
Watch this video to learn more about the feature and analyzing the dumps and memory analysis report generated by this tool.
What’s Next
Once you set the rule that best suits your app’s need, you can get ahead of your CPU issues, automatically mitigate CPU spikes, and save yourself from a dreadful 2:00am call.
Feel free to share your feedback or questions about Proactive CPU Monitoring by emailing diagnostics@microsoft.com or posting on UserVoice with “[Diag]” in the title.
For more information on other diagnostic tools, please visit Azure App Service diagnostics overview.