App Service Diagnostics – Profiling an ASP.NET Web App on Azure App Service
PuneetG
The Diagnostic Tools options under the Diagnose and Solve blade for Azure App Services has been live for a few months now and has many tools that help you troubleshoot apps based on their application stack. In this post, we are going to cover the Collect .NET Profiler Trace option in detail and how you can use it to troubleshoot a slow or a failing ASP.NET based Web App.
 Profiler tool helps in collecting an on-demand trace that lets you identify the underlying .NET exceptions, time taken in the various request processing pipeline stages and even lets you drill down into exact methods within the application code that are taking time. It is extremely useful in situations where the problem is happening right now and you want to collect some data to identify the root cause of the issue. Profiling is designed for production scenarios and is based on ETW (Event tracing for Windows) . The analysis component of the profiler uses the TraceEvent library to generate a report that helps you drill down in to the problems in matter of a few minutes. It should be noted that no changes are made to your Web App code or your configuration during the collection or the analysis phase. In fact, the web app is not even restarted as a result of capturing this trace. The captured trace has ETW events emitted by the IIS and the ASP.NET providers along with stack traces captured at the CPU level. You can use this tool to efficiently troubleshoot delays which are relatively small (less than a second too) without impacting the run-time performance of the application. The profiler works for both ASP.NET and ASP.NET core applications.
 Add thread report option - With this option enabled, a thread report of all the threads in the process is also collected at the end of the profiler trace. This is useful especially if you are troubleshooting totally hung processes, deadlocks or requests taking more than 60 seconds. This will pause your process for a few seconds until the thread dump is generated. This option is NOT recommended if you are experiencing high CPU on the instance because if the instance is under stress, it might take a long time to even start a new process to collect the thread dumps.
Clicking the Collect Profiler Trace will start profiling the Web App and the wizard will show progress of various steps involved.
Add thread report option - With this option enabled, a thread report of all the threads in the process is also collected at the end of the profiler trace. This is useful especially if you are troubleshooting totally hung processes, deadlocks or requests taking more than 60 seconds. This will pause your process for a few seconds until the thread dump is generated. This option is NOT recommended if you are experiencing high CPU on the instance because if the instance is under stress, it might take a long time to even start a new process to collect the thread dumps.
Clicking the Collect Profiler Trace will start profiling the Web App and the wizard will show progress of various steps involved.
 Once the profiler trace is started, reproduce the issue by browsing the Web App. If you have a Web App running on multiple instances, make sure to browse a few more times to ensure that the requests to the web app get captured in the profiler trace. The default duration for which the profiler trace runs is 60 seconds and during this 60 seconds, all the requests that were made to the Web App get captured in the profiler trace. It is important to note that the profiler trace only has information about the requests that were captured in these 60 seconds (It is possible to increase this duration as mentioned below in this article)
After 60 seconds, the profiler automatically stops, and an analysis component gets triggered that starts analyzing the profiler trace that just got captured. After the analysis finishes, a link to view the profiler report for every instance serving the web app is generated and you click on the Open Report button to view the Analysis report.
Once the profiler trace is started, reproduce the issue by browsing the Web App. If you have a Web App running on multiple instances, make sure to browse a few more times to ensure that the requests to the web app get captured in the profiler trace. The default duration for which the profiler trace runs is 60 seconds and during this 60 seconds, all the requests that were made to the Web App get captured in the profiler trace. It is important to note that the profiler trace only has information about the requests that were captured in these 60 seconds (It is possible to increase this duration as mentioned below in this article)
After 60 seconds, the profiler automatically stops, and an analysis component gets triggered that starts analyzing the profiler trace that just got captured. After the analysis finishes, a link to view the profiler report for every instance serving the web app is generated and you click on the Open Report button to view the Analysis report.
 For troubleshooting slow or slow or hung web applications, click on Slow Requests tab. This view shows you the top 100 slowest requests that got captured in the trace. It also breaks down the time spent in various modules of request execution in IIS and tries to categorize them in to Platform, Network and Application code to give you a quick indication on where the problem might be.

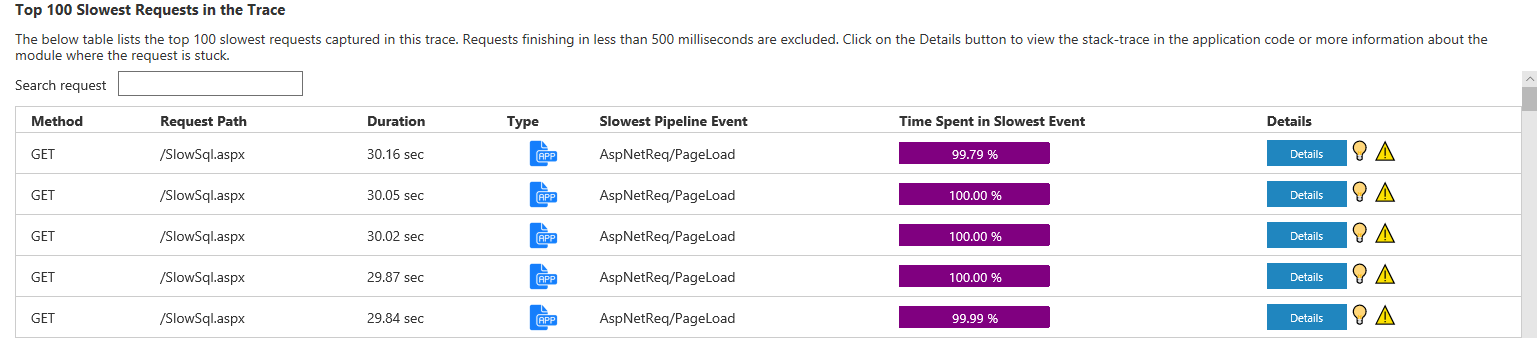 So the above information tells us that the slowest request in this trace took around 30 seconds and 99.79% of the time was spent in the the Page_Load event of ASP.NET which tells us that something in the Page_Load caused the request to slow down hence narrowing the issue down to Application Code.
The Profiler tries its best to correlate the stack trace of thread to the slow requests and if it manages to find this information, a light bulb icon is displayed next to the Details view to illustrate that there are stack traces captured for this request. You can click on the Details button to get the stack trace captured.
So the above information tells us that the slowest request in this trace took around 30 seconds and 99.79% of the time was spent in the the Page_Load event of ASP.NET which tells us that something in the Page_Load caused the request to slow down hence narrowing the issue down to Application Code.
The Profiler tries its best to correlate the stack trace of thread to the slow requests and if it manages to find this information, a light bulb icon is displayed next to the Details view to illustrate that there are stack traces captured for this request. You can click on the Details button to get the stack trace captured.
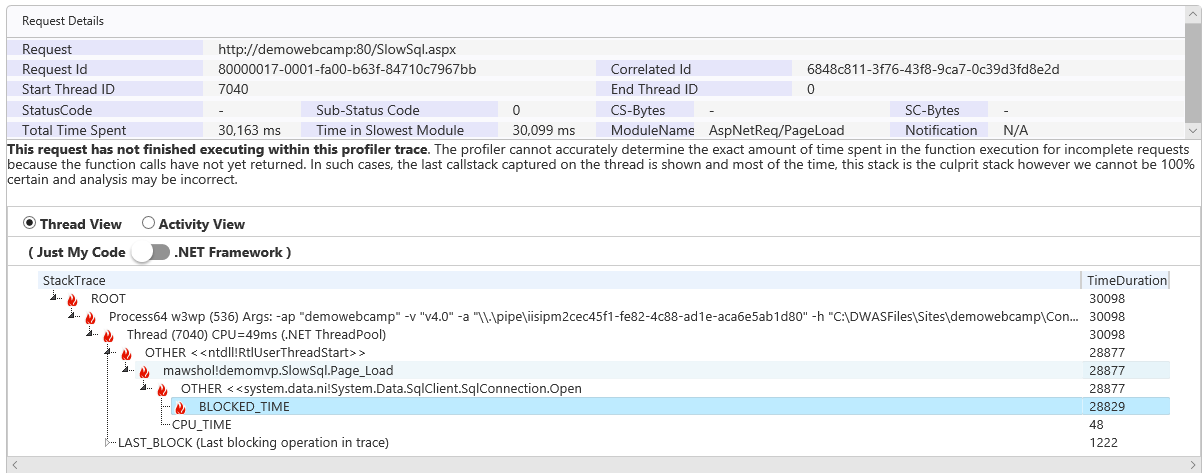 The stack trace helps us identify the delay is happening while trying to open a SqlConnection from a page named SlowSql.aspx and the function name is demomvp.SlowSql.Page_Load. There is also a toggle button for showing the full .NET Framework stack which shows time spent in all the functions that got executed on this thread and at times is helpful if you want to drill down further within the .NET Framework code to identify methods where time is being spent.
Profiler is able to show the stack traces accurately for requests that have completed in the trace. For requests that started in the trace and have not finished before the trace is stopped, the profiler tries its best to show the time taken but it may not be 100% accurate. Incomplete requests would have a warning icon next to the slow request report and it is suggested to look all the complete requests in the trace to get a better picture of request execution.
The stack trace helps us identify the delay is happening while trying to open a SqlConnection from a page named SlowSql.aspx and the function name is demomvp.SlowSql.Page_Load. There is also a toggle button for showing the full .NET Framework stack which shows time spent in all the functions that got executed on this thread and at times is helpful if you want to drill down further within the .NET Framework code to identify methods where time is being spent.
Profiler is able to show the stack traces accurately for requests that have completed in the trace. For requests that started in the trace and have not finished before the trace is stopped, the profiler tries its best to show the time taken but it may not be 100% accurate. Incomplete requests would have a warning icon next to the slow request report and it is suggested to look all the complete requests in the trace to get a better picture of request execution.
 For asynchronous requests, the profiler report shows you the Activity View and the thread view is not shown. Activity view groups method execution by the activity information which is passed by CLR when using Tasks and the profiler groups similar tasks originating with the same Activity Id and stitches them together to show you this view. Here is an example of an asynchronous request's activity view.
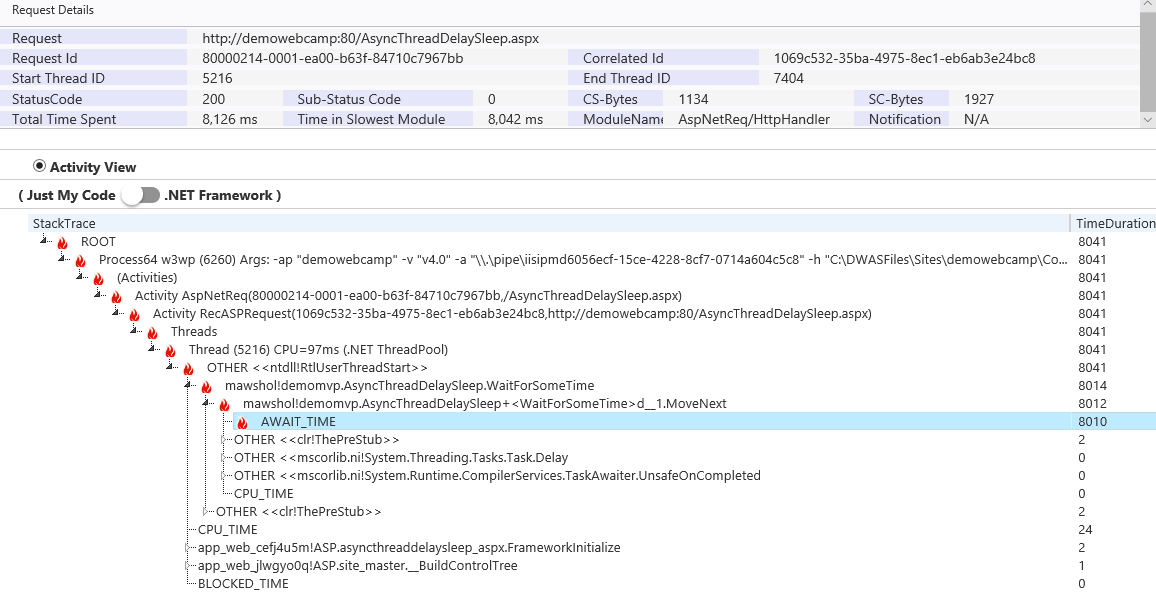 In the above stack trace, we can see that the method demomvp.AsyncThreadDelaySleep.WaitForSomeTime invoked a new Delay Task and spent 8 seconds awaiting on it. As you can see, by the nature of asynchronous execution, understanding ASYNC tasks is slightly more trickier than synchronous threads but still the profiler report has grouped the right functions together by grouping .NET Activity. To know more about .NET Activities and how they are flown, check out this detailed post - https://blogs.msdn.microsoft.com/vancem/2015/09/14/exploring-eventsource-activity-correlation-and-causation-features/
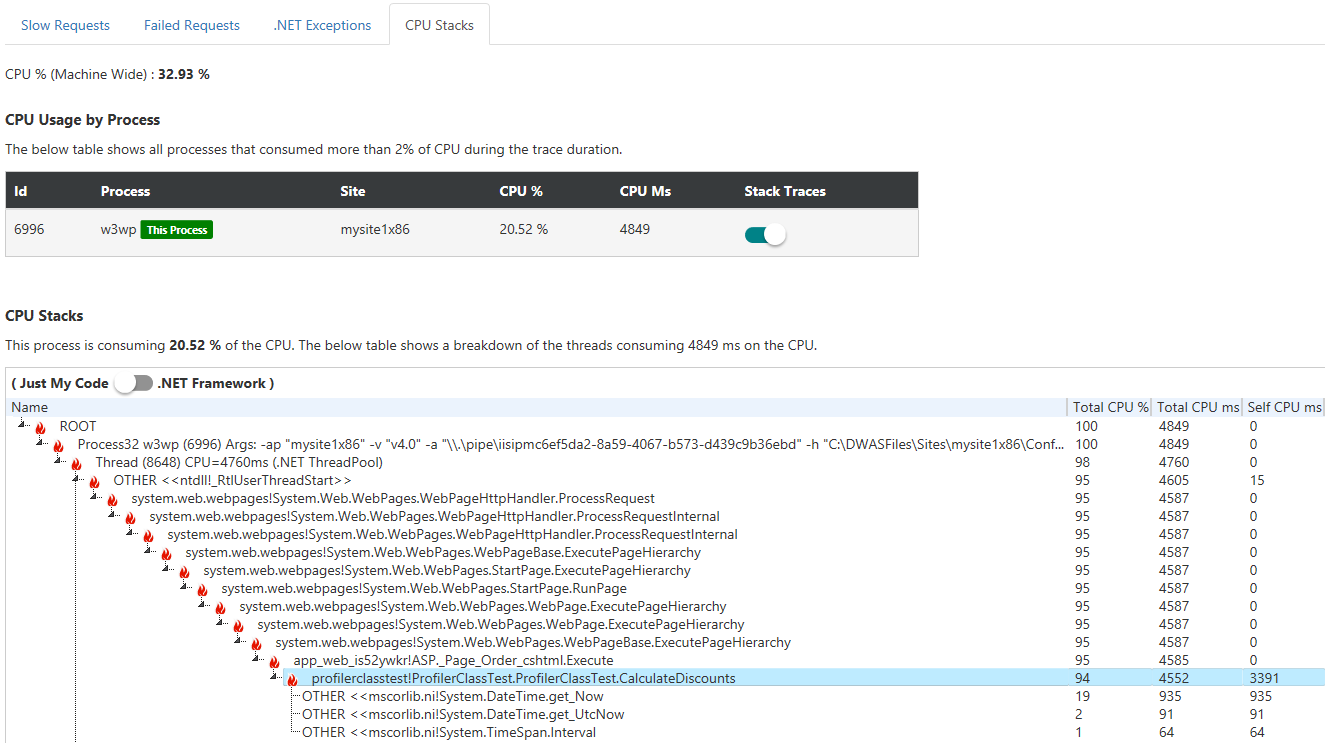 In the above example, we can see that there is a ProfilerClassTest.CalculateDiscounts method is taking 4 seconds on the CPU
Profiler tool helps in collecting an on-demand trace that lets you identify the underlying .NET exceptions, time taken in the various request processing pipeline stages and even lets you drill down into exact methods within the application code that are taking time. It is extremely useful in situations where the problem is happening right now and you want to collect some data to identify the root cause of the issue. Profiling is designed for production scenarios and is based on ETW (Event tracing for Windows) . The analysis component of the profiler uses the TraceEvent library to generate a report that helps you drill down in to the problems in matter of a few minutes. It should be noted that no changes are made to your Web App code or your configuration during the collection or the analysis phase. In fact, the web app is not even restarted as a result of capturing this trace. The captured trace has ETW events emitted by the IIS and the ASP.NET providers along with stack traces captured at the CPU level. You can use this tool to efficiently troubleshoot delays which are relatively small (less than a second too) without impacting the run-time performance of the application. The profiler works for both ASP.NET and ASP.NET core applications.
How to Collect the Trace
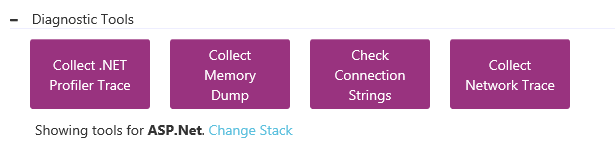
To collect the trace, go to Diagnose and Solve Problems and choose the Collect .NET Profiler Trace option under Diagnostic Tools option and click on Collect Profiler Trace. Unless you have isolated that only a specific instance is failing, it is best to just select all the instances on which your Web App is running.
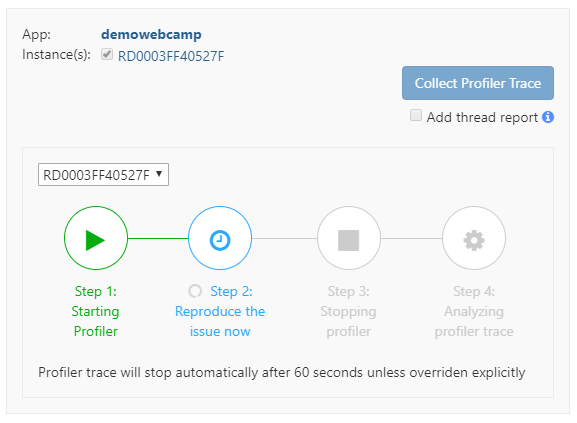
Add thread report option - With this option enabled, a thread report of all the threads in the process is also collected at the end of the profiler trace. This is useful especially if you are troubleshooting totally hung processes, deadlocks or requests taking more than 60 seconds. This will pause your process for a few seconds until the thread dump is generated. This option is NOT recommended if you are experiencing high CPU on the instance because if the instance is under stress, it might take a long time to even start a new process to collect the thread dumps.
Clicking the Collect Profiler Trace will start profiling the Web App and the wizard will show progress of various steps involved.
Once the profiler trace is started, reproduce the issue by browsing the Web App. If you have a Web App running on multiple instances, make sure to browse a few more times to ensure that the requests to the web app get captured in the profiler trace. The default duration for which the profiler trace runs is 60 seconds and during this 60 seconds, all the requests that were made to the Web App get captured in the profiler trace. It is important to note that the profiler trace only has information about the requests that were captured in these 60 seconds (It is possible to increase this duration as mentioned below in this article)
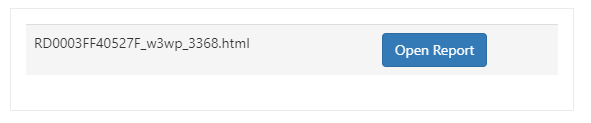
After 60 seconds, the profiler automatically stops, and an analysis component gets triggered that starts analyzing the profiler trace that just got captured. After the analysis finishes, a link to view the profiler report for every instance serving the web app is generated and you click on the Open Report button to view the Analysis report.
Understanding the Analysis Report
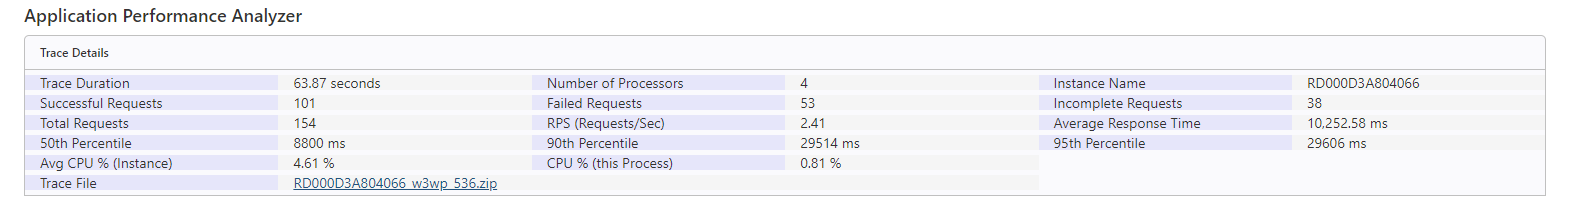
The analysis report provides some basic information about the number of requests captured, successful and failed requests, CPU usage of the instance, CPU usage of the web app and request execution information that helps you identify how fast your Web App was responding when the trace was getting captured. This can be used to validate if the trace is useful and if the right set of requests got captured in the trace and if the cause of slowness is related to high CPU on the instance serving the web app or not. The trace file section also has a link to download the trace file.
For troubleshooting slow or slow or hung web applications, click on Slow Requests tab. This view shows you the top 100 slowest requests that got captured in the trace. It also breaks down the time spent in various modules of request execution in IIS and tries to categorize them in to Platform, Network and Application code to give you a quick indication on where the problem might be.
- Application Code - represents the time spent in handlers or modules that get invoked either while executing application code (for e.g ManagedPipelineHandler) or those that are closely related to any explicit configuration done for the application (for e.g. RewriteModule). Any external or third party handlers, modules fall in this category. Anything which does not fall in the native IIS handlers or modules is classified as Application.
- Network - represents the time spent in reading the request entity body from the client or time spent in flushing the response buffer back to the client. Time spent in waiting on external outbound network calls made from the application (like Database, cache, external HTTP requests etc.) is not counted here and is grouped under Application Code. If requests are spending a lot of time in this category, then it means that there is either a network issue between the client and the web app, the network might be slow or the request and response body is big.
- Platform - represents the time a request spends in core native modules or handlers of IIS which are pre-installed in Azure App Service (for e.g. DefautlDocumentModule, StaticFileHandler etc.). A request spending too much time in these modules might indicate an overall platform issue so you can contact Microsoft Support to get more details.
So the above information tells us that the slowest request in this trace took around 30 seconds and 99.79% of the time was spent in the the Page_Load event of ASP.NET which tells us that something in the Page_Load caused the request to slow down hence narrowing the issue down to Application Code.
The Profiler tries its best to correlate the stack trace of thread to the slow requests and if it manages to find this information, a light bulb icon is displayed next to the Details view to illustrate that there are stack traces captured for this request. You can click on the Details button to get the stack trace captured.
Stack Traces - Thread View
For a request, the Thread View is shown for requests where the profiler is able to determine that the request execution happened on the same thread and where the delay in request processing happened on the same very thread. It is however possible that the thread view is shown even for ASYNC requests if the .NET Task Scheduler decides to run them on the same thread. It is best advised to look at both the Thread View and Activity view for requests that executed on the same thread to get an idea of methods taking the longest time because at times one view may have more accurate information than the other and might help you go one more step closer to the code that is introducing the delay.
The stack trace helps us identify the delay is happening while trying to open a SqlConnection from a page named SlowSql.aspx and the function name is demomvp.SlowSql.Page_Load. There is also a toggle button for showing the full .NET Framework stack which shows time spent in all the functions that got executed on this thread and at times is helpful if you want to drill down further within the .NET Framework code to identify methods where time is being spent.
Profiler is able to show the stack traces accurately for requests that have completed in the trace. For requests that started in the trace and have not finished before the trace is stopped, the profiler tries its best to show the time taken but it may not be 100% accurate. Incomplete requests would have a warning icon next to the slow request report and it is suggested to look all the complete requests in the trace to get a better picture of request execution.
Stack Traces - Activity View
If the request has switched multiple threads, you will notice an icon next to the list of requests in the slow request report indicating the request is an async request.
For asynchronous requests, the profiler report shows you the Activity View and the thread view is not shown. Activity view groups method execution by the activity information which is passed by CLR when using Tasks and the profiler groups similar tasks originating with the same Activity Id and stitches them together to show you this view. Here is an example of an asynchronous request's activity view.
In the above stack trace, we can see that the method demomvp.AsyncThreadDelaySleep.WaitForSomeTime invoked a new Delay Task and spent 8 seconds awaiting on it. As you can see, by the nature of asynchronous execution, understanding ASYNC tasks is slightly more trickier than synchronous threads but still the profiler report has grouped the right functions together by grouping .NET Activity. To know more about .NET Activities and how they are flown, check out this detailed post - https://blogs.msdn.microsoft.com/vancem/2015/09/14/exploring-eventsource-activity-correlation-and-causation-features/
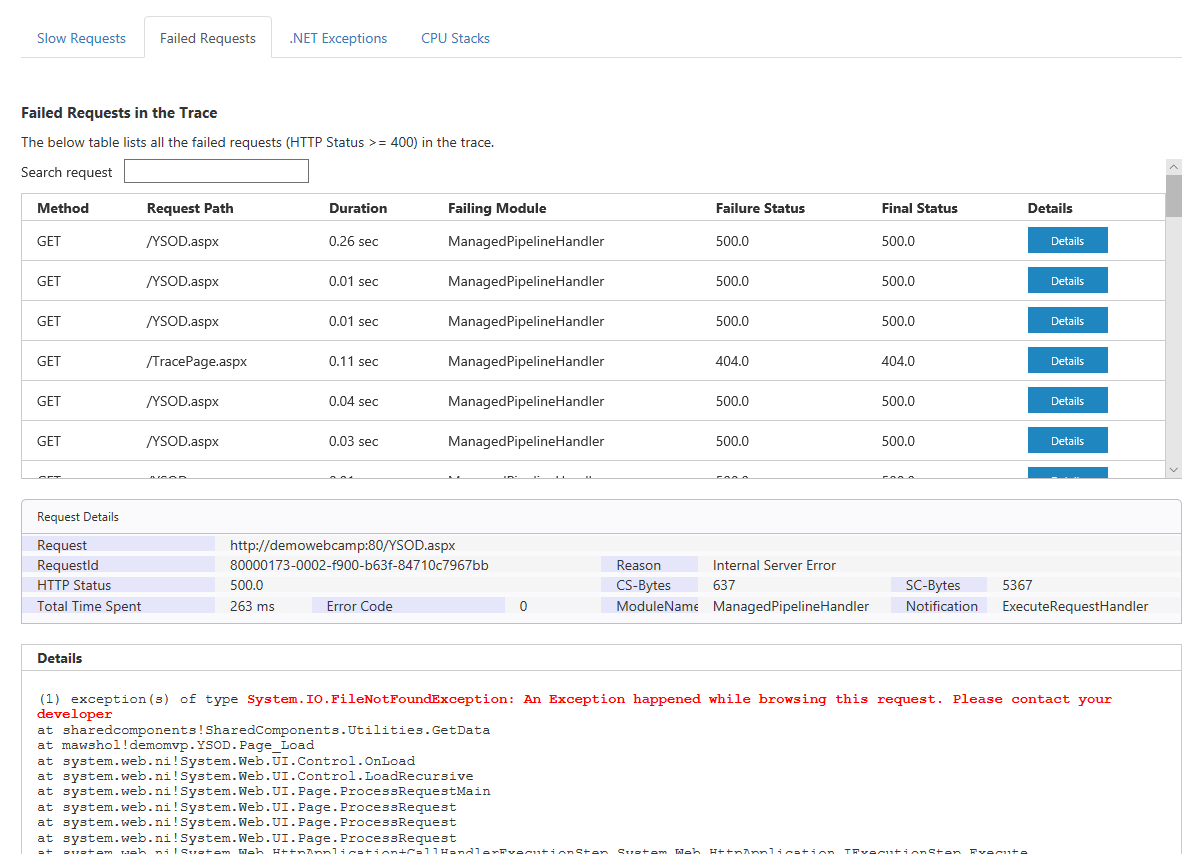
Failed Requests
For requests, that failed with a HTTP error, the Failed Requests view highlights the HTTP Module or the handler that was responsible for setting the error status code. Clicking on Details will show more information about the failure and will highlight the underlying exception for the request. The profiler tries its best to correlate a request with an exception, however if a request has switched multiple threads (either due to multiple tasks or due to different threading primitives), then the profiler may not be able to correlate the exception with the request.
.NET Exceptions View
This view shows all .NET exceptions that happened in the process during the trace. The difference in this view vs. the Failed Requests view is that this can include all the exceptions that might have happened on background threads , IO threads or on threads that could not be associated to a request directly.CPU Stacks
If the process traced also consumed high CPU, then the profiler report would also show you the call-stack of the thread that consumed the maximum CPU and this should help in identifying the function that need to be optimized.
In the above example, we can see that there is a ProfilerClassTest.CalculateDiscounts method is taking 4 seconds on the CPU