Introducing the New App Service Support Center (Preview)
Jennifer Lee (MSFT)
(Note: in this blog post, images will be expanded when clicked).

 Here is a quick overview of the different Additional Resources categories:
 Note: currently, this experience is only for App Service on Windows. Stay tuned!
“What’s wrong with my Web App? My Web App is down!”
These are tough questions that we know are frustrating for you. It is our priority to make sure that we figure out how to keep your Web App healthy with minimal downtime. However, in the cases where things do go wrong, the problem is that there could be many reasons why.How do you know which of these generic potential issues could be the reason why your Web App is down?
Where do you start your troubleshooting process for your specific Web App?
Many of you may be familiar with the Diagnose and Solve Support Center, our self-serve diagnostic experience that allows you to get a glimpse of how your Web App is performing. Since releasing that experience, we’ve been able to add and improve the detectors that we use to analyze the health of your Web App to perform more precise pattern analyses in an effort to pinpoint Web App errors and provide troubleshooting advice. As a result, today we are excited to announce the release of our new Diagnose and Solve Support Center (Preview) to help point out what’s wrong with your Web App and guide you to the right information to troubleshoot and ideally resolve the issue easier and quicker than before.Getting Started with the New App Service Support Center
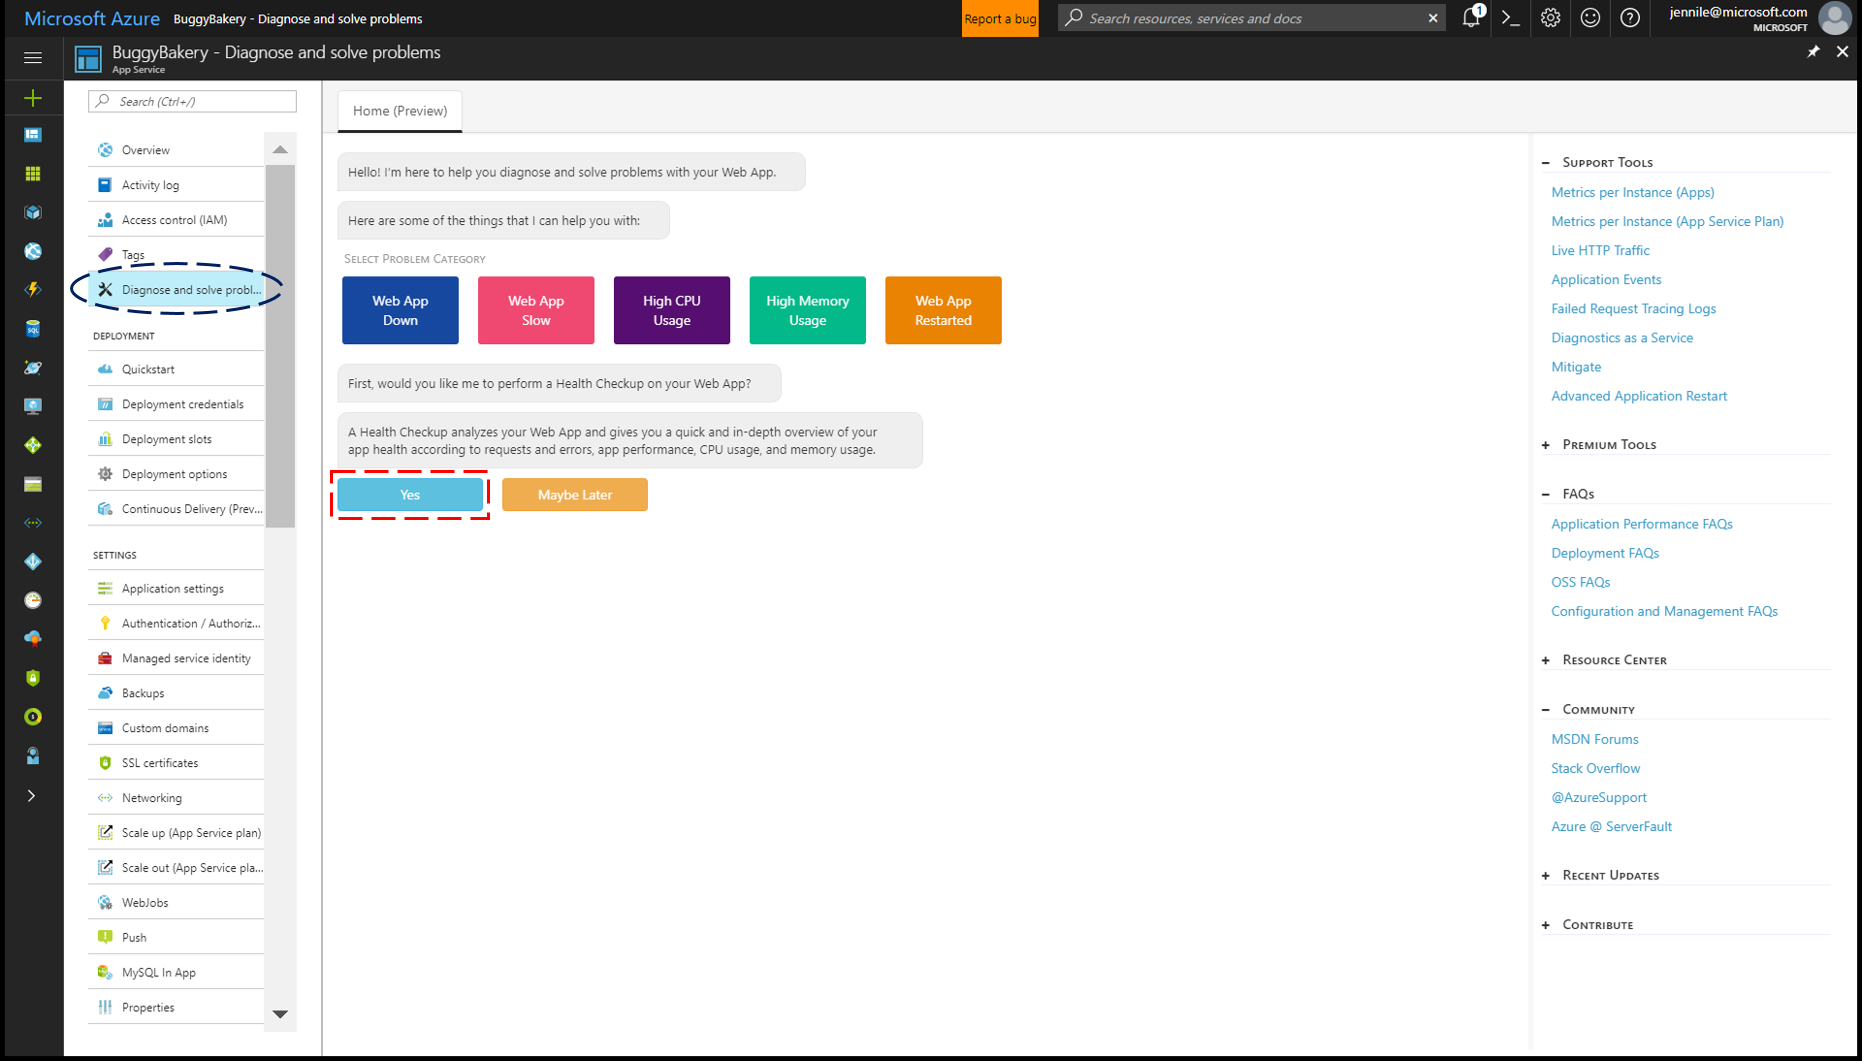
To open the new App Service Support Center, click on “Diagnose and Solve problems” on the left-hand menu. Once in the new App Service Support Center homepage, there are several options.First, you should ask yourself this question: Do you already know what’s wrong with your Web App?
Performing a Health Checkup (Highly Recommended)
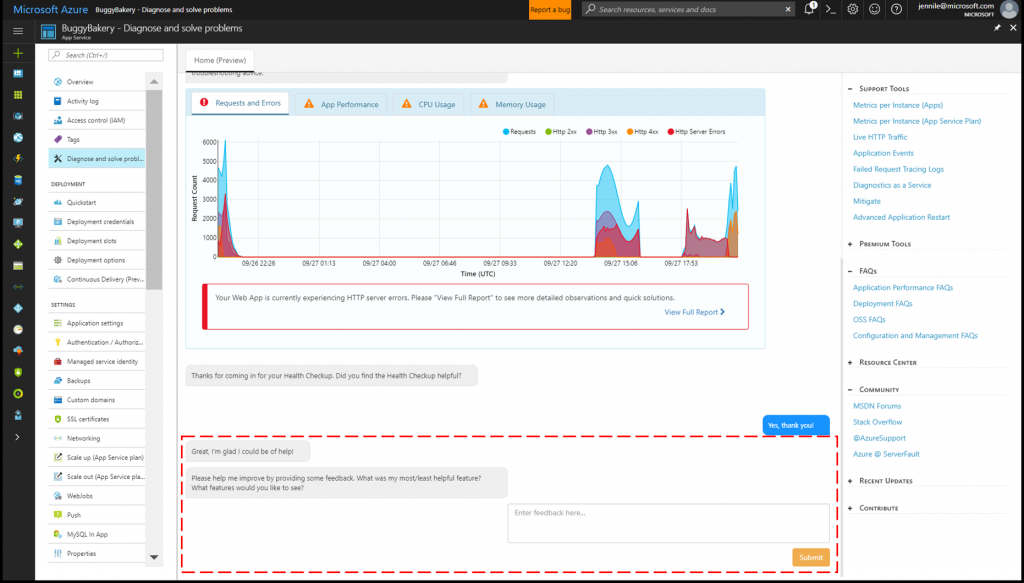
If you’re not sure what’s wrong with your Web App, run our new Health Checkup feature by selecting the blue “Yes” button. Health Checkup will analyze your Web App to give you a quick, interactive overview that points out what’s healthy and what’s wrong, telling you where to look to investigate the issue. Once the Health Checkup report is generated, you can get a quick overview of the status of four different problem categories: Requests and Errors, Performance, CPU Usage, Memory Usage. [video width="1912" height="1092" mp4="media/2017/09/2017-09-29_11h03_03-online-video-cutter.com_.mp4" poster="media/2017/09/App-Service-Genie-Blog-Post-2.png" loop="true" autoplay="true"][/video] Highlights:- Quick Overview: red, orange, and green icons appear on the left side of each problem category to indicate the healthiness of that area. You can click on each tab to open up a graph showing more details.
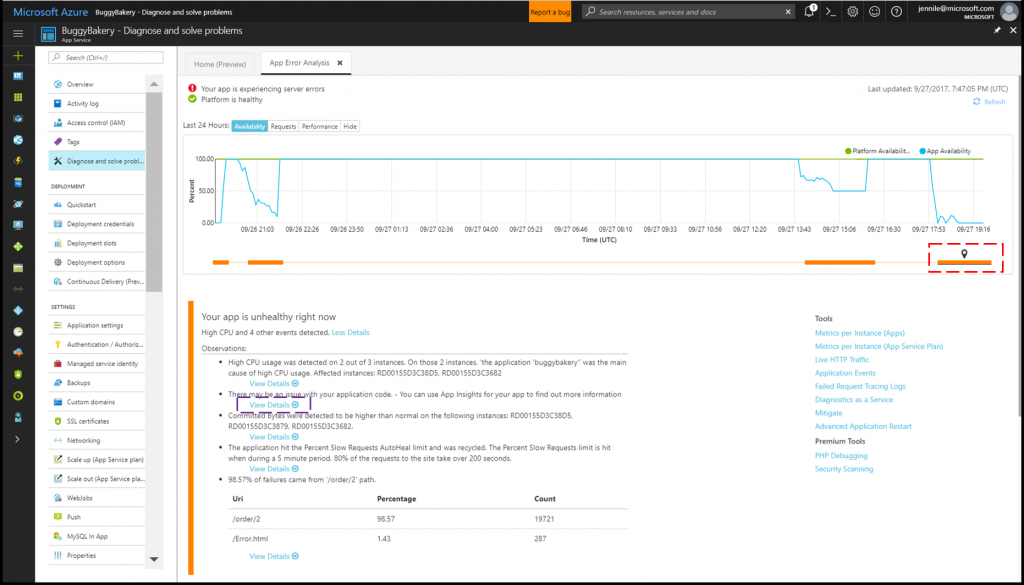
- View Full Report: this opens up more observations about the issue and suggested solutions as seen in the image below. You can investigate further by selecting the orange bars corresponding with periods of unhealthiness and expanding on observations by clicking "View Details" below. Suggested solutions would show up below the observations.

Selecting Tile Shortcuts
If you already know what’s wrong with your Web App, you can investigate further by selecting the tile shortcut that corresponds to the problem category that you’re interested in. Currently, we have five problem scenarios for our tile shortcuts. (Note: Web App Restarted is the only scenario not covered by Health Checkup at the moment):- Web App Down
- Web App Slow
- High CPU Usage
- High Memory Usage
- Web App Restarted
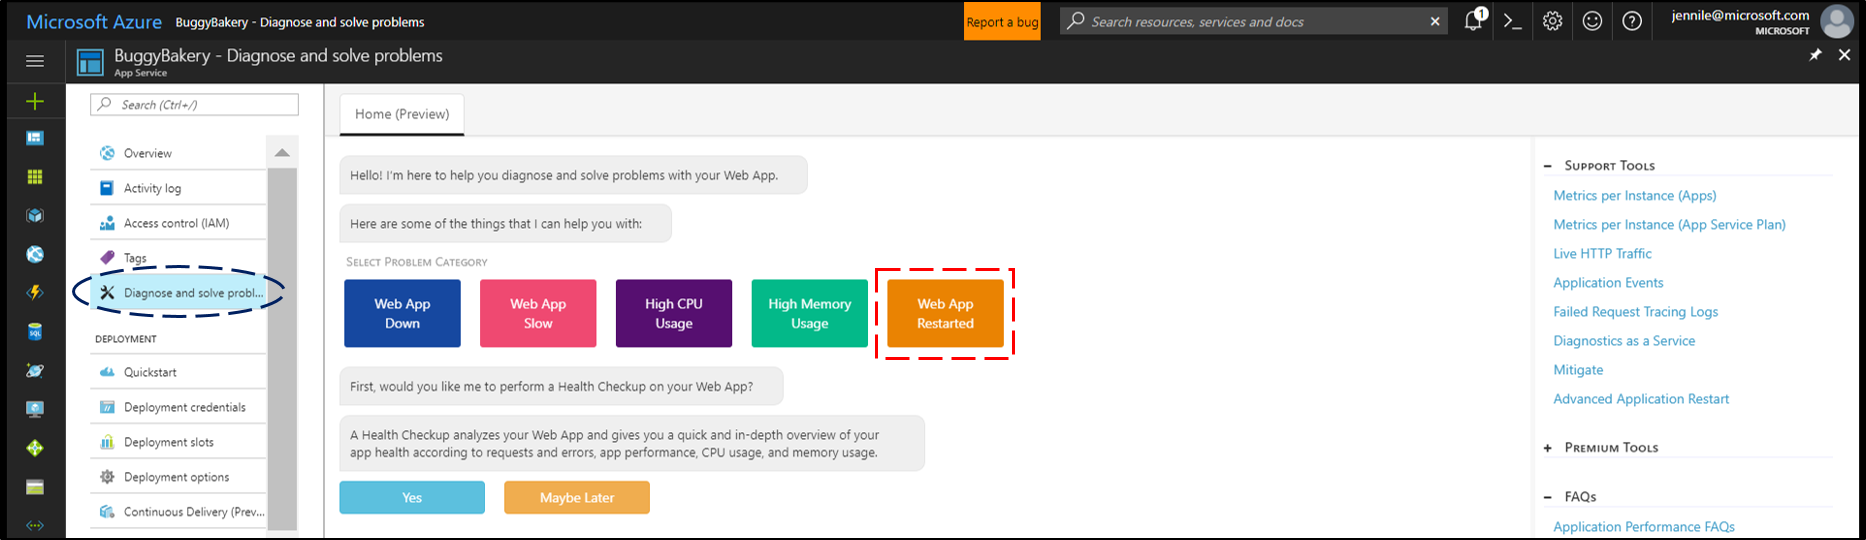
One-Stop Shop for Additional Resources
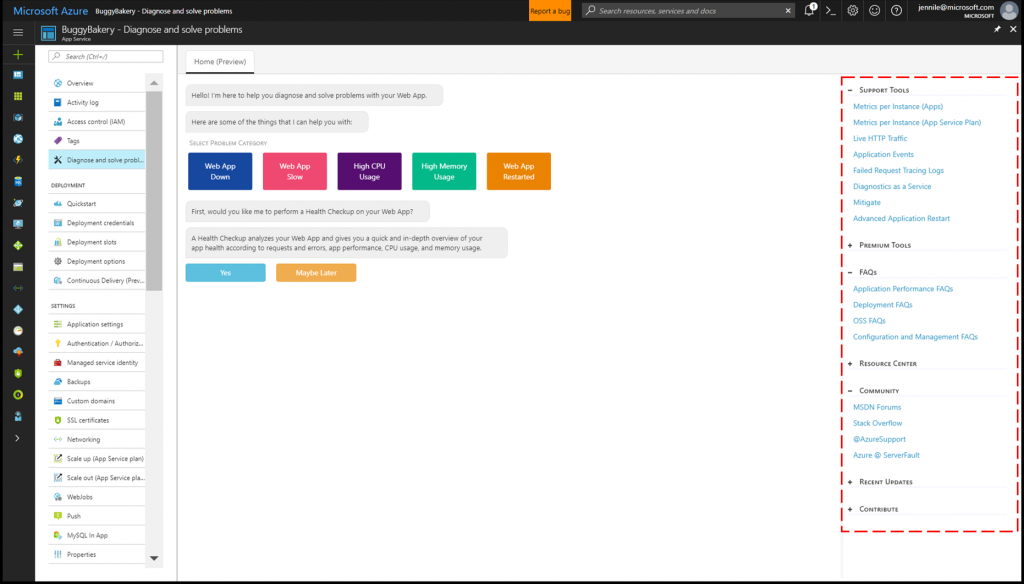
Now, on the right-hand column, we have compiled a list of help links to give you all easy access to variety of different resources with content that can help you troubleshoot your Web App. Just select the + sign next to each title to expand that selection. Here is a quick overview of the different Additional Resources categories:
- Support Tools: additional troubleshooting tools
- Premium Tools: more additional troubleshooting tools
- FAQs: links to App Service articles that guide you through common troubleshooting scenarios
- Resource Center: links to how-to articles and video walkthroughs for those needing a quick-start for App Service
- Community: links to forums and other locations where you can get help from members of the App Service team and other community members
- Recent Updates: convenient links to updates to Microsoft Azure services as well as stack specific updates
- Contribute: link to our Github repository to assemble feedback for Support Center and allow for open source contributions
We need your feedback!
In the coming months, we are planning on adding additional features with a goal that Support Center can guide you step-by-step for a holistic Web App troubleshooting experience. This means that the feedback that you leave is critical for us to determine which features are most relevant for you. Once Health Checkup is complete, you can leave your feedback in the inline textbox as seen below. Note: currently, this experience is only for App Service on Windows. Stay tuned!