Application Insights integration with Functions now in preview
Chris Anderson (Azure)
Azure Functions support for Application Insights has moved out of limited beta and into a wider public preview. We’ve also added support to add Application Insights on create, as well as, a direct link from Azure Functions’ portal to the Application Insights blade. We’ve also added additional settings to help control what data get sent and how much to send, helping you to control the volume of data that is sent.
 If you want to use add an existing Application Insights resource or you have an existing Azure Function App, you can add Application Insights by adding an App Setting with your instrumentation key.
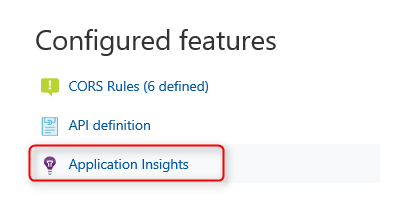
 Once you’ve done this, you can navigate to your Application Insights resource from the “Configured Features” page of your Function App.
Getting Started
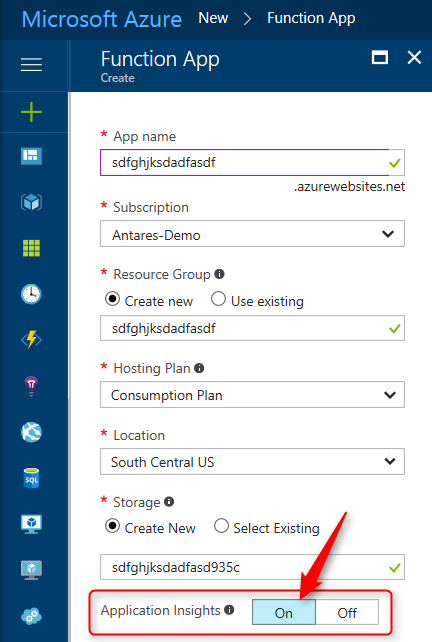
To get started with Azure Functions and Azure Application Insights, you can create a new Function App and set the Application Insights toggle to “On”, which will create an Application Insights resource for you, automatically.
If you want to use add an existing Application Insights resource or you have an existing Azure Function App, you can add Application Insights by adding an App Setting with your instrumentation key.
- Create an Application Insights instance.
- Application type should be set to General
- Grab the instrumentation key
- Update your Function App’s settings
- Add App Setting – APPINSIGHTS_INSTRUMENTATIONKEY = {Instrumentation Key}
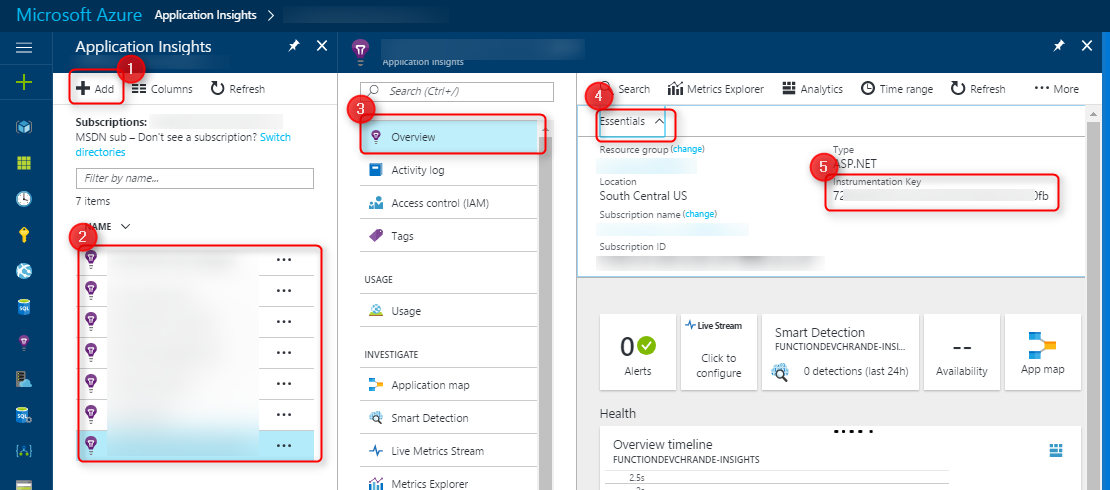 Once you’ve done this, you can navigate to your Application Insights resource from the “Configured Features” page of your Function App.
Using Application Insights
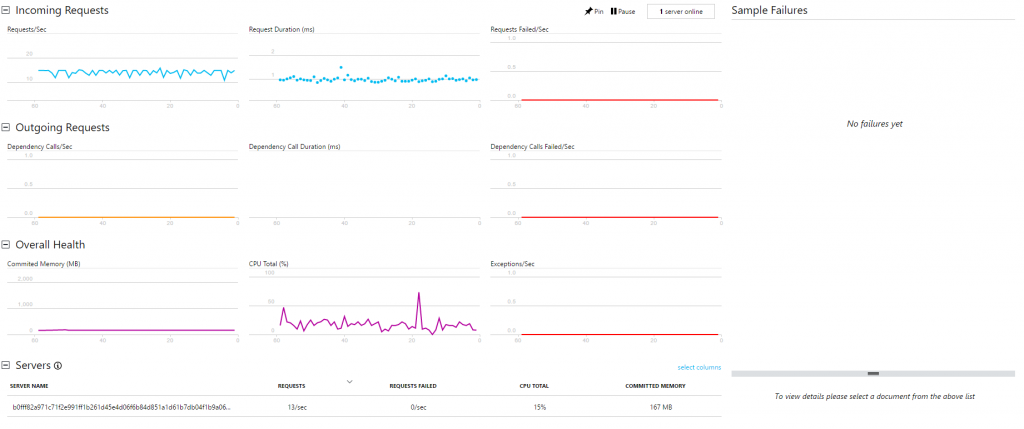
Live Stream
If you open your Application Insights resource in the portal, you should see the option for “Live Metrics Stream” in the menu. Click on it and you’ll see a near-live view of what’s coming from your Function App. For executions, it has info on #/second, average duration, and failures/second. It also has information on resource consumption. You can pivot all of these by the “instance” your functions are on; providing you insight on whether a specific instance might be having an issue or all of your Functions. Known issues: there are no dependencies being tracked right now, so the middle section is mostly useless for now. If you send your own custom dependencies, it’s not likely to show up here since they won’t be going through the Live Stream API since you’re normally using a different client, today.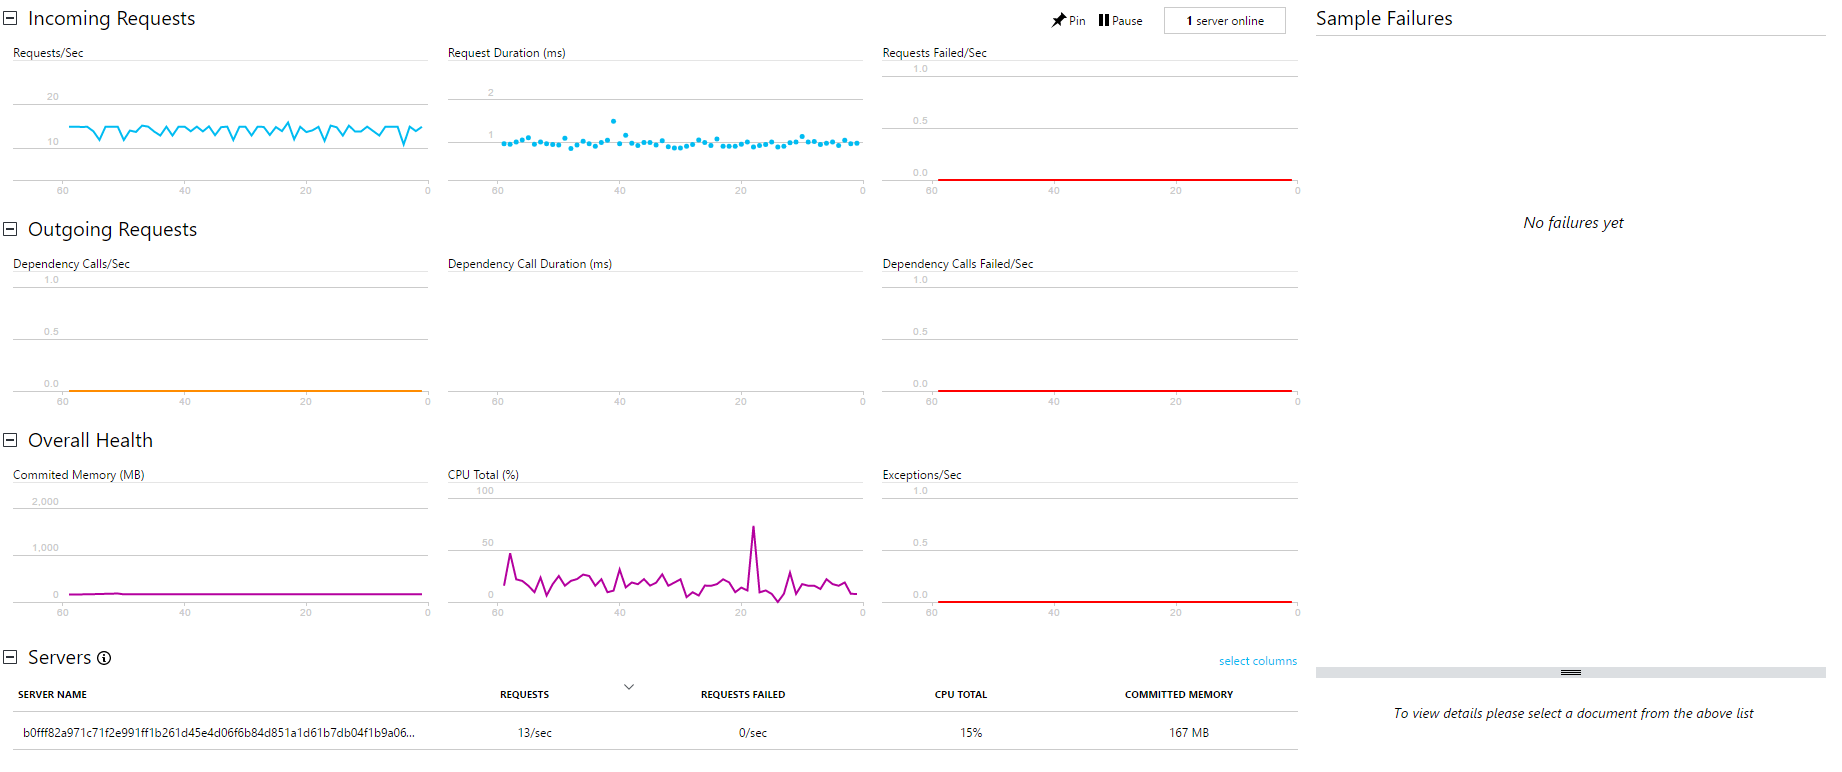
Metrics Explorer
This view gives you insights on your metrics coming from your Function App. You can add new charts for your Dashboards and set up new Alert rules from this page.Failures
This view gives you insights on which things are failing. It has pivots on “Operation” which are your Functions, Dependencies, and exception messages. Known issues: Dependencies will be blank unless you add custom dependency metrics.Performance
Shows information on the count, latency, and more of Function executions. You can customize this pretty aggressively to make it more useful.Servers
Shows resource utilization and throughput per server. Useful for debugging Functions that might be bogging down your underlying resources. Putting the servers back in Serverless. JAnalytics
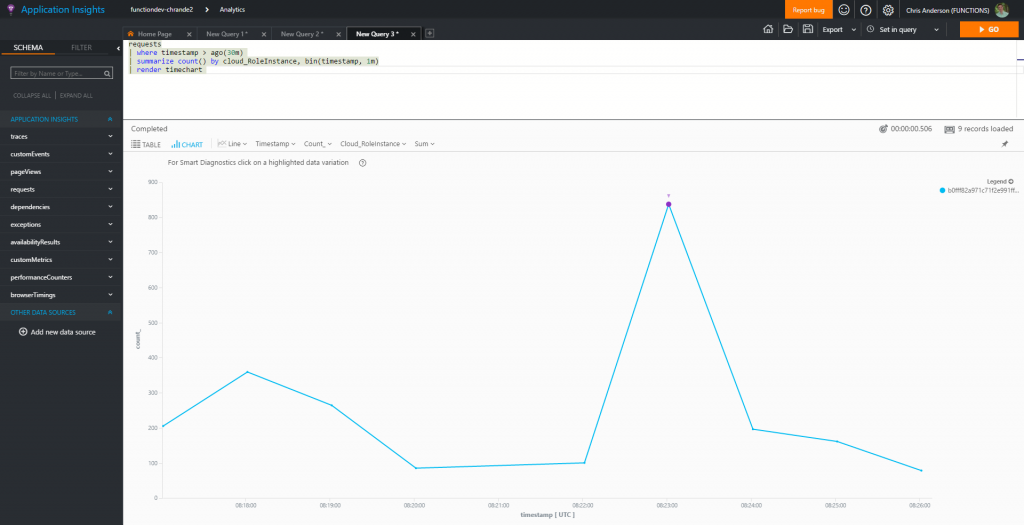
The analytics portal provides you the ability to write custom queries against your data. This is one of the most powerful tools in your tool box. Currently, the following tables are full of data from the Functions runtime:- Requests – one of these is logged for each execution
- Exceptions – tracks any exceptions thrown by the runtime
- Traces – any traces written to context.log or ILogger show up here
- PerformanceMetrics – Auto collected info about the performance of the servers the functions are running on
- CustomEvents – Custom events from your functions and anything that the host sees that may or may not be tied to a specific request
- CustomMetrics – Custom metrics from your functions and general performance and throughput info on your Functions. This is very helpful for high throughput scenarios where you might not capture every request message to save costs, but you still want a full picture of your throughput/etc. as the host will attempt to aggregate these client side, before sending to Application Insights
