General availability of Diagnostics tools for App Service on Linux Node.js apps
We are pleased to announce the public availability of Diagnostic tools for App Services Linux for Node.js apps. With this capability, we now offer built-in support for collecting deep diagnostic artifacts that can help you debug application code issues. These artifacts include memory dumps and profiler traces. These tools empower developers to diagnose a variety of Node.js code scenarios on Linux including:
- High memory
- High CPU
The experience uses V8 sample-based profiler to collect diagnostic traces/snapshots to identify if application code is contributing to the problem.
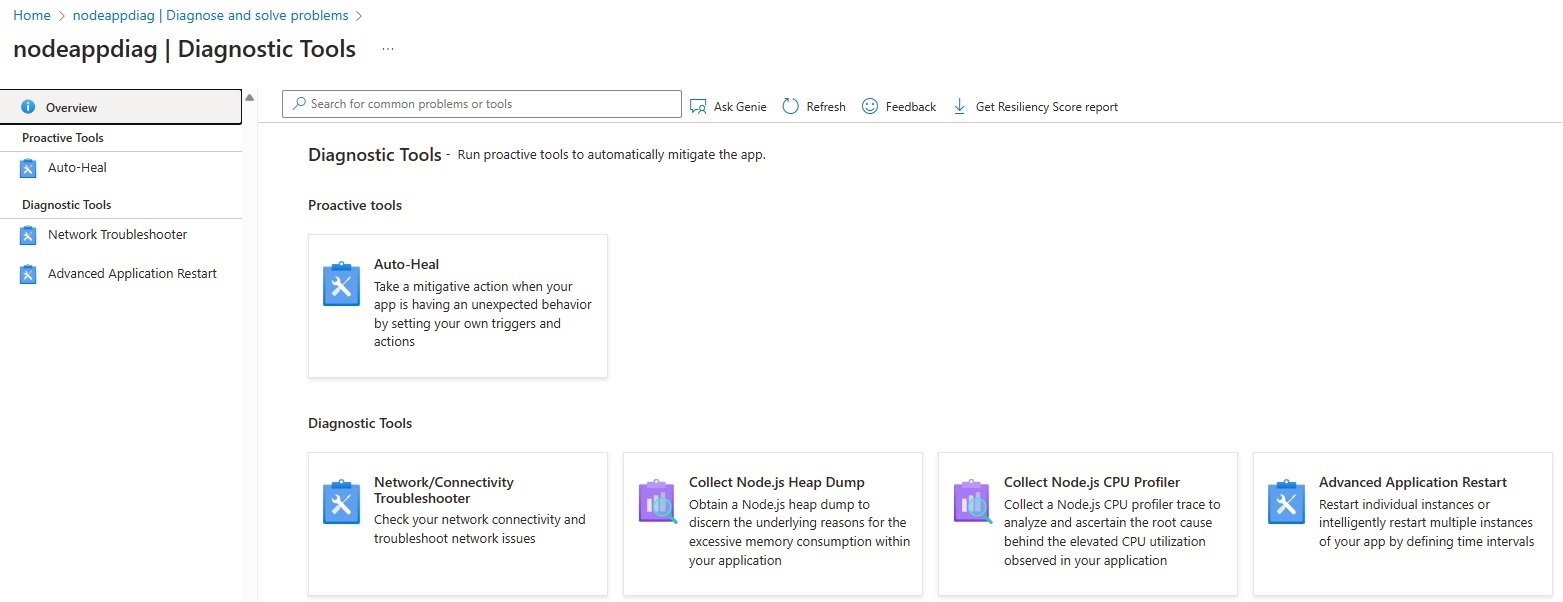
Collection in Diagnose and Solve
To access these new capabilities on your .NET Core apps hosted in Linux, navigate to the Diagnose and Solve Blade > Diagnostics Tools and select either Collect Node Heap Dump or Collect Node CPU Profiler.
Collection in Kudu
The Kudu console for Linux app services has been updated to include new collection options for memory dumps and profiles on the Process Explorer page.
To navigate to this new Kudu experience use the following (update <mysite> with your app name): https://<mysite>.scm.azurewebsites.net/newui to check out the new experience.
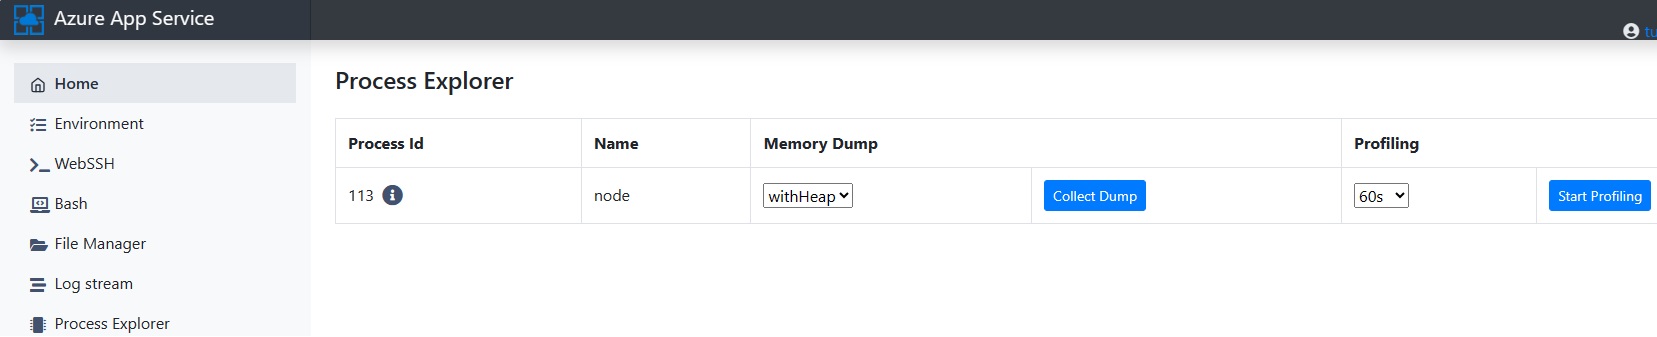
When you select the Process Explorer page, you can identify the process you want to debug. Use the drop-downs to select the type of memory dump and click Collect Dump. Alternatively, you can select the length of a profile from the drop-down and click Start Profiling.
Analyzing a heapsnapshot for Memory Issues
Heap dumps are created using the extension *.heapsnapshot. Once the dump has been created, you will get a link to download it on your local machine. You can analyze the dump using any Chromium browser.
Since Chrome and Edge use the same Javascript runtime (V8 engine), heap snapshots can be read using Chrome or Edge DevTools for Node.
Chrome: Navigate in Chrome Browser and type chrome://inspect/, then click on Open dedicated DevTools for Node
Edge: Navigate in Chrome Browser and type edge://inspect/, then click on Open dedicated DevTools for Node
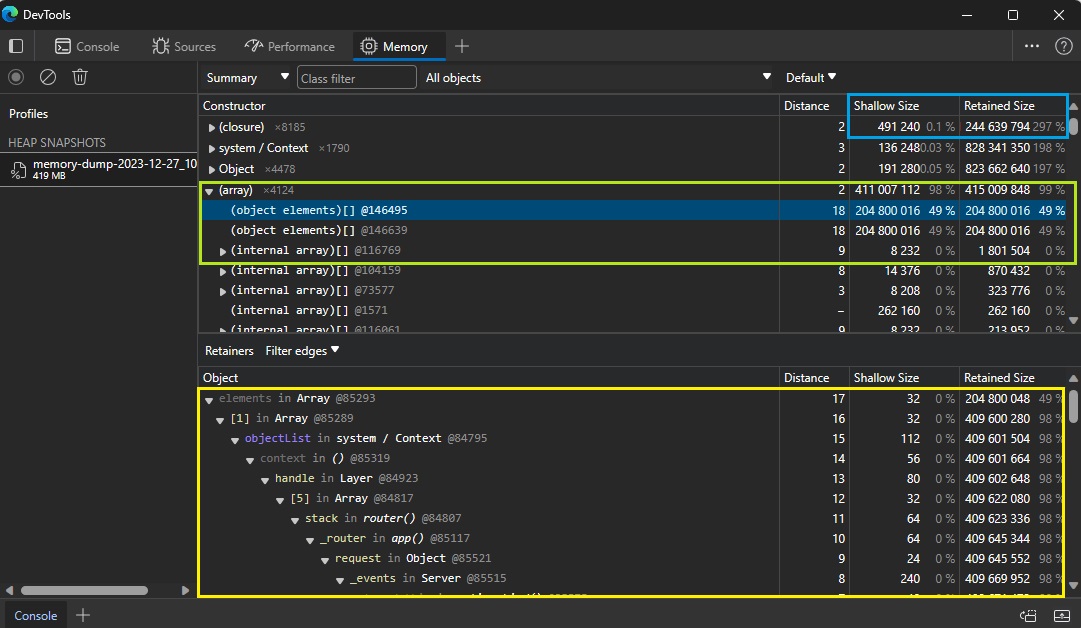
You can chose the Memory tab and load a Heap Snapshot here for analysis. You will find several columns, the most important ones are Shallow Size and Retained Size.
Shallow Size: This is the size of memory that is held by the object itself. Usually, only arrays and strings can have a significant shallow size.
Retained Size: This is the size of memory that is freed once the object itself is deleted due it becoming unreachable from GC roots. Held by object implicitly.
You will be looking for the highest percentage in Retained Size comparing as well with Shallow Size.
More information on how to analyze heapsnapshot dumps in Chromium browsers can be found here - Chrome - Devtools - Heapsnapshot - Reference.
Analyzing a cpuprofile for High CPU Issues
Profiler traces are created using the extension *.cpuprofile. Once the trace has been created, you will get a link to download it on your local machine. You can analyze the trace using any Chromium browser.
Chrome: Navigate in Chrome Browser and type chrome://inspect/, then click on Open dedicated DevTools for Node
Edge: Navigate in Chrome Browser and type edge://inspect/, then click on Open dedicated DevTools for Node
Chose the Performance tab and you can drag and drop your trace here.
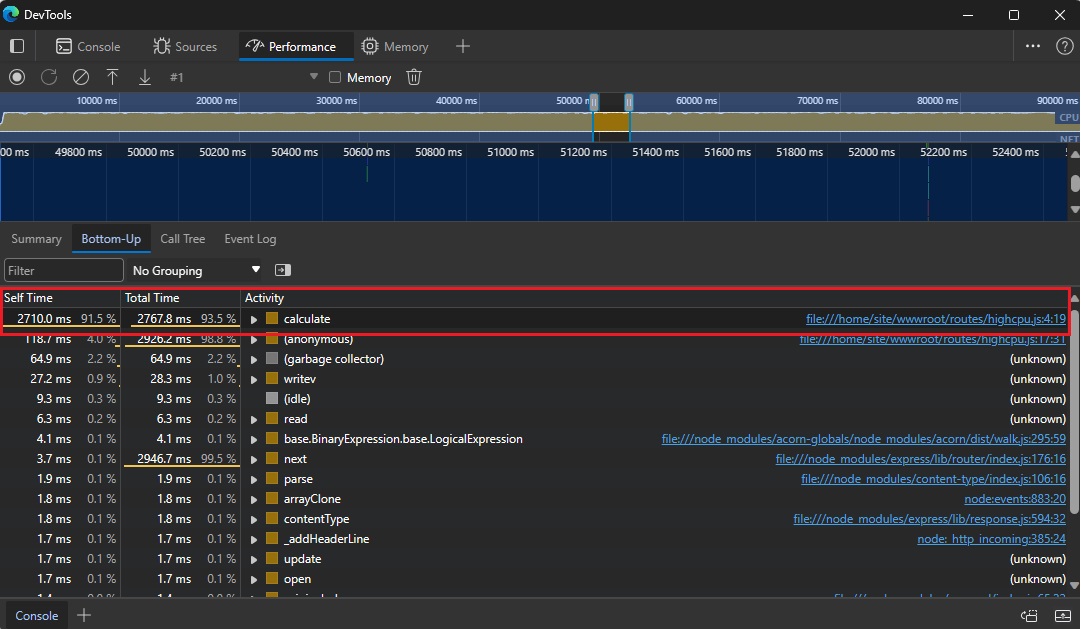
You can use different views like Call Tree or Bottom-Up. You can also zoom into any of the frames to get more detailed information.
Conclusion
Summing up, within Azure App Service, we’re dedicated to consistently enhancing the in-built diagnostic experience, providing an extensive array of tools that empower you to meticulously analyze and troubleshoot the health of your production applications.