Azure Workbook to help run App Service Plans and App Service Environments
Anyone running App Service Plan, or App Service Environment at scale should consider if they are running it efficiently. An App Service Plan is so easy to use that we often throw more and more applications at one, without stopping to think about the impact that might have.
Different App Service Plan SKUs have different limits. Running an app that consumes 1GB of ram on one SKU could be a concern, but maybe not on another.
What about CPU? If you have 16 v-cores then it might not be important to run a CPU intensive app. But run that same app on an App Service plan with fewer cores and you could start to impact other applications on the same plan.
Even IO heavy applications that use little RAM and CPU can have impacts. Different App Service Plan SKUs have different amounts of outbound sockets available to them. Every time you make an outbound call you may consume these ports. An app that doesn’t have a connection pool and makes lots of tiny outbound calls could cause another well-behaved app to start throwing errors. There are also specific limits on outbound connections to Public IP addresses that consume SNAT ports. This information isn’t exposed via metrics though.
All of these are members of a phenomenon known as Noisy Neighbour Syndrome. They look obvious but it’s not always easy to work out which app is misbehaving.
That’s individual applications - there are also constraint limits on the platform. An App Service Plan can have a maximum of 100 instances attached to it. If it’s in an App Service Environment then you’ve got a maximum of 200 instances that can spread across plans. When you’re running at scale it’s easy to start to come close to these limits. But it’s not easy to see how many instances are used across all an App Service Environment.
App Services can also have varying amounts of Hybrid connections. Knowing how many are currently in use against an ASP can help you decide which ASP to place new Apps in that use Hybrid Connections.
Monitor your metrics with Azure Workbooks
All this data is available in various forms, but it’s not been brought together to make it simple to consume. Azure Metrics can capture CPU / RAM / SNAT ports. The resource graph can tell you the SKU of your ASP’s, how many instances are attached to them, and which ASE they belong to.
To make it easy to consume we can build an Azure Workbook to surface all this information. Workbooks are awesome – they allow us to build a dashboard which can pull data from a multitude of sources in Azure and present it in a simple clean interface.
I’ve built a workbook to present a “single pane of glass” that can give you visibility into your ASE’s and ASP’s. Having insights into the limits will hopefully make it easier for you to run ASP and ASE at scale.
Deploy the sample Workbook
To try it out clone the repository from Github: App Service Azure Workbook.
And then from a CLI run the following. Be sure to replace the placeholder with your resource group name.
az deployment group create --resource-group <rg> --template-file .\infra\deploy.bicep
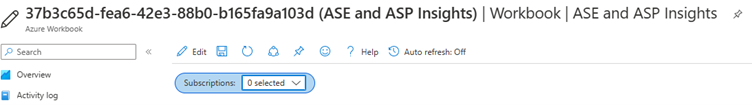
You can then access the workbook from the Resource Group you deployed to in the Azure Portal.
You’ll need to select some subscriptions from the Subscription parameter box to get going:
Once you’ve done that the Workbook will load some summary data for all the ASP’s in the subscription:
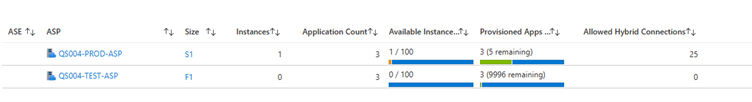
This will show you how many instances / how many apps are associated with the ASP, the tiering, and how many Hybrid Connections are available in total for the ASP.
Selecting one of the rows will populate more insights into the ASP:
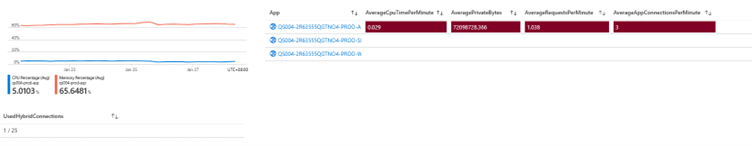
You’ll see the overall CPU / Memory Percentage used across the ASP, along with the total Hybrid Connections active on it.
To the right is a summary of all the Apps in the ASP, and the average CPU / Private Bytes / Requests Per Minute, and App Connections being made by them.
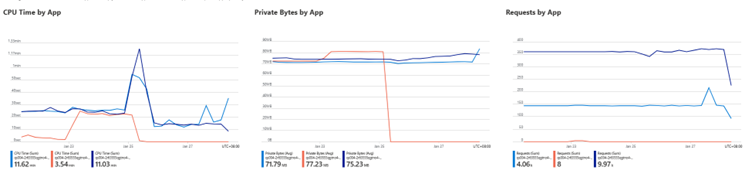
The final element is a set of charts showing some metrics against each app in the ASP. CPU / Private Bytes. It’s similar data as shown above, but represented visually to allow you to spot anything unusual.
Hopefully these insights allow you to ‘right-size’ your App Service Plans and Environments, making them more efficient, more scalable, and more cost effective to run.