Improving the dump analysis journey in Diagnose and Solve
We are happy to announce that our most recent improvements to Diagnose and Solve Problems allow you to begin the analysis on a collected memory dump immediately in the Azure portal!
For problems that do not manifest in logs or that you cannot investigate by debugging locally, you might attempt to capture a diagnostics artifact, like a memory dump, while the issue is active in your production environment. Diagnostics tools found under Diagnose and Solve Problems have enabled you to capture artifacts like memory dumps on demand or by using Custom Auto Heal for both Linux and Windows.
However, capturing the right memory dump at the right time is only half the battle, you also have to have the right tools and experience to interpret the memory dump. Thankfully Diagnostics Analysis can be configured to run immediately following the capture of a memory dump. The analysis report will provide a summary of the most pertinent information in the memory dump, and will also highlight several important data points and even potential red flags that might require a code fix.
Analysis Report: The dump summary
The first step in the analysis is confirming the fundamentals. In the following image, you can see the summary presented by the analysis report, highlighting common helpful information like the process name, process architecture, or how long the process has been running. It also includes information on the platform version as well as the reason for the collection.
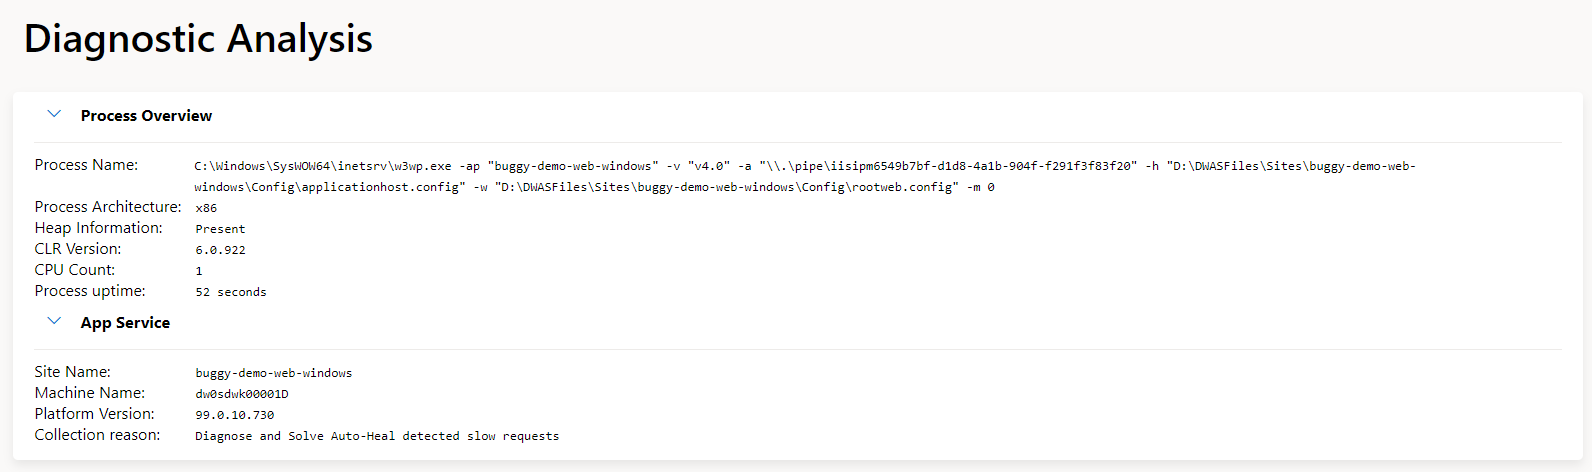
In future versions of the report, we will also support opening the memory dump in Visual Studio with one click (will require the appropriate permissions to the Azure storage location).
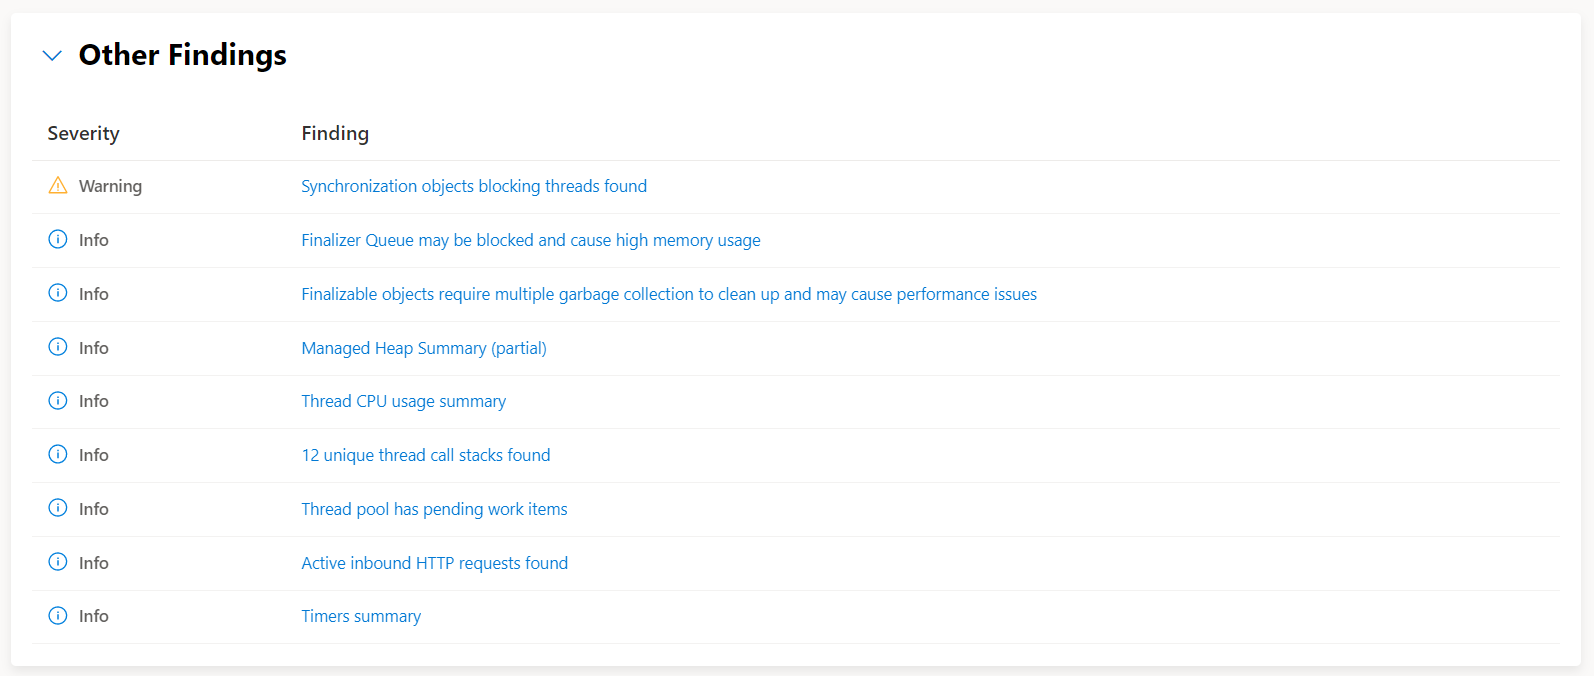
Analysis Report: Dump analyzers
In addition to this initial summary you also have the results of the analyzers that were run against the dump, today these include:
- Thread pool analysis
- Sync over async anti-pattern detection
- Deadlock detection
- Exception on the heap
- Managed heap summary
- Large + pinned objects on the heap
- SQL connections analysis
- Inbound HTTP request
- Outbound HTTP requests
- Socket connections
- Unique call stacks
- Symbol detection
- Source Link detection
- Synchronization objects that are blocking threads
Analysis Report: Advanced call stacks
One of the most important diagnostics artifacts for production debugging is the call stack. During a typical dump debugging session, reviewing the list of threads and the associated call stacks is a great way to understand what was happening at the moment the dump was captured.
Given the importance of the call stack, the Diagnostics Analysis report provides an improved in-browser experience for call stack analysis. The advanced call stacks are explicitly designed to accurately reflect the call stack names and layout you have become accustomed to in Visual Studio.
You can initiate the advanced call stack view by clicking on any of the stack frame hyperlinks. It then also allows you to filter larger call stacks using method or namespace names, as well as quickly switch between viewing Just My Code and the entire framework call stack.
Getting to source code with Source Link
For many scenarios, the call stack provides enough clues to the source of the problem, however, by taking advantage of Source Link your analysis can be even more precise.
What is Source Link? Source Link is a set of packages and a specification for describing source control metadata that can be embedded in symbols, binaries, and packages. Once Source Link is set up your analysis reports will produce active links that navigate directly to your source code. In the following example, an active link in the call stack is pointing directly at a specific file, line, and commit on GitHub.
While Source Link is on by default for .NET source, enabling this for your code today requires a couple of additional steps.
Setting up Source Link
Debugging and diagnostics tools work best when symbols are available, typically the way to do that would be to ensure the PDBs are alongside the DLLs or, as I prefer, use embedded PDBs so they’re quite literally in the DLL already. You can enable Source Link experiences in your own .NET project by adding the following optional items to the property group:
<PropertyGroup>
    <!-- Optional: Publish the repository URL in the built .nupkg (in the NuSpec <Repository> element) -->
    <PublishRepositoryUrl>true</PublishRepositoryUrl>

    <!-- Optional: Embed source files that are not tracked by the source control manager in the PDB -->
    <EmbedUntrackedSources>true</EmbedUntrackedSources>

    <!-- Optional: Build symbol package (.snupkg) to distribute the PDB containing Source Link -->
    <IncludeSymbols>true</IncludeSymbols>
    <SymbolPackageFormat>snupkg</SymbolPackageFormat>
</PropertyGroup>
For source code hosted by GitHub or GitHub Enterprise you also need to include the following Nuget package:
<ItemGroup>
   <PackageReference Include="Microsoft.SourceLink.GitHub" Version="1.1.1" PrivateAssets="All"/>
</ItemGroup>
There is also source code link support for Azure Repos, Azure DevOps, GitLab, Bitbucket, gitweb, and gitea.
Summary
Please check out the improved Diagnose and Solve Problem experiences for App Services for Windows and App Services for Linux! We are actively working on Diagnostics Analysis for traces and we are always interested in your feedback.