General availability of Diagnostics tools for App Service on Linux .NET core apps
We are pleased to announce the public availability of Diagnostic tools for App Services Linux for .NET Core apps. With this capability, we now offer built-in support for collecting deep diagnostic artifacts that can help you debug application code issues. These artifacts include memory dumps and profiler traces. These tools empower developers to diagnose a variety of .NET code scenarios on Linux including:
- Slow performance
- High memory
- High CPU
- Runtime errors and exceptions
These tools enable you to self-diagnose your apps to identify if application code is contributing to the problem.
This tools are enabled with the latest Azure App Service platform update (96). To check the current platform version for you linux app, please check the environment variable PLATFORM_VERSION from the kudu console for your app.
Collection in Diagnose and Solve
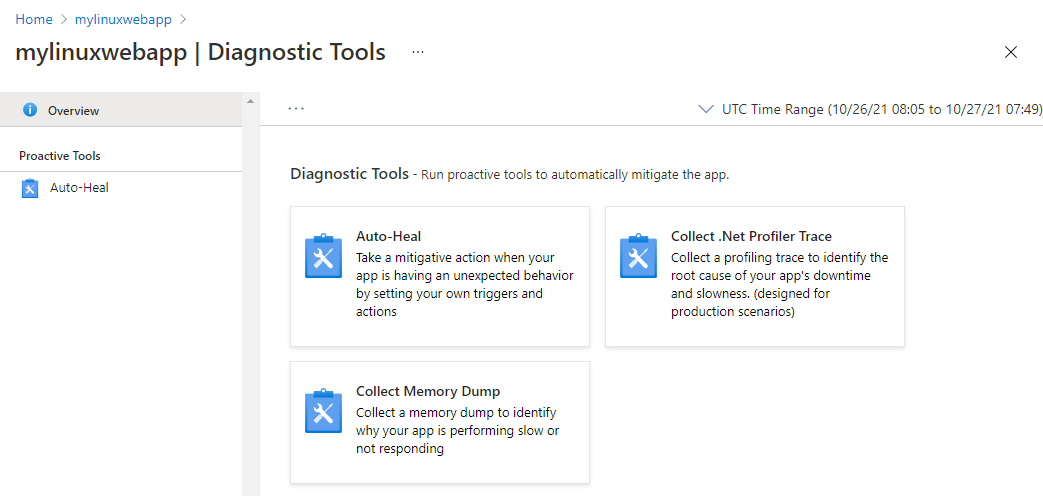
To access these new capabilities on your .NET Core apps hosted in Linux, navigate to the Diagnose and Solve Blade > Diagnostics Tools and select either Collect .NET Profiler Trace or Collect Memory Dump.
Collection in Kudu
The Kudu console for Linux app services has been updated to include new collection options for memory dumps and profiles on the Process Explorer page.
To navigate to this new Kudu experience use the following (update <mysite> with your app name): https://<mysite>.scm.azurewebsites.net/newui to check out the new experience.
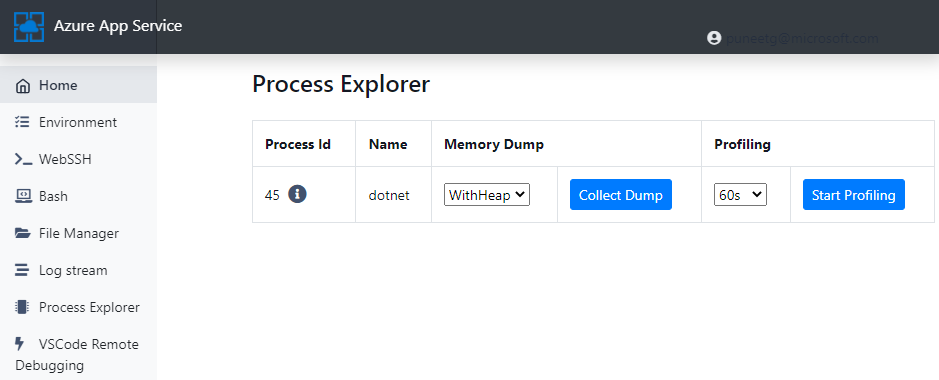
When you select the Process Explorer page, you can identify the process you want to debug. Use the drop-downs to select the type of memory dump and click Collect Dump. Alternatively, you can select the length of a profile from the drop-down and click Start Profiling.
Analyzing the problem
With the latest version of Visual Studio, you now have the ability to open and analyze managed dumps collected on Linux and use the best in class debugging tools available in Visual Studio!
Opening managed Linux Core dumps in Visual Studio
Memory dumps created on Windows machines have well-known extension (*.dmp) and thus have a straightforward association with your favorite memory analysis tools. By default, core dumps produced on Linux machines are created without an extension.
If your managed core dump doesn’t have an extension you can use the Open File dialogue, or drag and drop the file into your IDE, and Visual Studio will automatically identify and open it as a Linux core managed memory dump.
However, if the file was renamed to include the Windows dump extension (*.dmp) then use Visual Studio’s “Open with” feature in the “Open File” dialogue box, more details here.
Linux Core Dump File Summary
Once opened the Managed Linux Core Dump File Summary window shows a summary and module information for the dump file, and a list of Actions you can take, this remains consistent with existing dump handling experiences in Visual Studio.
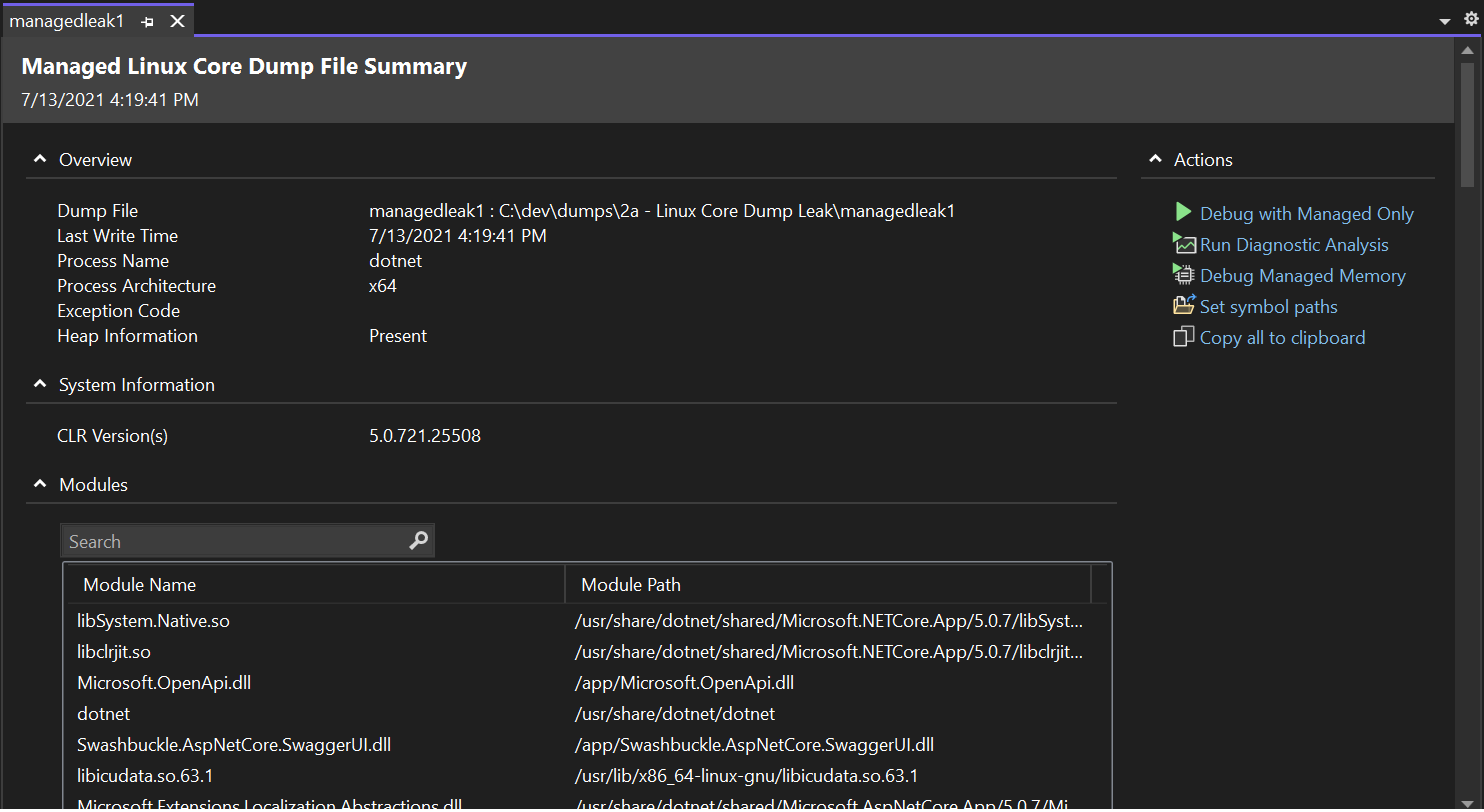
To start debugging, select Debug with Managed Only from the Actions section of the summary page and start using the awesome debugging tools you have become accustomed to.
You could, for example, start by reviewing the list of Threads or Tasks using the Parallel Stacks window. Or dig a bit deeper by switching between threads and examining the most interesting frames from the Calls Stacks view. You might then examine the value and state of variables using the Locals or Autos window. Essentially you get to examine every detail of the process just as if you set a breakpoint in your managed code on Linux.
Diagnostics Analysis
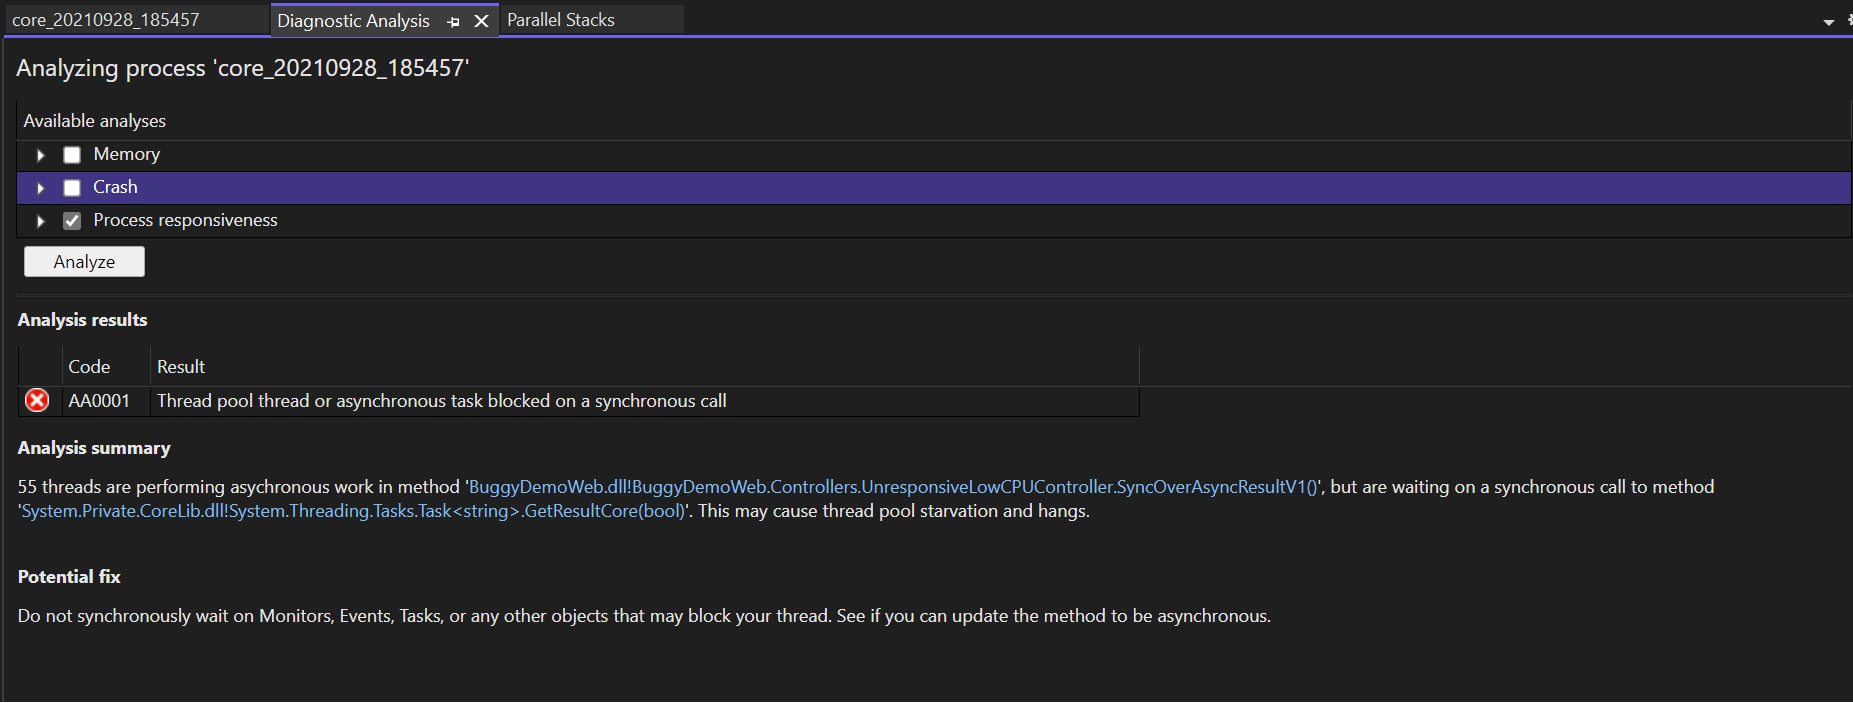
Visual Studio has also developed a set of analyzers to help identify the key signals in your memory dump that might indicate a problem with your production service. Visual Studio currently supports the following Analyzers with new and improved analysis coming in the very near future:
- CLR thread pool
- Sync over async
- Deadlock detection
More details on running analysis against managed Linux memory dump here.
Conclusion
In our Azure PaaS offerings, we continue to invest in a comprehensive diagnostics experience that helps you maximize your investment in Azure PaaS. We are excited to open up new debugging opportunities for deep diagnostics artifacts that will help you analyze the health of a broad and complex range of services.