Crash Monitoring in Azure App Service
Application crashes happen. A crash is when an exception in your code goes un-handled and terminates the process. These unhandled exceptions are also known as second chance exceptions. When your application crashes, all the in-flight requests (request that are currently being processed by the app) are aborted. An end user may experience an HTTP 502 error for those requests. When the app restarts, availability of the app is still impacted due to the cold start which makes things worse.
When you are running production applications, it is important to quickly identify the root cause of an application crash to troubleshoot and minimize the business impact. Having the right set of logs is key to a quick resolution. However, it could be difficult to capture these logs at the time of the crash.
With App Service Diagnostics’ Crash Monitoring, you can collect memory dumps and call stack information at the time of the crash to identify the root cause. Crash Monitoring works by enabling an agent on your application hosted on App Service. The agent attaches a debugger (procdump.exe in this case) when process starts. If the process crashes with an unhandled exception, the debugger captures a memory dump.
Currently offered in App Service Diagnostics for Windows web apps.
Enabling Crash Monitoring
If you are using Remote Debugging on your app, Remote Debugging takes preference over Crash Monitoring, and Crash Monitoring will not run.
Using the Azure Portal
To access Crash Monitoring, browse to your App Service in the Azure Portal and click Diagnose and Solve problems in the left navigation panel. Then, click on the home page tile named Diagnostic Tools. Once you are inside Diagnostic Tools, click Crash Monitoring.
Configuration
Crash Monitoring operates based on 4 conditions that you can configure to your needs. Enabling crash monitoring might incur slight performance impact on your app because a debugger is always attached to your process. The delay would vary depending upon the number of exceptions that your application code is throwing.
- Storage account: The selected storage account will store the memory dumps captured via Crash Monitoring. Avoid changing the storage account for your app if there is an active crash monitoring session in progress.
- Start time: Crash Monitoring session will begin at the selected time.
- Stop time: Crash Monitoring session will end at the selected time regardless of the maximum of memory dumps captured. To completely disable the agent after the Crash Monitoring session, click on the Disable Agent link.
- Max No. of memory dump: The Crash Monitoring session concludes once the maximum number of dumps has been gathered. If you want to fully deactivate the agent after the Crash Monitoring session, simply click the Disable Agent link. Before connecting the debugger to the process, the crash monitoring agent verifies the current number of dumps in the storage account. Once the necessary amount of memory dumps has been created, the agent will cease to gather more unless you remove the current dumps from storage or relocate them to another location.
The Crash Monitoring configurations are saved in your app’s app settings. Each time a new configuration is saved, your app will restart.
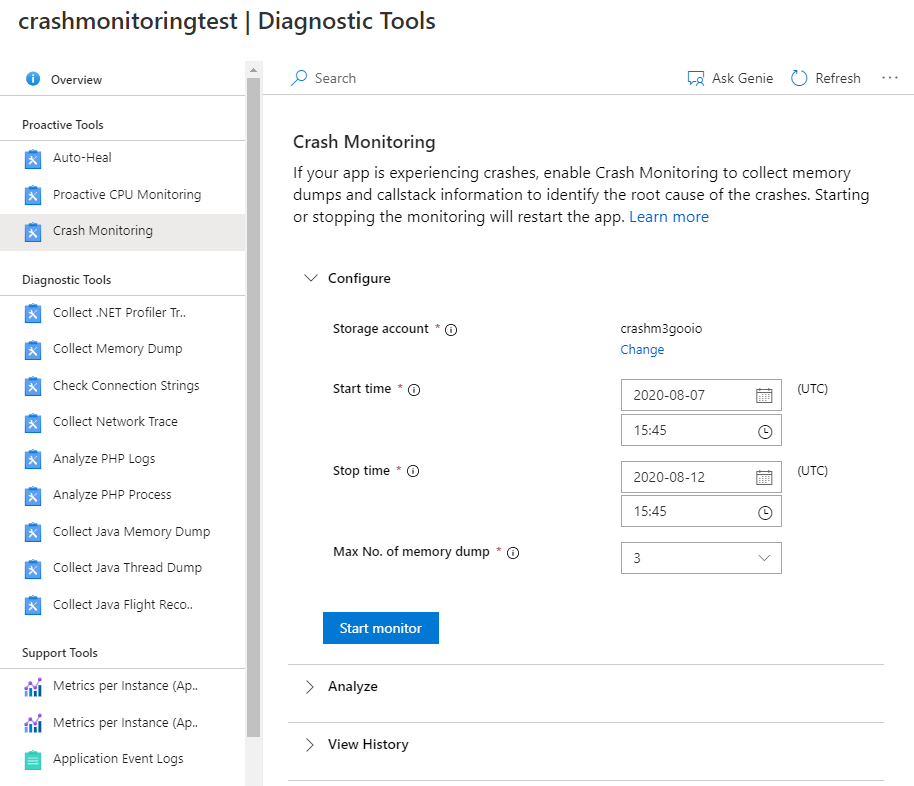
Once you click Start Monitor, the configuration will be saved, and the monitoring session will begin.
Deleting a memory dump from a storage account while the tool is still running may cause the tool to collect additional data than desired. Please ensure the session is completed before you delete the memory dumps from the storage account.
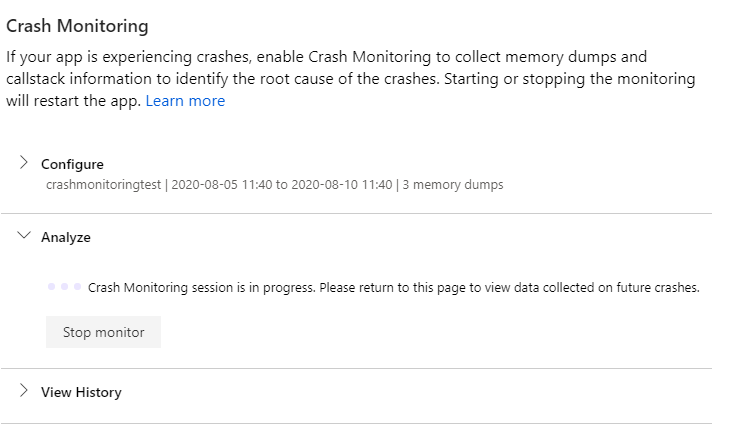
Analyzing the Data
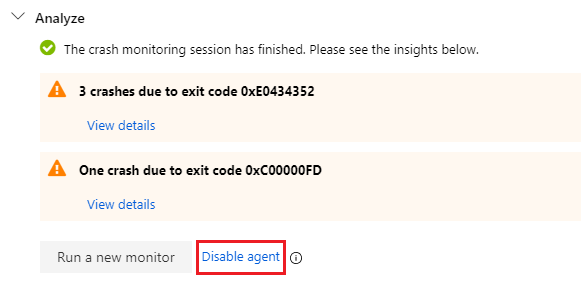
Once you configure and start the Crash Monitoring session, the tool will automatically collect memory dumps and stack trace as your application crashes. You can view the memory dumps and stack trace information grouped by the exit code in the Analyze section. Memory dumps and stack trace information become available as your application crashes though you may experience 15 minutes of delay for complete logs to show.
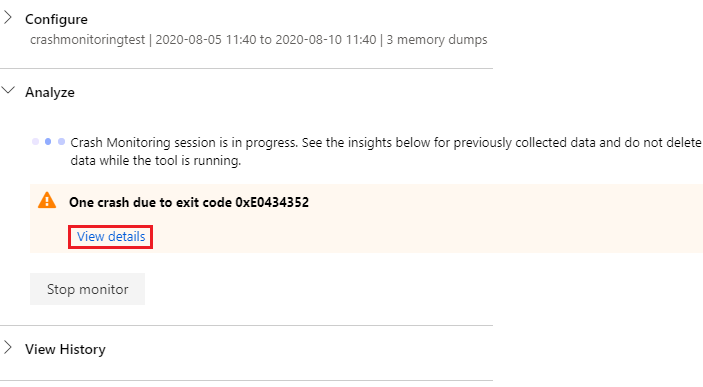
You can click on the View details link to expand the details of the crash.
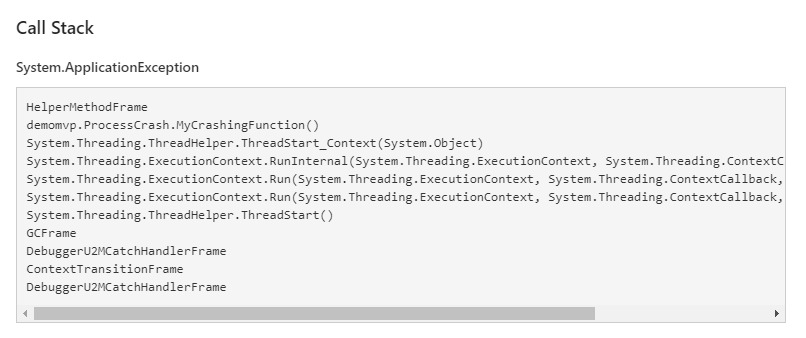
Then, you can click on the View link under Callstack to view the call stack for the crash.
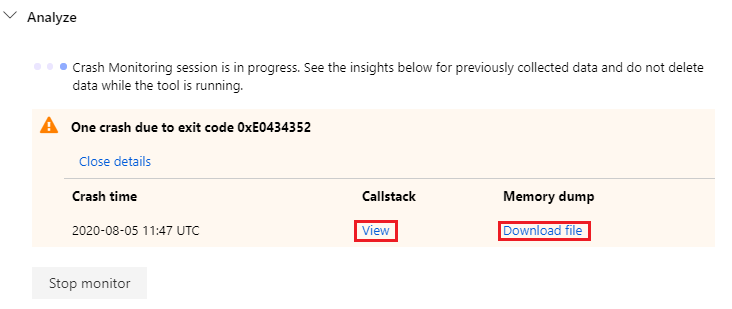
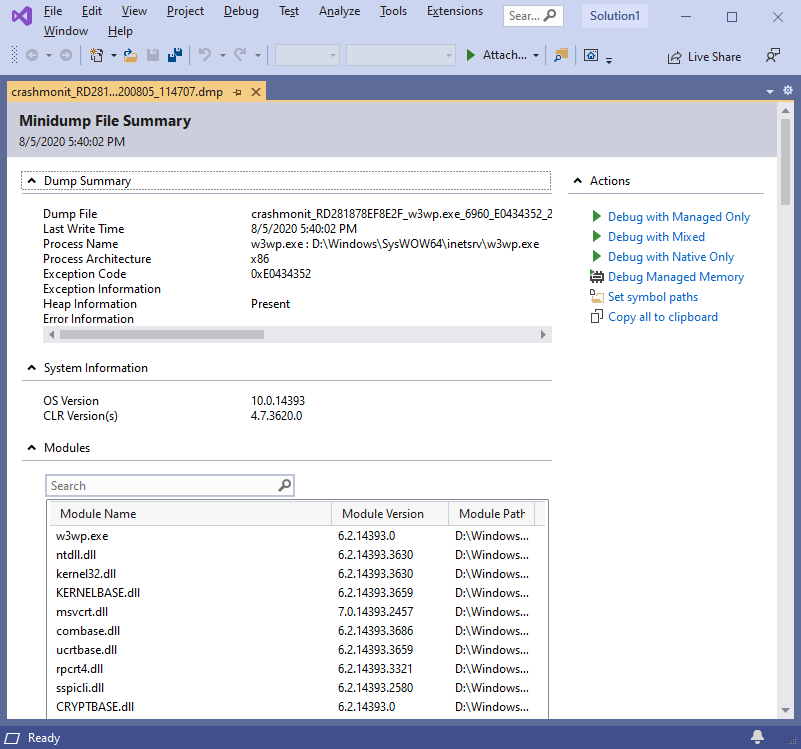
Also, there is an option to download the dump file directly. Click on the Download file link next to download the dump file. Once downloaded, open it in Visual Studio.
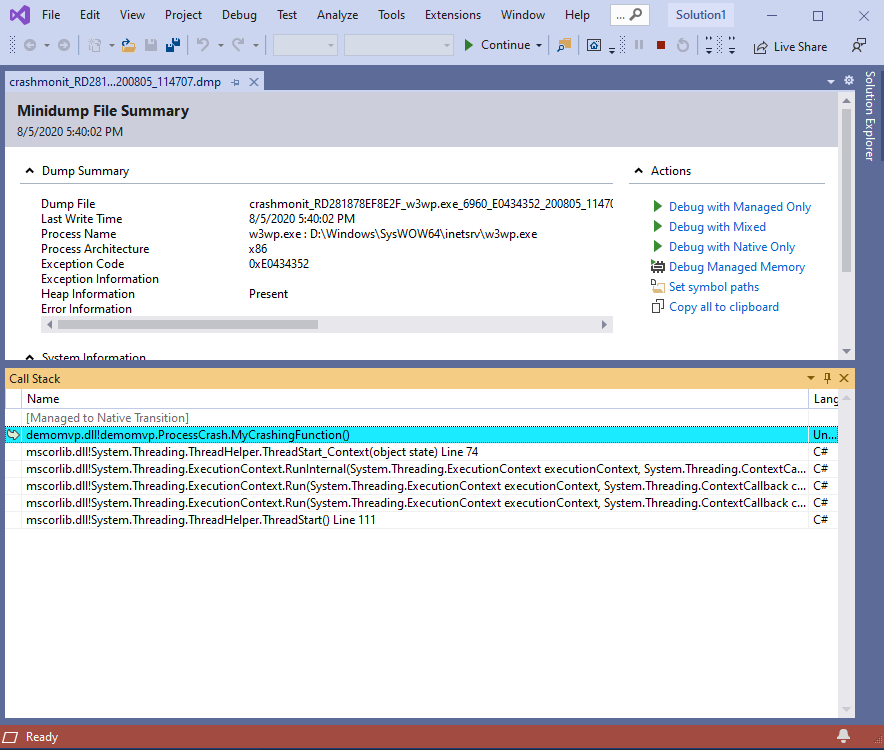
Not only this, you can also launch the call stack window by navigating to the Debug menu and then selecting Windows and then choosing Call Stack.
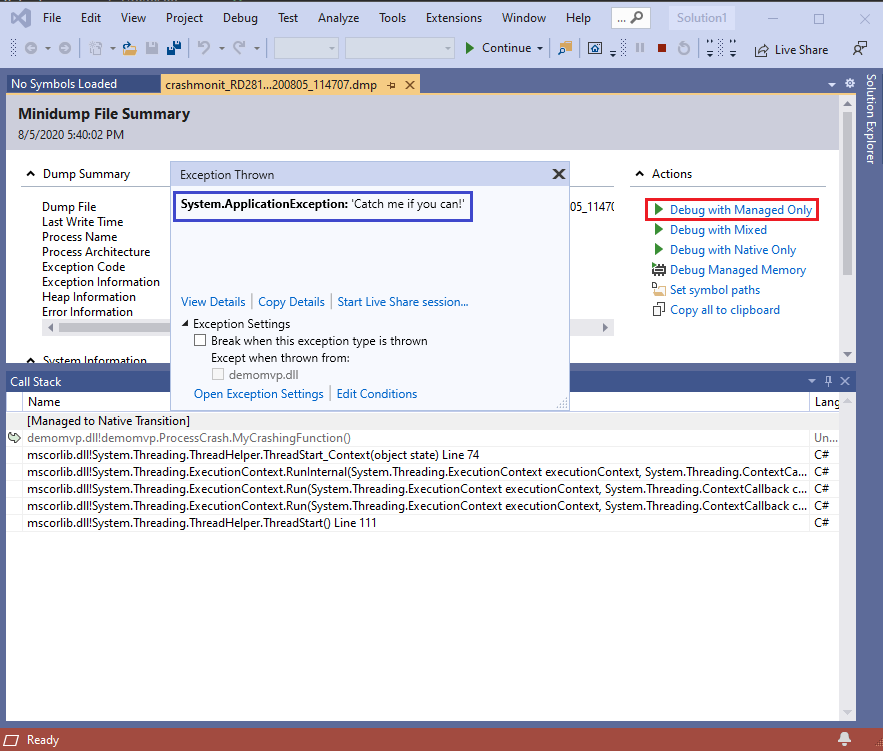
Clicking on Debug with Managed Only will attempt to load the PDB files and open the exact source code of the function if Visual Studio and symbols are lined up properly. Even if they are not, the Visual Studio Debugger will show exception details like below. In this way, you can identify the call stack and exception message directly from the memory dump file.
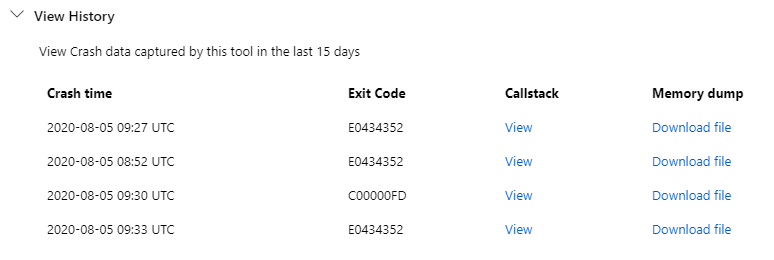
View Historical Data
You can view up to past 15 days of data in the View History section. If you delete the memory dumps from your storage accounts, they will no longer show in this section.
Disable Crash Monitoring
To disable Crash Monitoring, click Disable agent in the Analyze section. This will remove the app settings for Crash Monitoring and restart your app.
Watch a Demo
Watch this video to learn more about the feature and analyzing the report generated by this tool.
Feel free to share your feedback or questions about Crash Monitoring by emailing diagnostics@microsoft.com
Leave a comment