The Ultimate Guide to Running Healthy Apps in the Cloud
Modern-day data centers are extremely complex and have many moving parts. VMs can restart or move, systems are upgraded, and file servers are scaled up and down. All these events are to be expected in a cloud environment. However, you can make your cloud application resilient to these events by following best practices. This document outlines 13 crucial steps that you can take to ensure that your app is cloud ready. By taking these steps, you will ensure that any events in the data center will have negligible effects on your app and that your app will be more resilient and future proof.
As mentioned above, your instances are expected to and will restart. They will be upgraded and will sometimes suffer from file server movements. However you can make your app resilient to all these incidents. In order to guarantee the maximum uptime for your app, please ensure that you follow all practices.
Use Multiple Instances
Running your app on only one VM instance is an immediate single point-of-failure. By ensuring that you have multiple instances allocated to your app, if something goes wrong with any particular instance, your app will still be able to respond to requests going to the other instances. Keep in mind that your app code should be able to handle multiple instances without synchronization issues when reading from or writing to data sources. You can allocate multiple instances to your app using the “Scale out (App Service Plan)” blade:
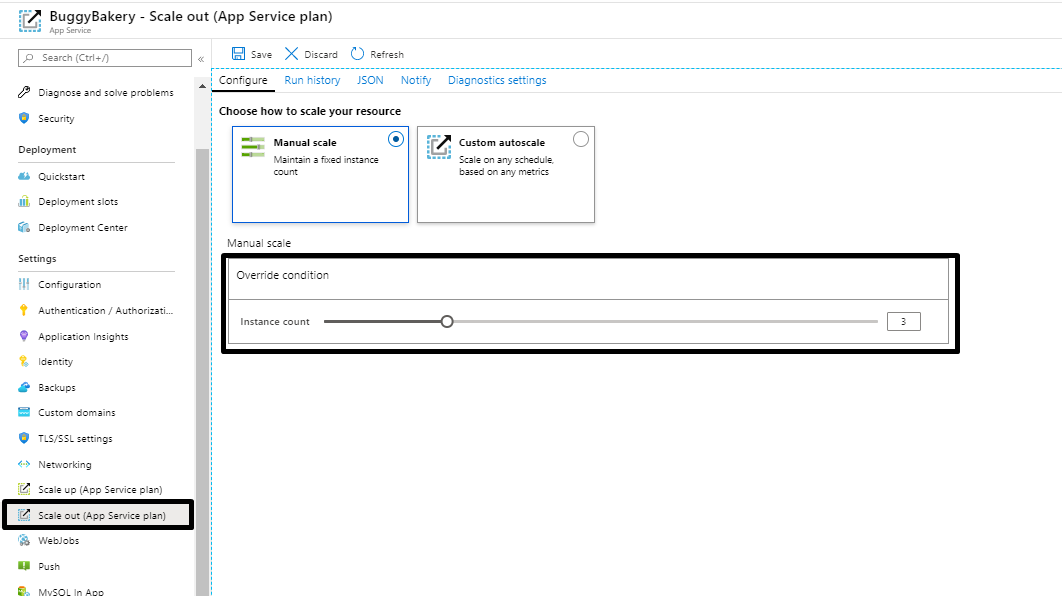
To avoid a single point-of-failure, run your app with at least 2-3 instances. This is especially important if your app takes considerable time to start (known as cold start). Running more than one instance ensures that your application is available when App Service moves or upgrades the underlying VM instances. You can also configure rules to automatically scale out based on predefined rules such as:
- Time of day (when the app has the most traffic)
- Resource utilization (memory, CPU, etc.)
- A combination of both!
Learn More
Update your default settings
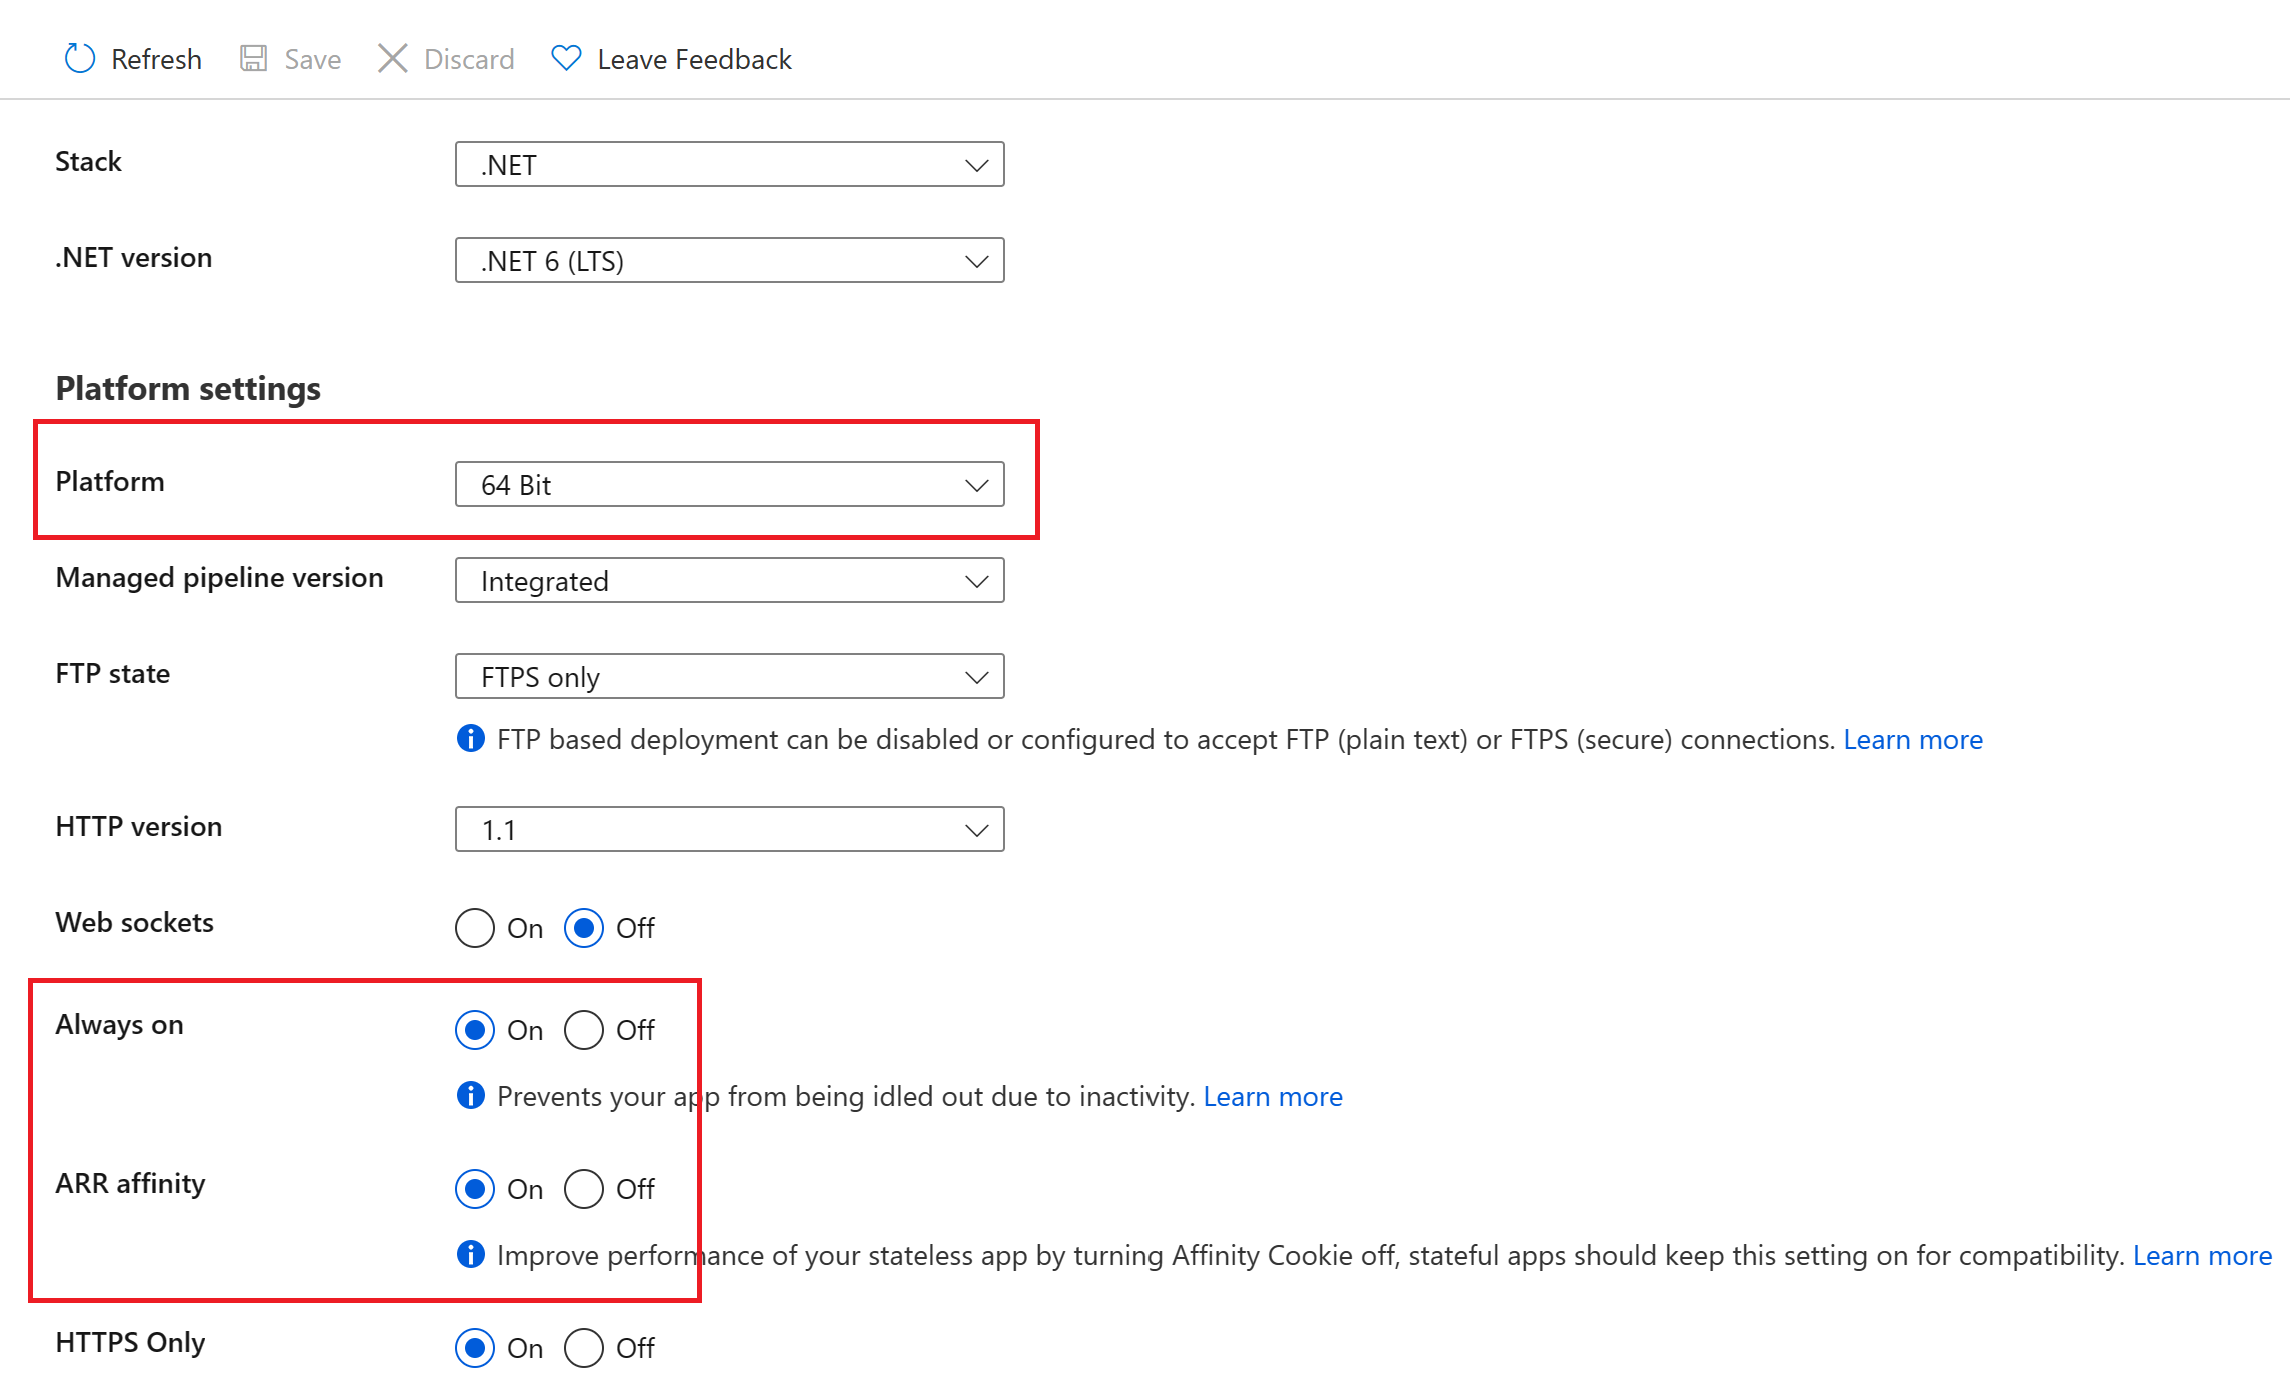
App Service has many settings for developers to configure the web app to their use case. Always-On keeps your VM instances alive even when no requests have been received in the last 20 minutes. By default, Always-On is disabled; enabling Always-On will limit application cold starts.
ARR Affinity creates sticky sessions so that clients will connect to the same app instance on subsequent requests. However, ARR Affinity can cause unequal distribution of requests between your instances and possibly overload an instance. Disabling ARR Affinity assumes that your application is either stateless, or the session state is stored on a remote service such as a cache or database.
Lastly, please set the Platform setting from 32 Bit to 64 Bit. The maximum available amount of memory for a 32-bit process (even on a 64-bit operating system) is 2 GB. By default, the worker process is set to 32-bit in App Service (for compatibility with legacy web applications). Consider switching to 64-bit processes so you can take advantage of the additional memory available in your Web Worker role.
For production apps that are aiming to be robust, it is recommended to set Always on to On, ARR Affinity to Off and Platform to 64 Bit.
You can change these settings in the configurations section of the Azure Portal, under the General Settings tab:
Learn More
- Configure an App Service app in the Azure portal
- Disable Session affinity cookie (ARR cookie) for Azure web apps
Use Production Hardware
App Service offers a variety of hardware tiers (also known as SKUs) to suit different customer needs. When creating a new App Service Plan, you have an option to select a different hardware tier for your plan:
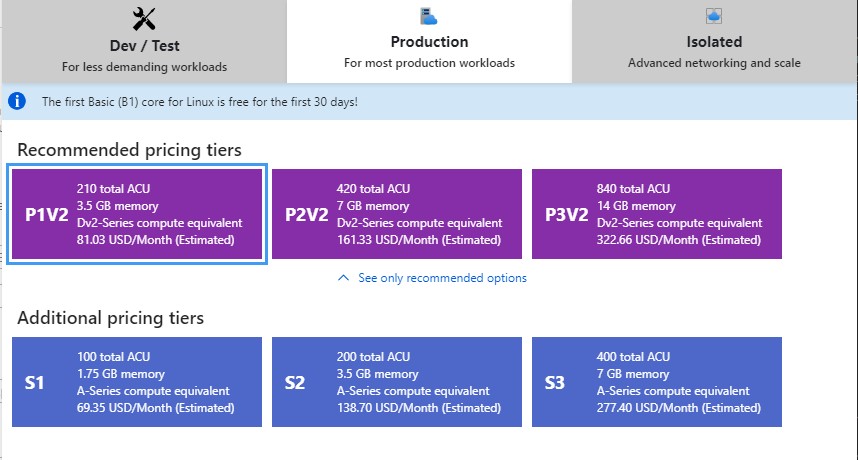
If your App Service Plan is used for production, please ensure that your App Service Plan is running on one of the recommended “production” pricing tiers. Moreover, if your application is resource intensive, make sure to select the appropriate pricing tier within the recommended ones according to the need of your app. For example, if your application consumes a lot of CPU cycles, running on an S1 pricing tier will not be ideal as it could potentially cause high CPU that would cause downtime or slowness on your app.
Learn More
Leverage Deployment Slots
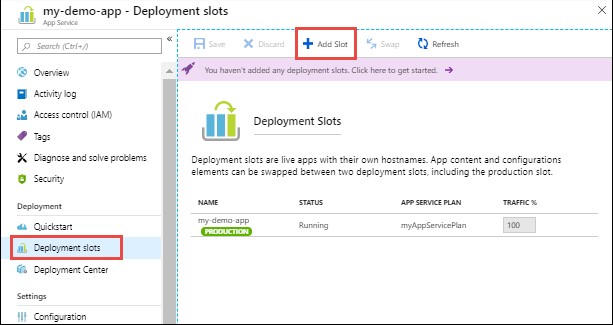
Before deploying your new code to production, you can leverage the Deployment Slots feature in App Services to test your changes. Deployment slots are live apps with their own host names. App content and configurations elements can be swapped between two deployment slots, including the production slot.
Deploying your application to a non-production slot has the following benefits:
- You can validate app changes in a staging environment before swapping it into the production slot.
- Deploying an app to a slot first and swapping it into production makes sure that all instances of the staging slot are warmed up before swapping into production. This eliminates downtime when you deploy your app. The traffic redirection is seamless, and no requests are dropped because of swap operations. You can automate this entire workflow by configuring auto swap.
- After a swap, the slot with previously staged app now has the previous production app. If the changes swapped into the production slot aren’t as you expect, you can perform the same swap immediately to get your “last known good site” back.
Please note that Deployment Slots are only available for Standard, Premium, or Isolated App Service plan tiers
We highly recommend using Swap with Preview. Swap with Preview allows you to test the app in your staging slots against your production settings and also warm up the app. After doing your tests and warming up all the necessary paths, you can then complete the swap and the app will start receiving production traffic without restarting. This has a high impact on your app’s availability & performance.
Learn More
- Set up staging environments in Azure App Service
- Azure Web App Deployment Slot Swap with Preview
- Deployment best practices
Set your Health Check path
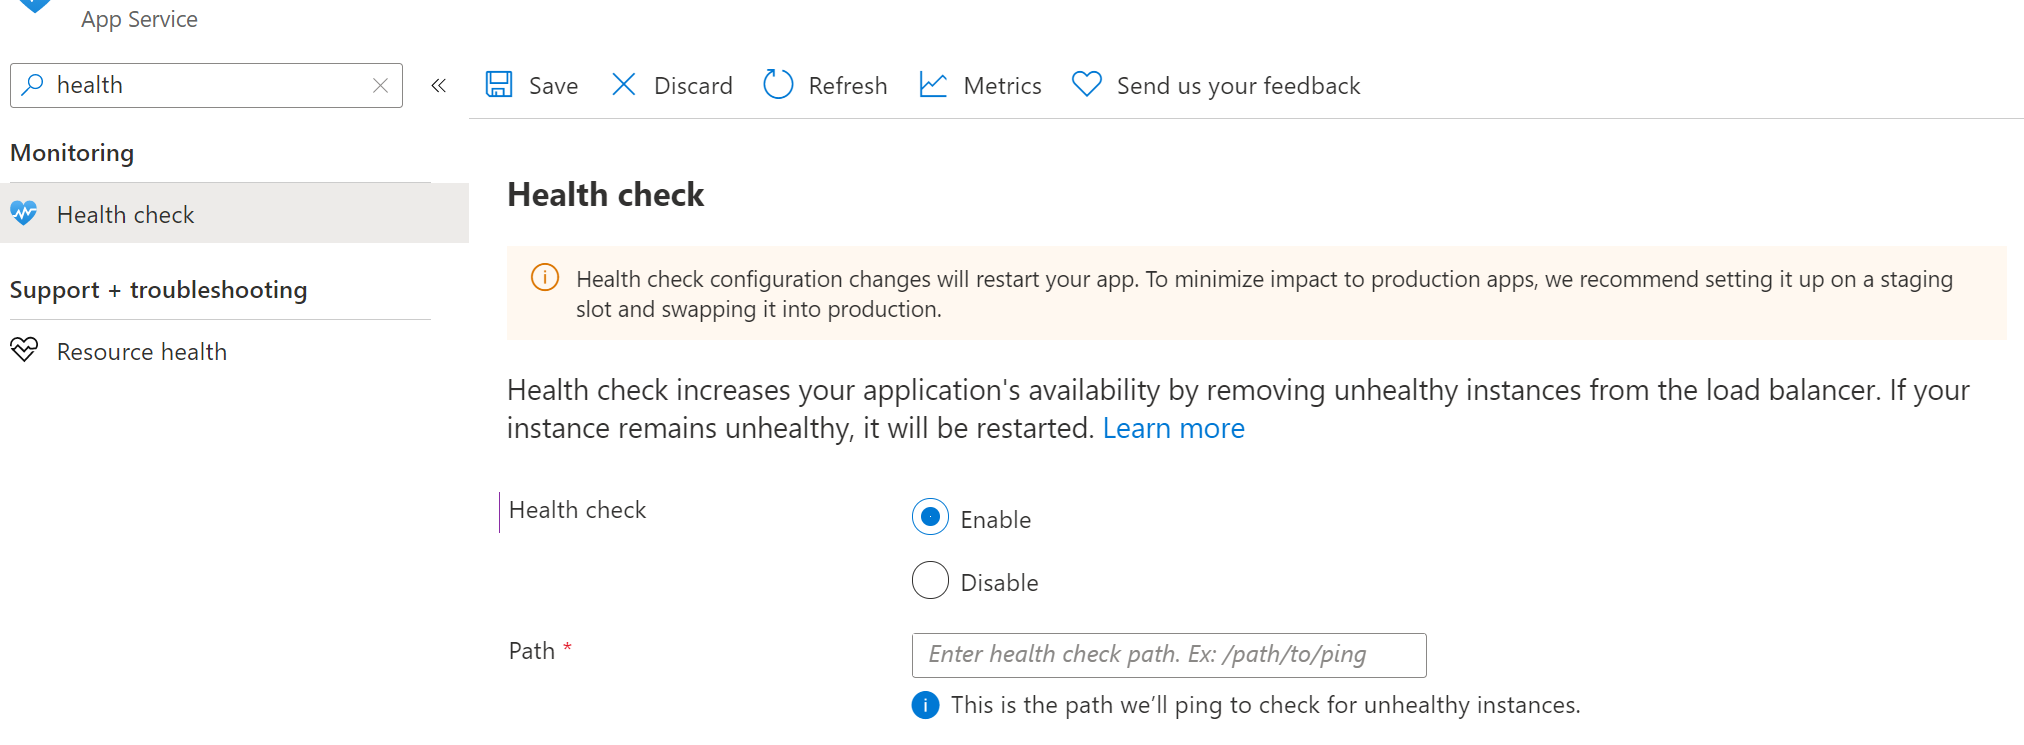
App Service allows you to specify a health check path on your apps. The platform pings this path to determine if your application is healthy and responding to requests. When your site is scaled out to multiple instances, App Service will exclude any unhealthy instance(s) from serving requests, improving your overall availability. Your app’s health check path should poll the critical components of your application, such as your database, cache, or messaging service. This ensures that the status returned by the health check path is an accurate picture of the overall health of your application.
-
Go to Monitoring > Health Check on the Web App blade for Azure portal:
-
Set the value of the path that our service will ping.
-
Hit save to save the configuration.
Please note that the Health Check feature works only when you have two or more instances, which is a very strong recommendation. For a single instance web app, the traffic is never blocked even if that single instance is encountering issues.
Learn More
Use Application Initialization
Application Initialization ensures that your app instances have fully started before they are added to they start serving requests. Application Initialization is used during site restarts, auto scaling, and manual scaling. This is a critical feature where hitting the site’s root path is not sufficient to start the application. For this purpose a warm-up path must be created on the app which should be unauthenticated and App Init should be configured to use this url path.
Try to make sure that the method implemented by the warm-up url takes care of touching the functions of all important routes and it returns a response only when warm-up is complete. The site will be put into production only when it returns a response (success or failure) and app initialization will assume “everything is fine with the app”. App Initialization can be configured for your app within web.config file.
Learn More
Enable Local Cache
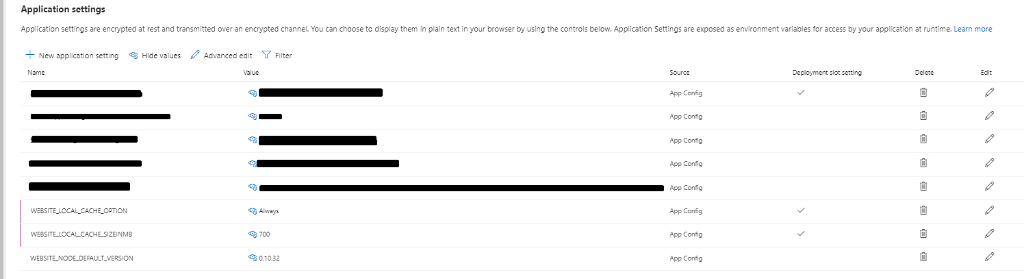
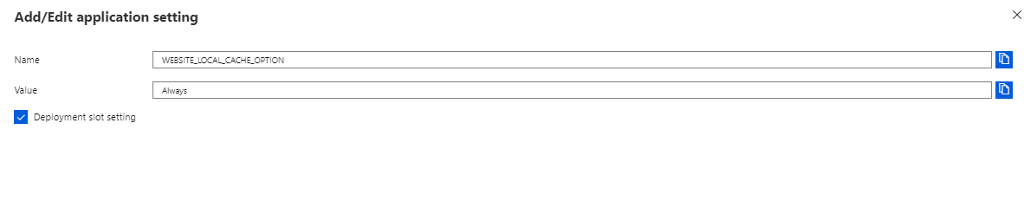
When this feature is enabled, the site content is read, written from the local virtual machine instance instead of fetching from Azure storage (where site content is stored). This will reduce the number of recycles required for the app. It can be enabled through Azure portal from the “General -> Application settings”. On this page under the App settings section add WEBSITE_LOCAL_CACHE_OPTION as key and "Always" as value. Also add the WEBSITE_LOCAL_CACHE_SIZEINMB with a desired local cache size value up to 2000MB (if not provided, it defaults to 300 MB). It helps to provide the cache size specially when the site contents are more than 300 MB. Ensure that site contents are less than 2000MB for this feature to work. Also it is a good practice to keep it as a slot setting so that it does not get removed with a swap.
The most important thing to keep in mind here is that app should not be doing local disk writes for state persistence of its data/transactions.
External storage like storage containers, db or cosmosDB should be used for storage purposes.
Please note that the behavior of Local Cache depends on the language and CMS you are using. For best results, we recommend using it for .net and .netcore apps as long as local writes are not being done by the app.
Learn More
Auto-Heal
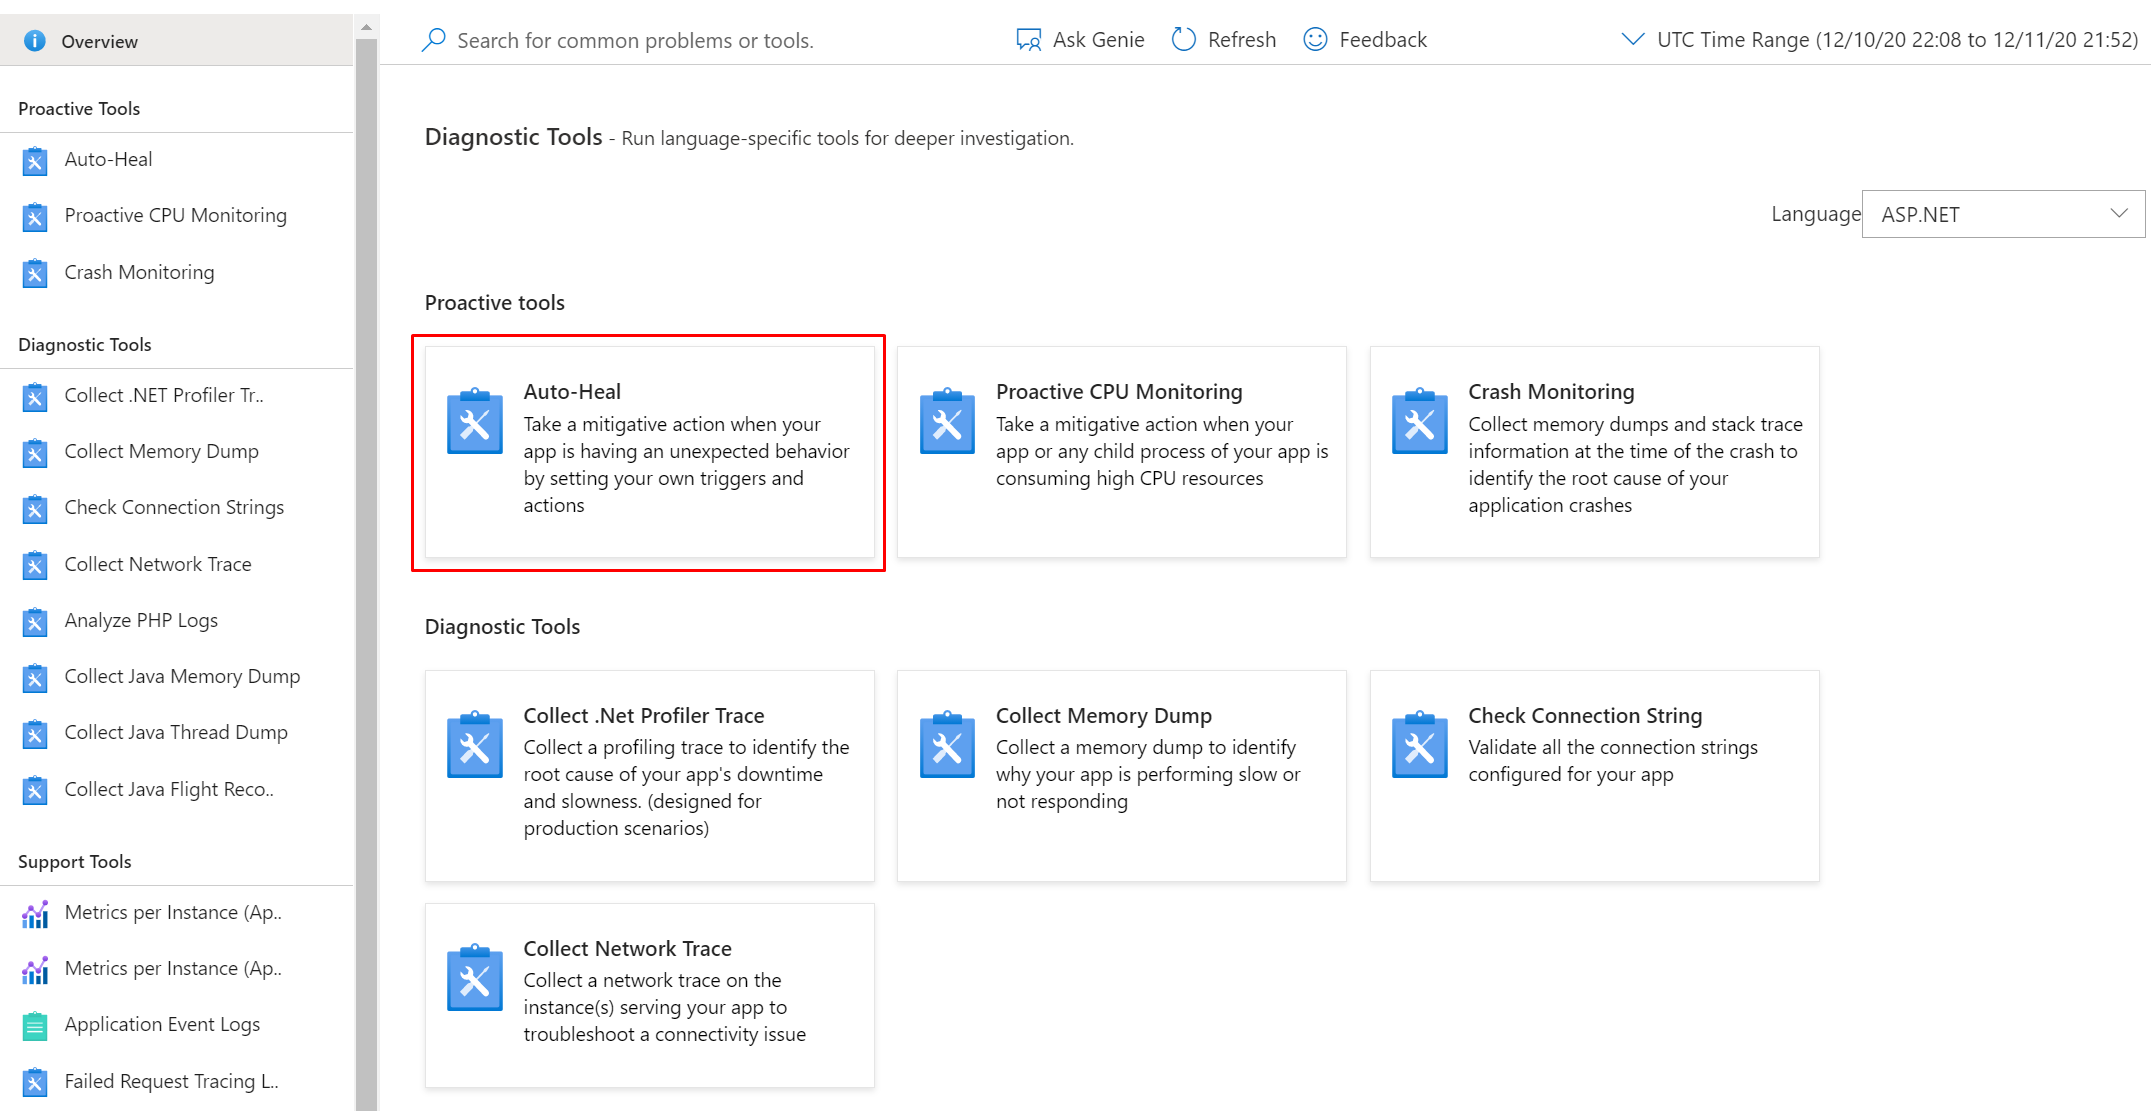
Sometimes your application might experience unexpected behaviors that could be resolved by a simple restart. The Auto-Heal features allows you to do exactly that! It allows you to define the ‘condition’ that would trigger Auto-Heal and the ‘action’ that Auto-Heal will initiate when the condition is met.
You can create an Auto-Heal mitigation rule by going to “Diagnose and Solve problems” section -> “Diagnostic Tools” tile and then “Auto-Heal” under Proactive Tools section.
Below are example filter values to set up, however if some other value of error code and frequency suits your application, please modify accordingly:
| Condition | Value |
|---|---|
| Request Count | 70 |
| Status Code | 500 |
| Sub-status code | 0 |
| Win32-status code | 0 |
| Frequency in seconds | 60 |
Once the condition above is met, we recommend configuring an action to:
- Recycle Process
and add an ‘Override when Action Executes’:
- Startup Time for process before auto heal executes: 3600 seconds (1 hour)
Learn More
Minimize App Service Plan Density
Running too many Apps in an App Service Plan can have a negative impact performance. All the apps running on the App Service Plan can be seen on “Apps” under “Settings” section in your App Service Plan on Azure portal.
You can verify the App Service Plan density with the App Service Plan Density Check. Learn more here:
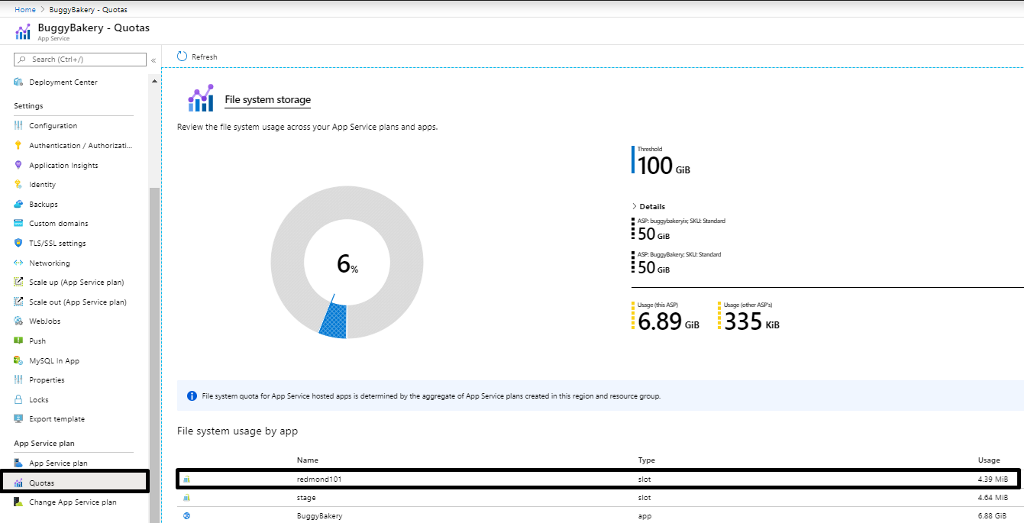
Monitor Disk Space usage
Ensure that the disk space used by www folder should be less than 1GB. It is a very healthy practice in reducing downtime during app restarts and hence improve the application performance. File system usage can be tracked from “App Service Plan -> Quotas” section in Azure portal.
Enable Application Insights
Application Insights offers a suite of features that empower you to troubleshoot incidents that happen on your app. You can use it to debug code errors, diagnose performance degradations caused by dependencies and more.
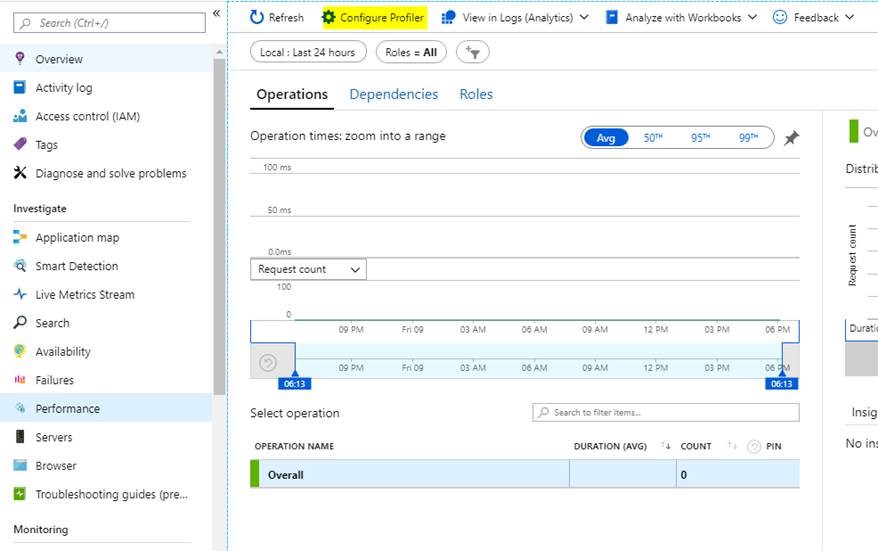
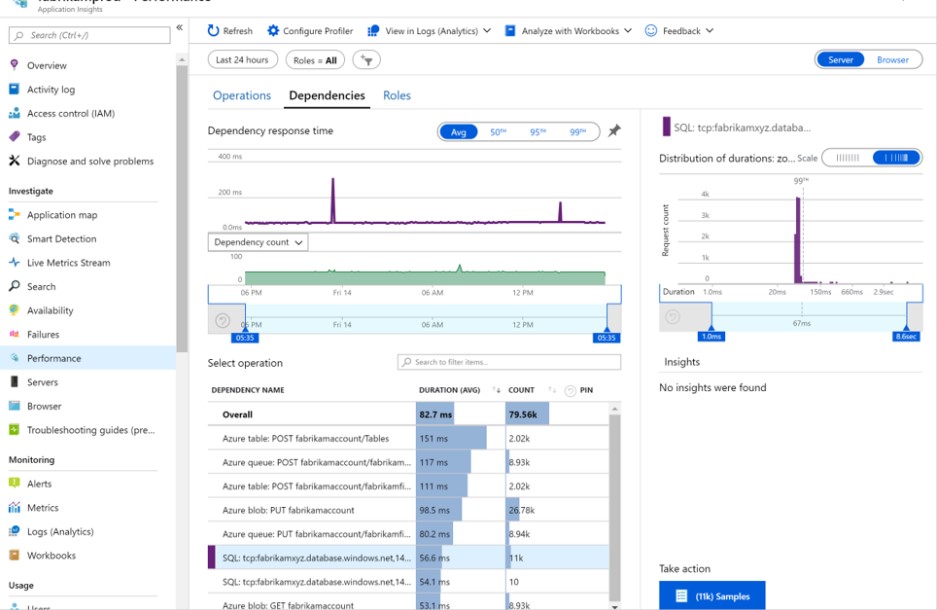
One of the powerful features of Application Insights is the App Insights Profiler. Enabling Application Insights Profiler provides you with performance traces for your applications that are running in production in Azure. Profiler captures the data automatically at scale without negatively affecting your users. Profiler helps you identify the “hot” code paths that take the longest when handling a web request. Profiler works with .NET applications. To enable it, go to your Application Insights in Azure portal. Click on Performance under Investigate.
-
In the Performance pane click on “Configure Profiler”
-
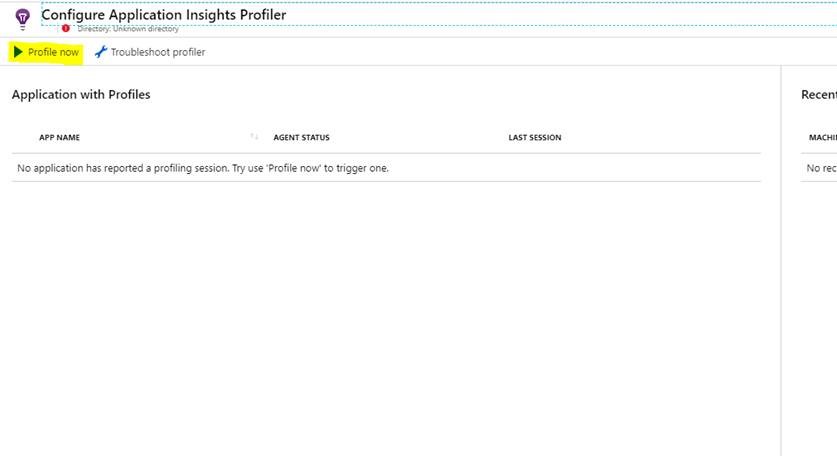
In the pane that opens after that, click on “Profile Now” to start profiling.
-
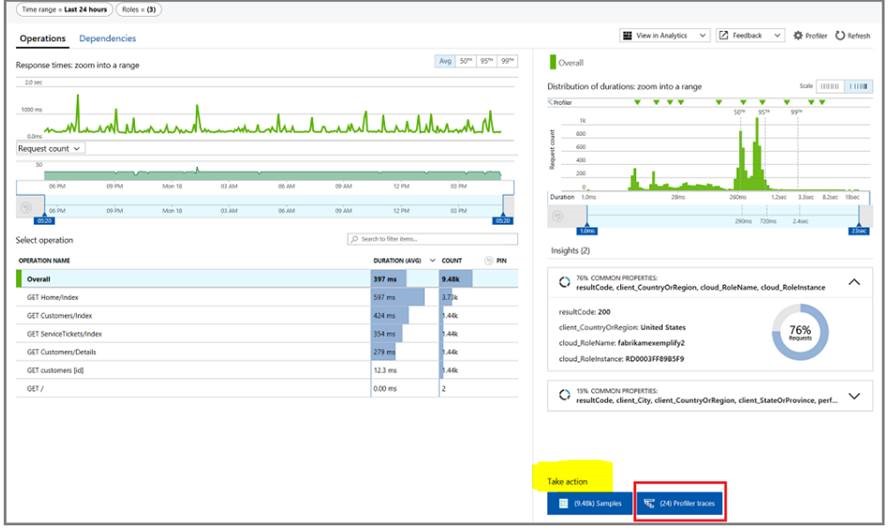
When Profiler is running, it profiles randomly about once per hour and for a duration of two minutes. If your application is handling a steady stream of requests, Profiler uploads traces every hour. To view traces, in the Performance pane, select Take Actions, and then select the Profiler Traces button.
-
App Insights also allows you to track dependencies in your application. You can leverage this feature to troubleshoot slow requests. To automatically track dependencies from .NET console apps, install the Nuget package
Microsoft.ApplicationInsights.DependencyCollector, and initializeDependencyTrackingTelemetryModuleas follows:DependencyTrackingTelemetryModule depModule = new DependencyTrackingTelemetryModule(); depModule.Initialize(TelemetryConfiguration.Active); -
Each request event is associated with the dependency calls, exceptions, and other events that are tracked while your app is processing the request. So if some requests are doing badly, you can find out whether it’s because of slow responses from a dependency. You can see a waterfall view of the requests in the performance blade as well under the “Dependencies” tab:
You can also leverage our newly released App Insights integration with App Service Diagnostics, discussed in details here:
Learn More
- Profile production applications in Azure with Application Insights
- Diagnose exceptions in your web apps with Application Insights
- Dependency Tracking in Azure Application Insights
Deploy in Multiple Regions
You can deploy Azure Front Door or Azure Traffic Manager to intercept traffic before they hit your site. They help in routing & distributing traffic between your instances/regions. In the event that a catastrophic incident happens in one of the Azure Datacenters, you can still guarantee that your app will run and serve requests by investing in one of them.
There are additional benefits to using Front Door or Traffic Manager, such as routing incoming requests based the customers’ geography to provide the shortest respond time to customers and distribute the load among your instances in order not to overload one of them with requests.
Learn More
- Controlling Azure App Service traffic with Azure Traffic Manager
- Quickstart: Create a Front Door for a highly available global web application
Check App Service Diagnostics
Finally, you can check the progress you’ve accomplished in making your app resilient by leverage the “Risk Assessments” section available in App Service Diagnostics here:
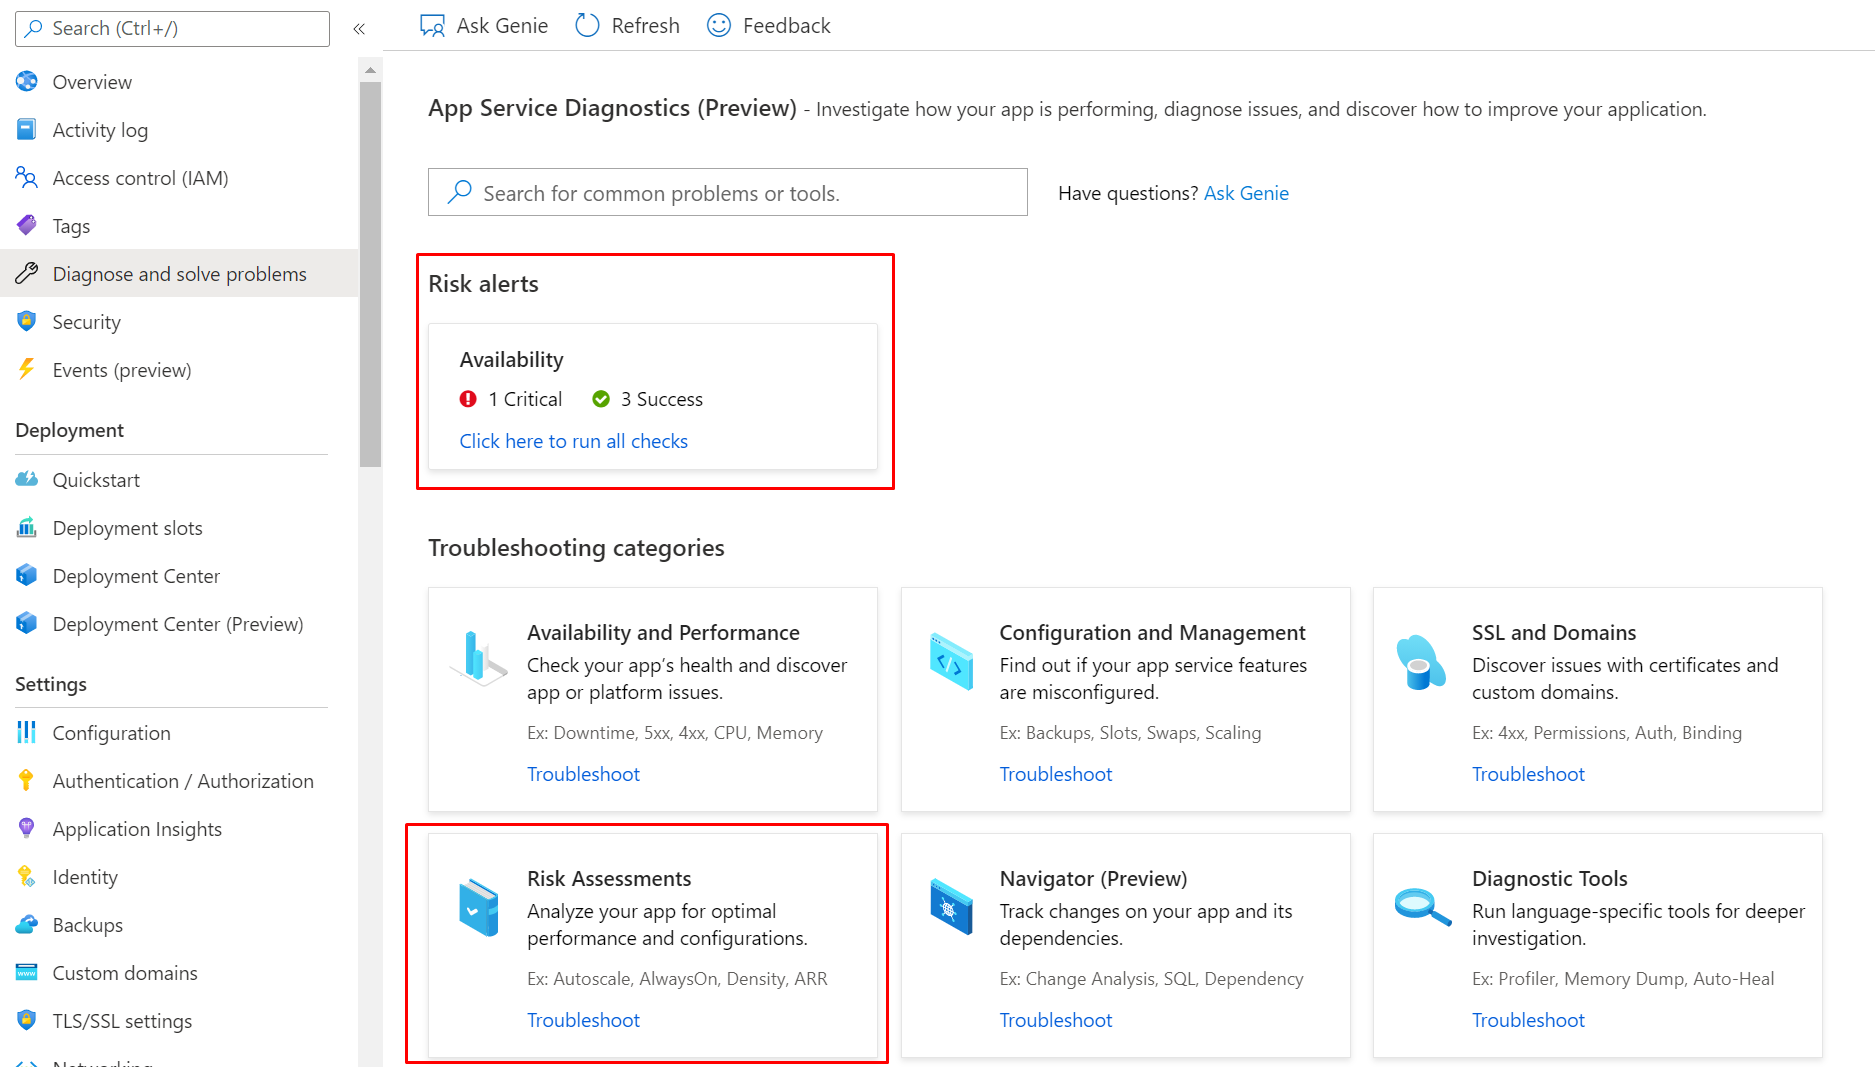
You’ll be presented by 2 options:
- Best Practices for Availability & Performance
- Best Practices for Optimal Configuration
We recommend that you follow all the best practices listed in those detectors and get them all to green!
Finally, we also recommend that you take a look at the Cloud Design Patterns document to minimize the application start time and follow more resiliency recommendations.
Feel free to post any questions about App Resiliency on the MSDN Forum.