Get visibility into your app’s dependencies with Navigator
Application downtime can be dreadful, especially when the app is handling mission-critical load. There could be countless causes for your app’s downtime ranging from the app’s code to the misconfiguration of its dependencies. Fast troubleshooting is the key to minimizing the production impact. However, the complex nature of today’s applications makes narrowing down the cause a lengthy and difficult process. Sometimes it requires thorough investigation of changes made to each dependent resource.
We are excited to announce Navigator, a new feature offering for Windows apps in App Service Diagnostics, an intelligent and guided experience that helps you troubleshoot your web app with little to no configuration. Navigator is a new diagnostic feature that provides a centralized view of a web app and its dependencies as well as the changes made to those dependencies. The feature can automatically render dependencies in the same subscription as a dependency map and display the changes made to each resource, leveraging Change Analysis. With the new experience, you can easily identify the dependencies of your web app and explore the changes as part of your troubleshooting experience.
Paired with information from existing diagnostics information in App Service Diagnostics, Navigator can supplement your troubleshooting experience by providing a timeline of the changes made by your web app and its dependencies. Correlating this information with other information offered in App Service Diagnostics can help you further understand the changes and narrow down on potential causes for unhealthy behavior.
Finding Navigator
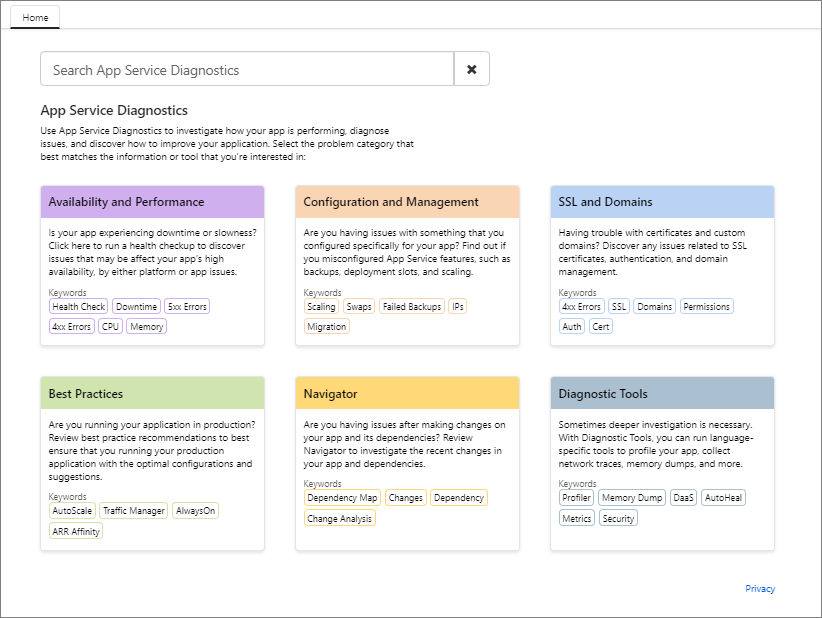
Navigator can be accessed through App Service Diagnostics’ homepage tile called Navigator so you can use it concurrently with information from other tiles. For more information on how to navigate to App Service Diagnostics, please visit Azure App Service diagnostics overview.
How to enable Change Analysis
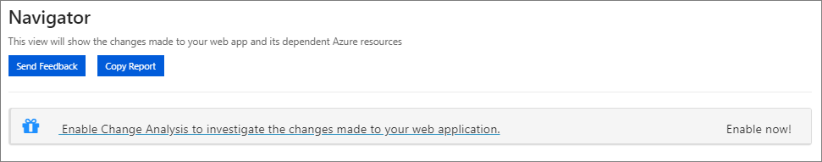
Upon opening the tool, you will see a message to enable Change Analysis. You can access the Change Analysis Settings by clicking on the Enable Now button.
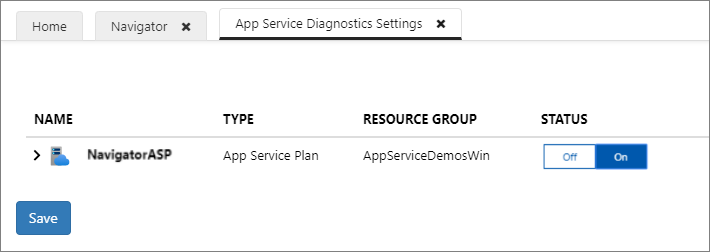
Turn on Change Analysis and click Save to get property changes and code changes for your main web app as well as property changes for your dependent resources. [Note: If you are using Change Analysis for the first time, enabling this setting will register Change Analysis Resource Provider on your subscription.] By enabling Change Analysis, your app’s Kudu will trigger a snapshot every 4 hours to capture the changes made between those time intervals.
To disable Change Analysis on your web app, click on Go to Change Analysis Settings in the upper right corner of Navigator view. [Note: Change Analysis Resource Provider is still registered on the subscription of your web app.] To unregister Change Analysis Resource Provider from your subscription, navigate to your subscription, click Resource providers in the left navigation, select Microsoft.ChangeAnalysis, and click Unregister.
Navigating through the change timeline
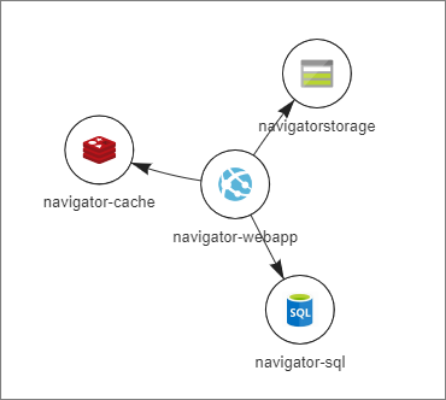
Once Change Analysis is enabled, you will see a dependency map of your web app and its dependencies in the same subscription. You can check the inner workings of your app using this view. Also, if you click on a resource supported by Change Analysis, you can view the recent changes made to the selected resource. See Change Analysis service to view the list of dependencies supported by Change Analysis service.
Once you click on each resource on the map, you will see a timeline with square boxes and a list of changes detected over the last 24 hours. These square boxes represent change(s) made during the 24 hours. You can click on each box to filter for corresponding change(s) in the list of changes below. You can also use the search bar to filter for changes that have your search term.
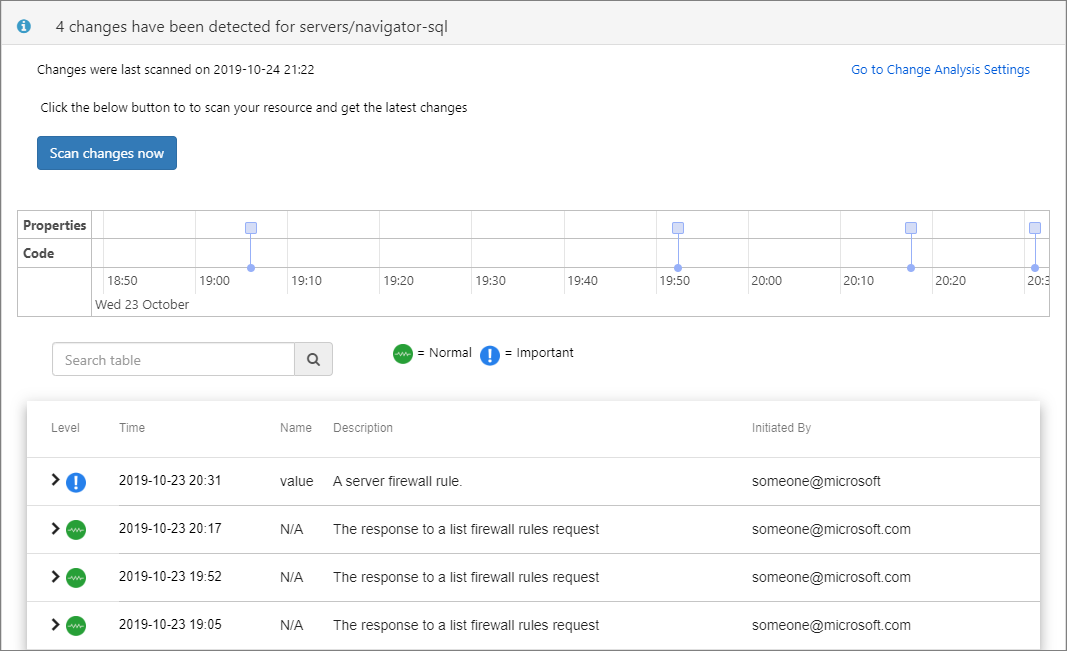
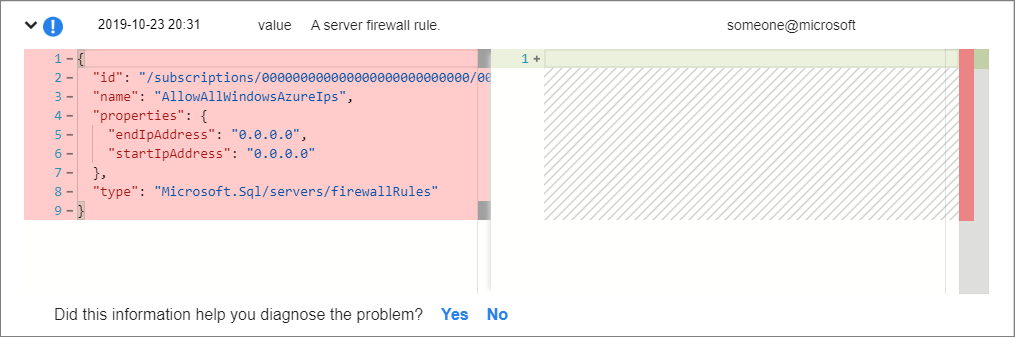
You can also expand each row of change to view the difference between the old values and the new values.
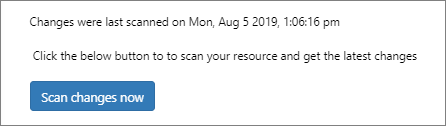
Above the timeline is the last scanned time stamp that shows the last time the timeline was updated. If you wish to find out about changes made after the last scanned time, click Scan changes now. (This process may take few minutes)
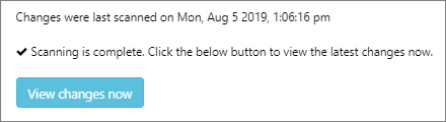
After scanning is complete, you can update the timeline by clicking on View changes now.
Navigator in Practice
Now, let’s explore a scenario where Navigator can come in handy. Suppose you have noticed a spike in the database connection errors in your app caused by a firewall rule, but you do not know what has caused the issue. First, click on Navigator in App Service Diagnostics. Take a look at the dependency map. Select a resource to explore the changes made to the resource. Browse through the timeline to see if there were any changes made before you observed unexpected behavior. If you do not find any changes on the timeline that could be related to the issue, click Scan changes now to update the timeline with the most recent changes. After the scanning completes, click View changes now to populate the timeline with the new changes. You notice there is one change that occurred right before the app started giving you database connection errors. Expand the new change to view the differences. You may find that you accidentally changed the firewall rules.
Used in tandem with other information from App Service Diagnostics, Navigator can serve as a powerful tool for diagnosing and solving problems with your web app.
Feel free to share your feedback or questions about Navigator by emailing diagnostics@microsoft.com