Announcing the New App Service Diagnostics Experience
Jennifer Lee (MSFT)
Today, we’re excited to announce our new user experience for App Service Diagnostics. App Service Diagnostics is our intelligent and interactive experience to help you diagnose and troubleshoot issues with your app. You can use Genie to guide you through the different ways to troubleshoot a variety of potential issues, since sometimes bad things happen to good apps. You can learn more about App Service Diagnostics in these other blog posts.
Since we’ve first started with helping you with availability and performance issues, the coverage of issues that App Service Diagnostics has grown. To accommodate for a variety of problem categories and to more closely integrate with other troubleshooting content, we have revamped the user experience for App Service Diagnostics.
 If you’re new to diagnosing issues with your app or new to App Service, it’s a good idea to click around these tiles to investigate your issue.
The health checkup from our old experience will be under Availability and Performance.
If you’re new to diagnosing issues with your app or new to App Service, it’s a good idea to click around these tiles to investigate your issue.
The health checkup from our old experience will be under Availability and Performance.
 The blue buttons that show up are tiles; you should select those that best match your issue. These tiles run analyses on our end and output insights that show up within Genie. You should click on these insights to get more data, the full report, and actual suggestions on what to do next.
 Insights are arranged in terms of severity:
 At any time, select Show Tile Menu to show all the tiles for that problem category.
 As before, App Service Diagnostics is a great first step in guiding you through the troubleshooting experience on App Service, App Service Environment, or Azure Functions. Please try out the new experience and let us know about your feedback!

How to Get Started
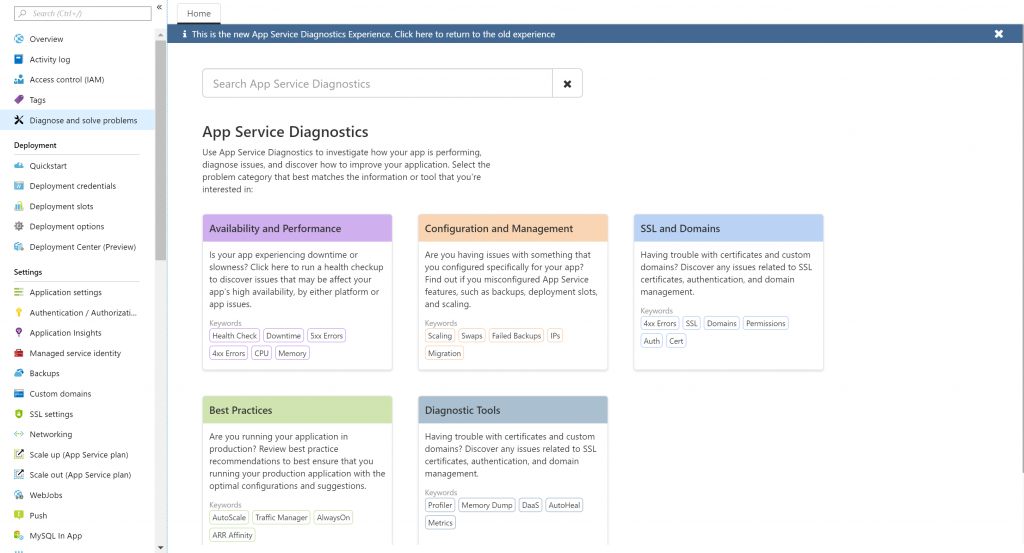
As always, without any additional configuration, you can access App Service Diagonstics by:- Go to the Azure Portal.
- Select your app (Windows, Linux, or Functions) or App Service Environment.
- Click on “Diagnose and solve problems."
Problem Categories
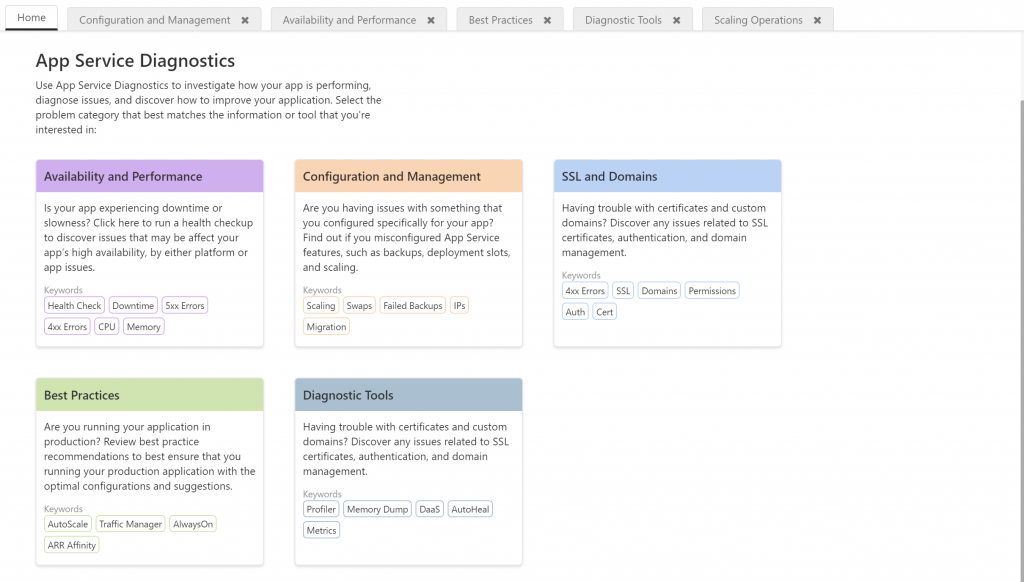
In the new App Service Diagnostics homepage, the guided diagnostics experience is now separated into different problem categories to help you be more focused on the specific issue that you’re facing. Each problem category will have a description and keywords to help describe what types of problems would fall underneath that category.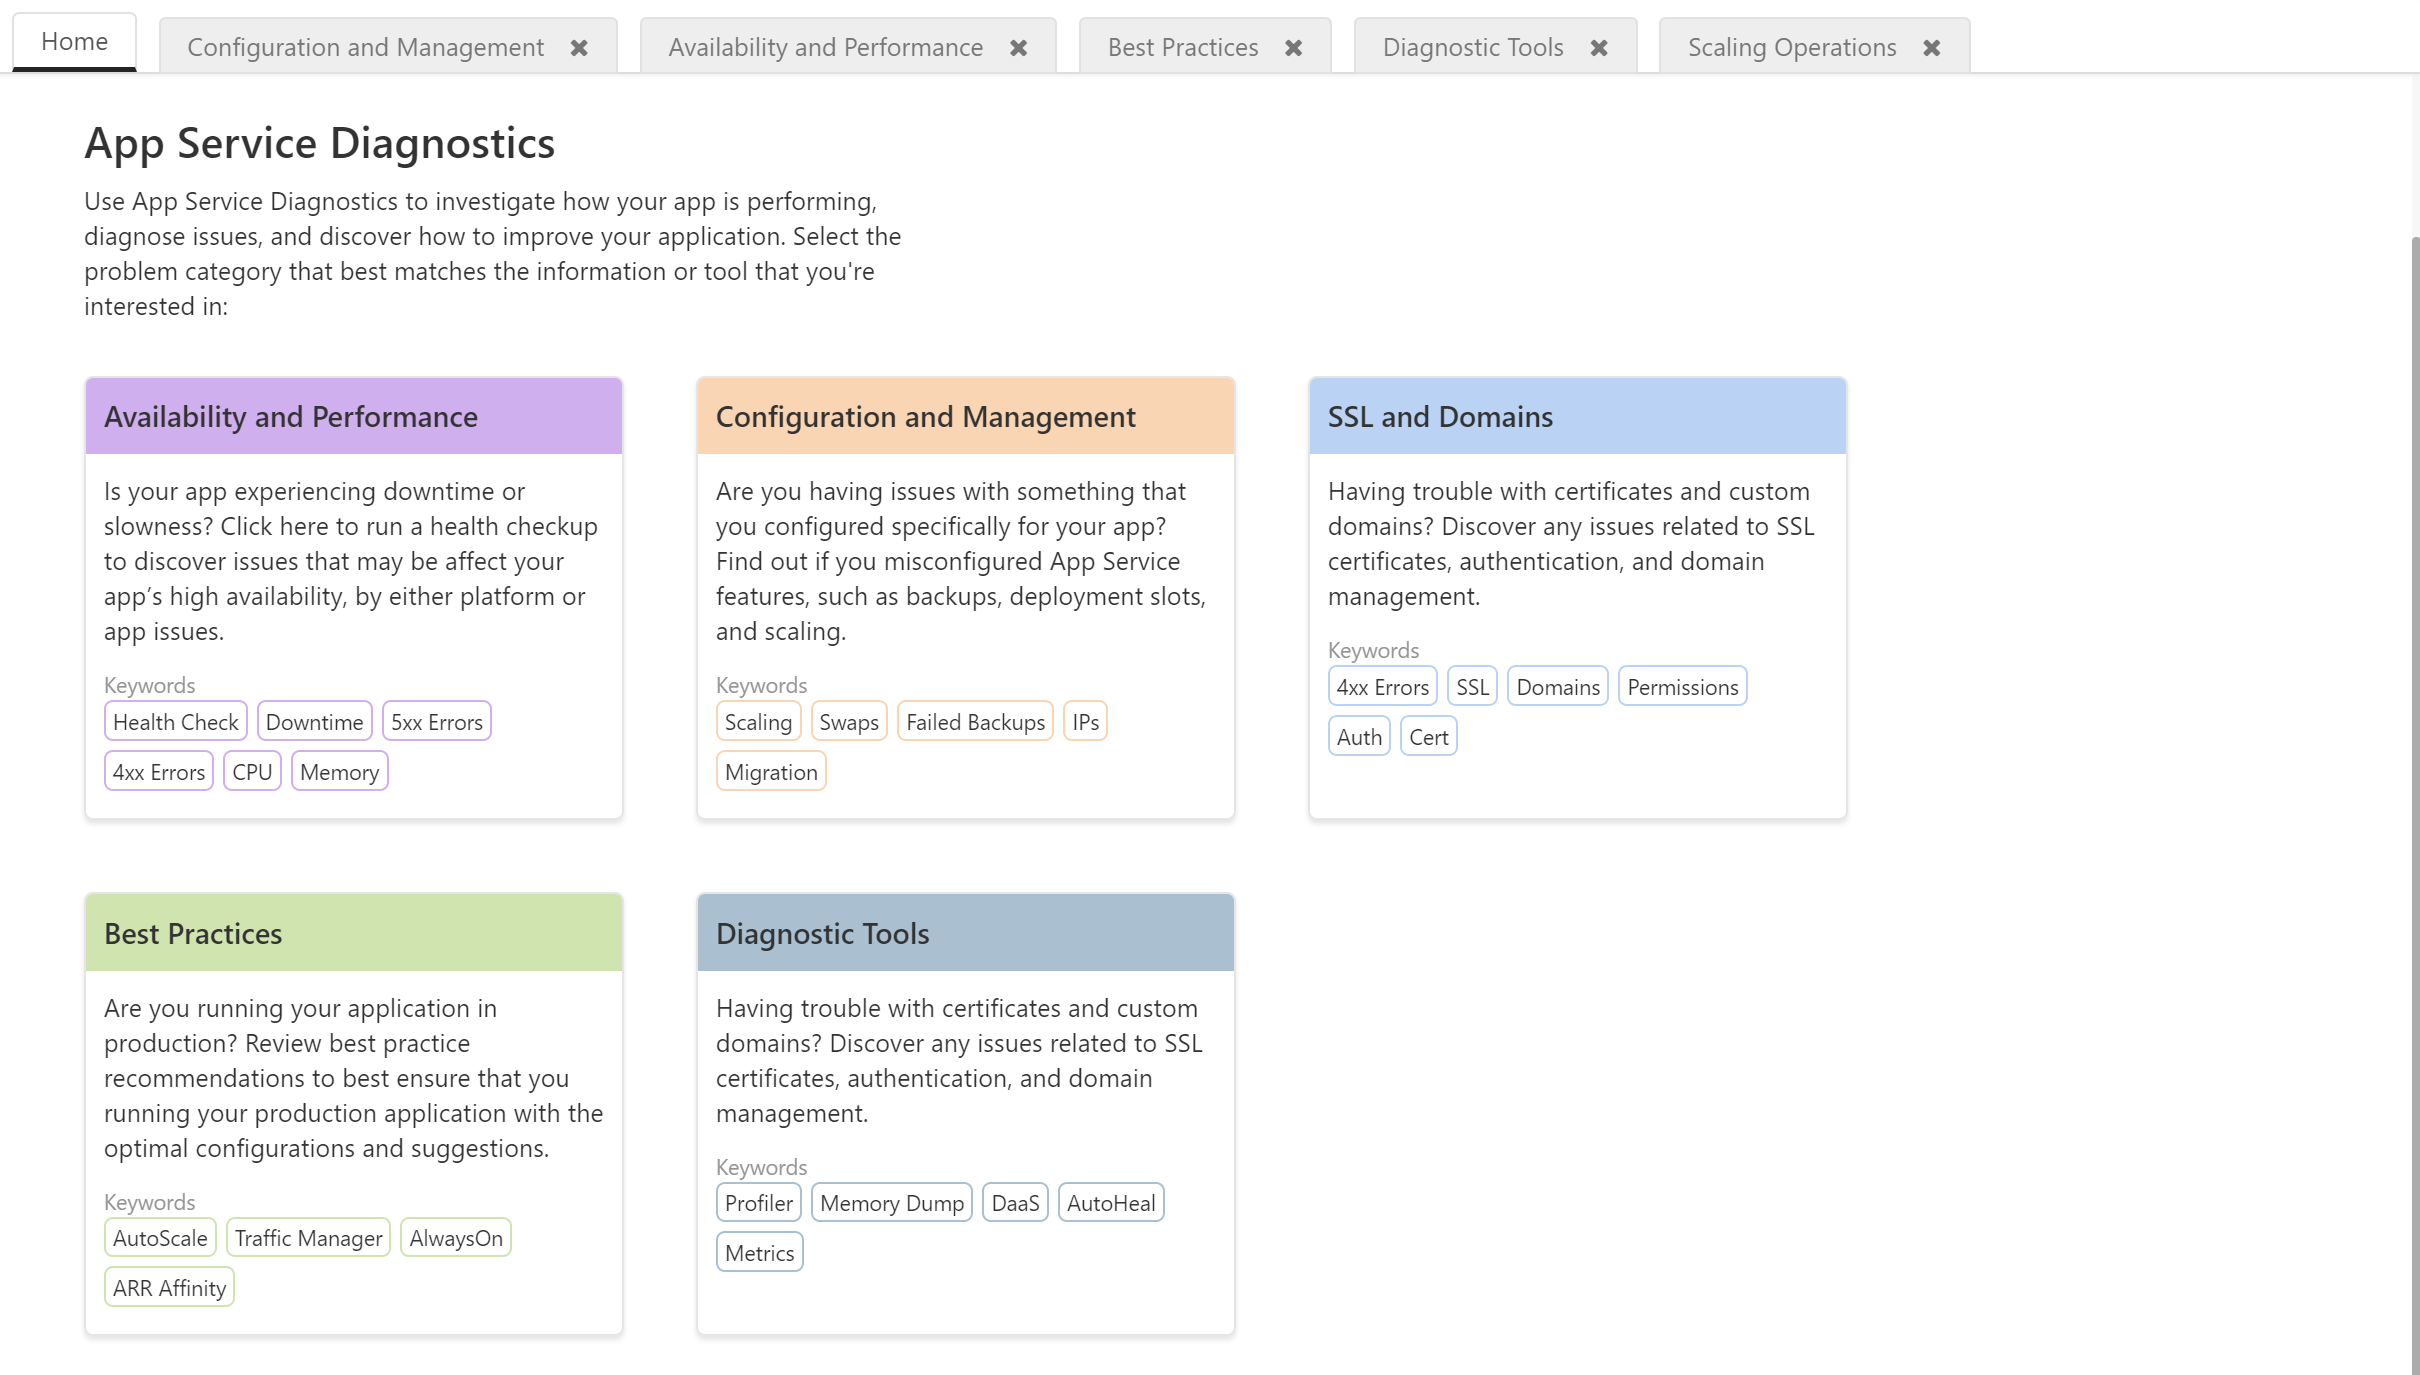 If you’re new to diagnosing issues with your app or new to App Service, it’s a good idea to click around these tiles to investigate your issue.
The health checkup from our old experience will be under Availability and Performance.
If you’re new to diagnosing issues with your app or new to App Service, it’s a good idea to click around these tiles to investigate your issue.
The health checkup from our old experience will be under Availability and Performance.

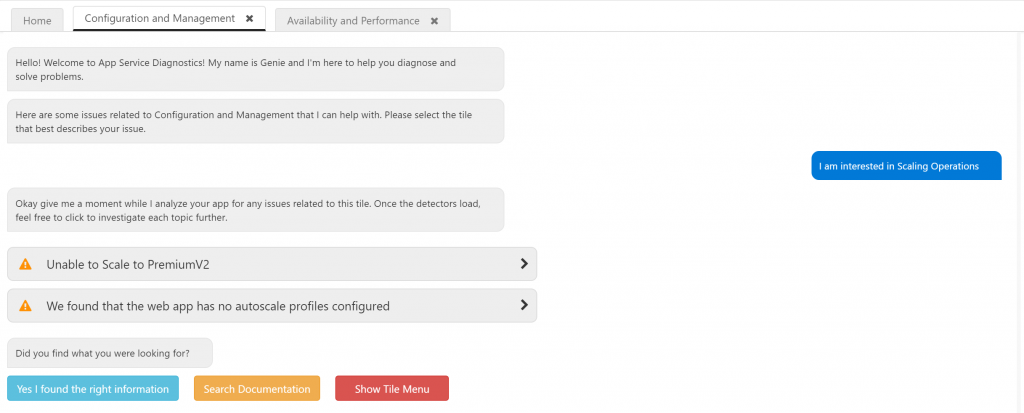
Genie and Tiles for Each Problem Category
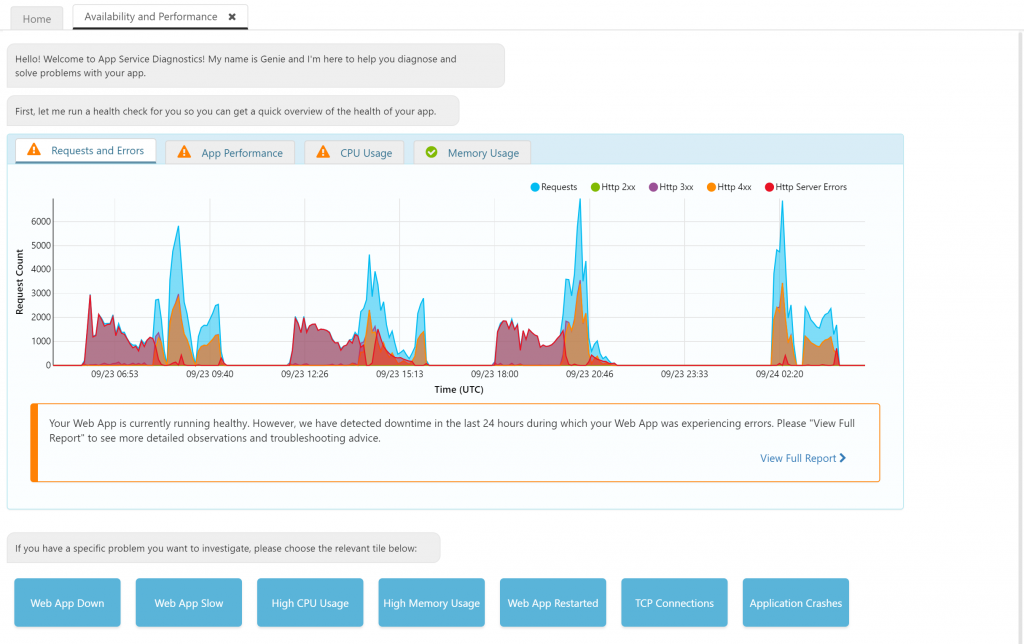
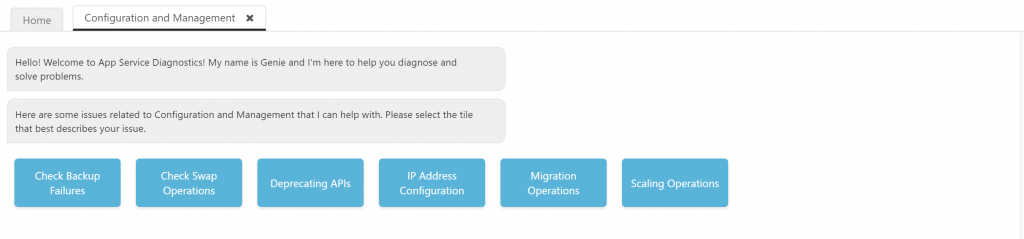
Once you have selected a problem category, you are introduced to Genie, who will guide you through the troubleshooting experience for that category. In this new iteration, Genie is specific to the problem category that you’ve selected.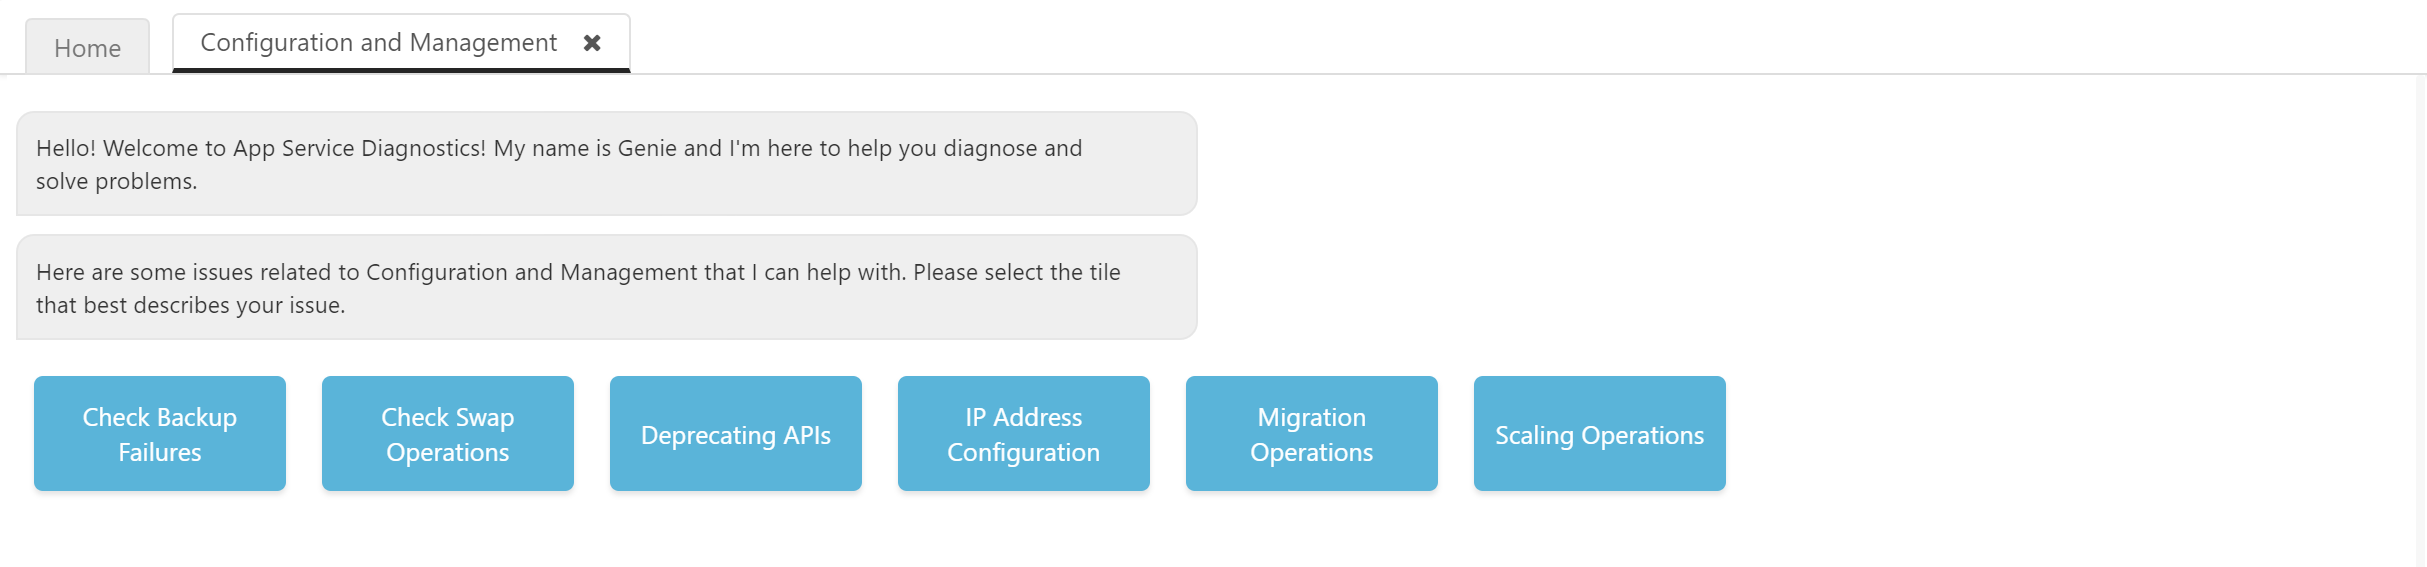 The blue buttons that show up are tiles; you should select those that best match your issue. These tiles run analyses on our end and output insights that show up within Genie. You should click on these insights to get more data, the full report, and actual suggestions on what to do next.
 Insights are arranged in terms of severity:
- Red: critical
- Orange: warning
- Green: success
- Blue: informational
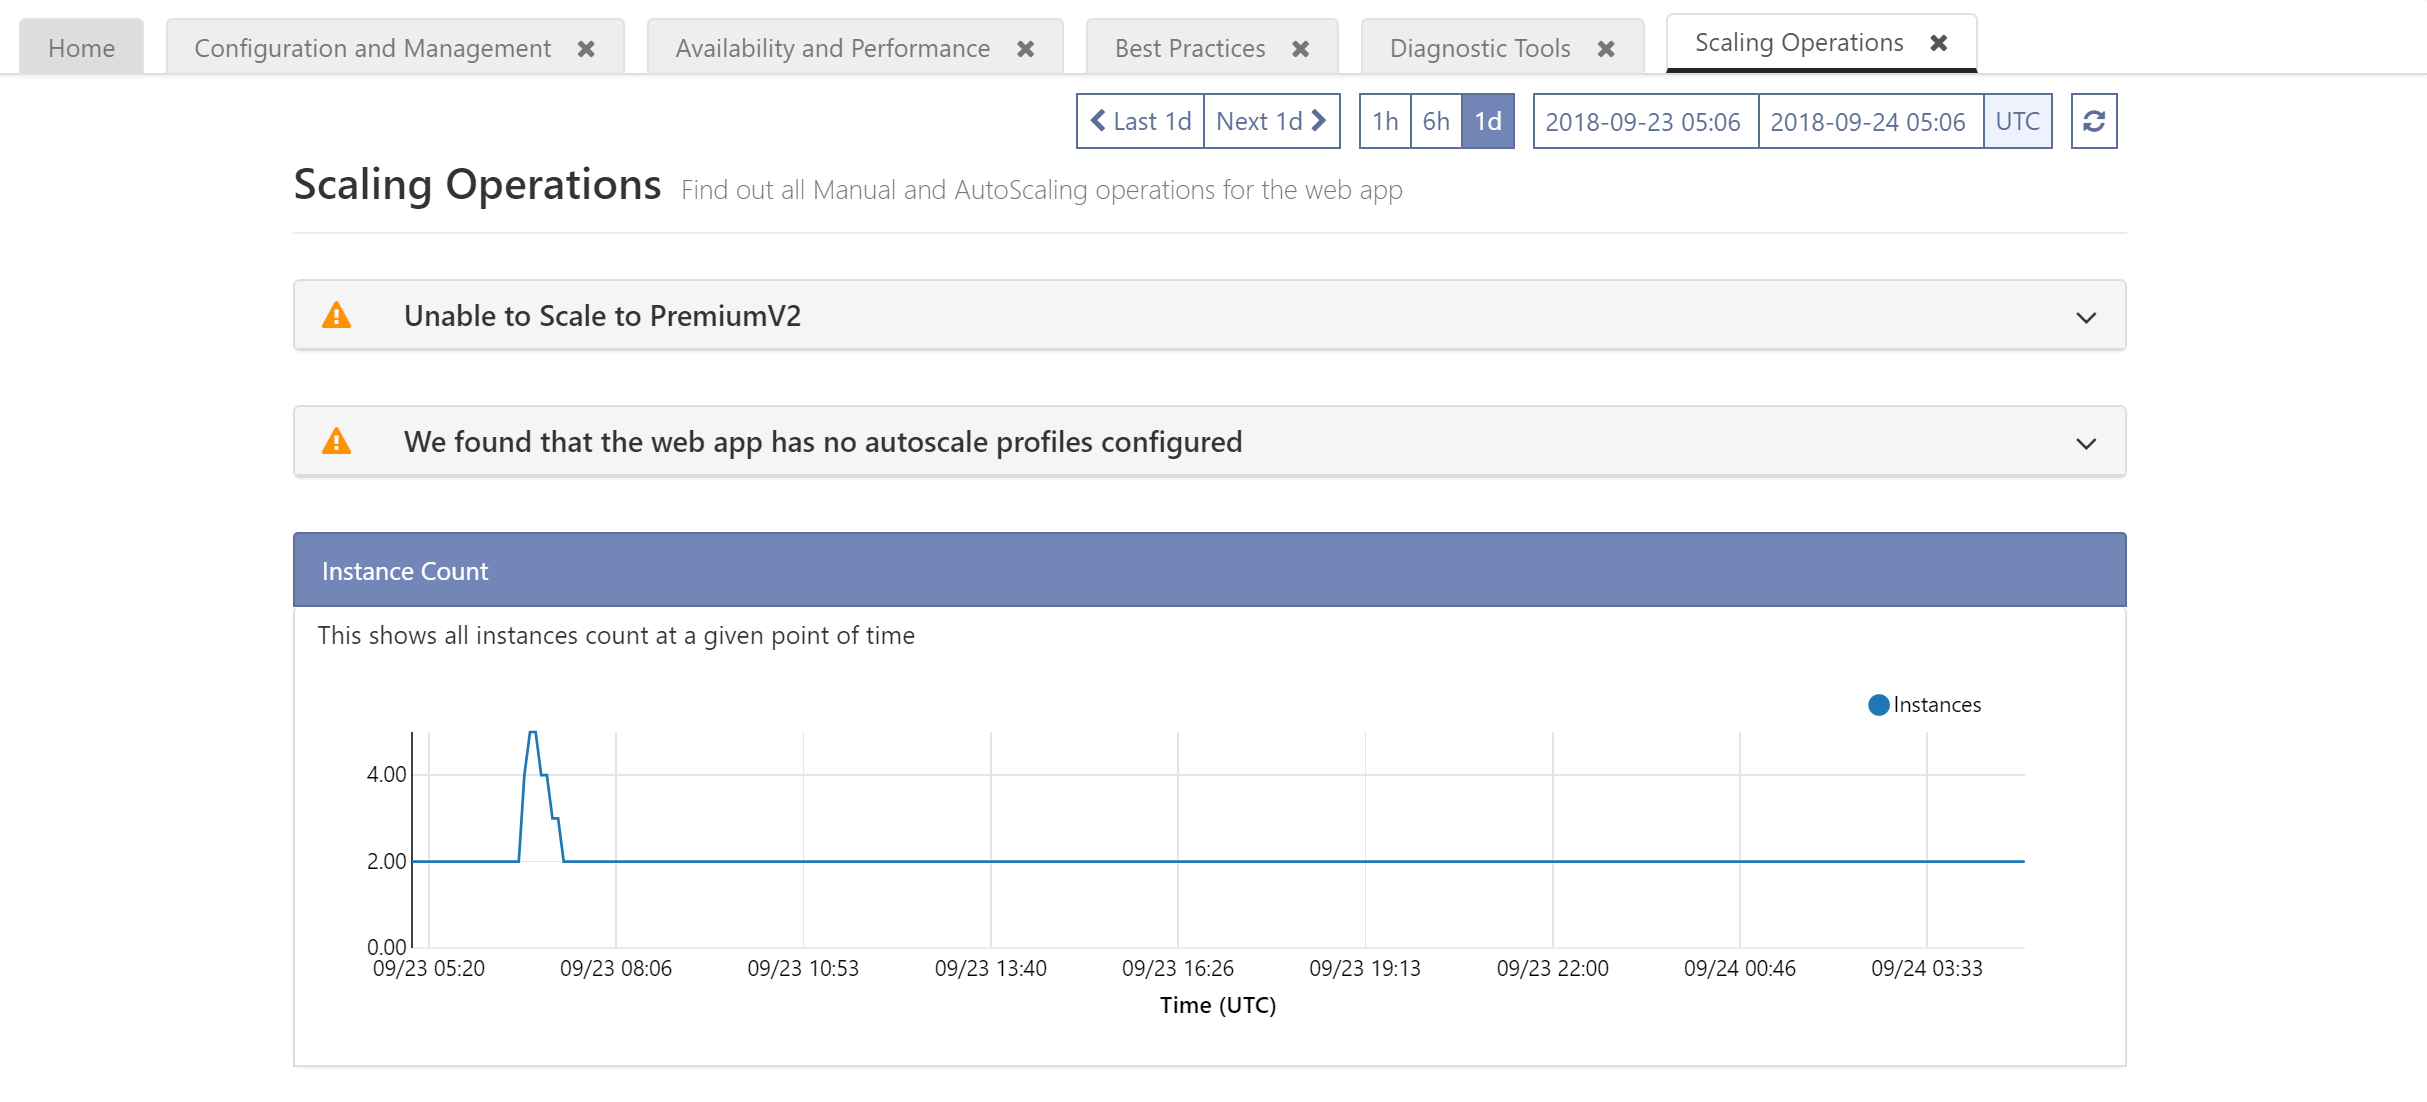 At any time, select Show Tile Menu to show all the tiles for that problem category.
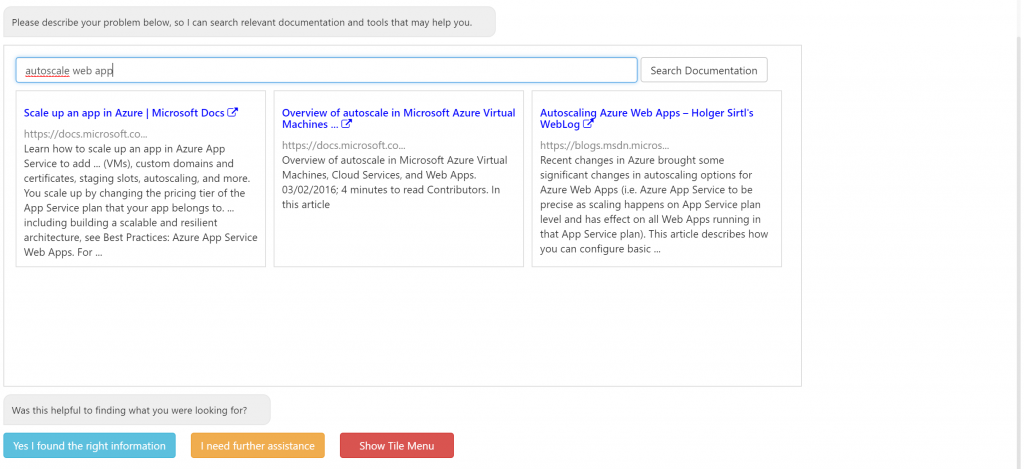
Search Documentation
Also new to Genie’s flow is our Search Documentation. If the tiles weren’t of help, you can enter in your issue in the inline search bar that appears after you select Search Documentation. This will do a web search of the issue you’ve written about to find relevant content that might help you with your “how do I…?” questions. It brings up the most relevant results if you include “App Service” or “web app” in your search terms.
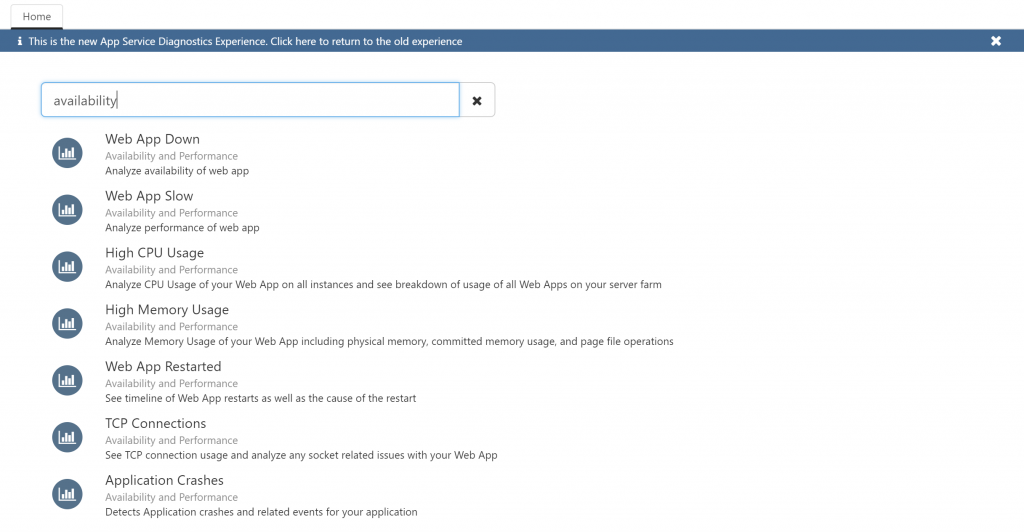
Search App Service Diagnostics
Now, in the new App Service Diagnostics home page, we have a search bar in the top left-hand corner. This search bar allows you to search within App Service Diagnostics to find the relevant tiles or tools that fit the search term. Therefore, the search bar is great when you are more experienced with App Service Diagnostics and know specifically what problem category, tile, or diagnostic tool you’re looking for. You can just type in the search term and quickly get to the tile that you’re interested in, which is great when showing your troubleshooting methods to other members on your team.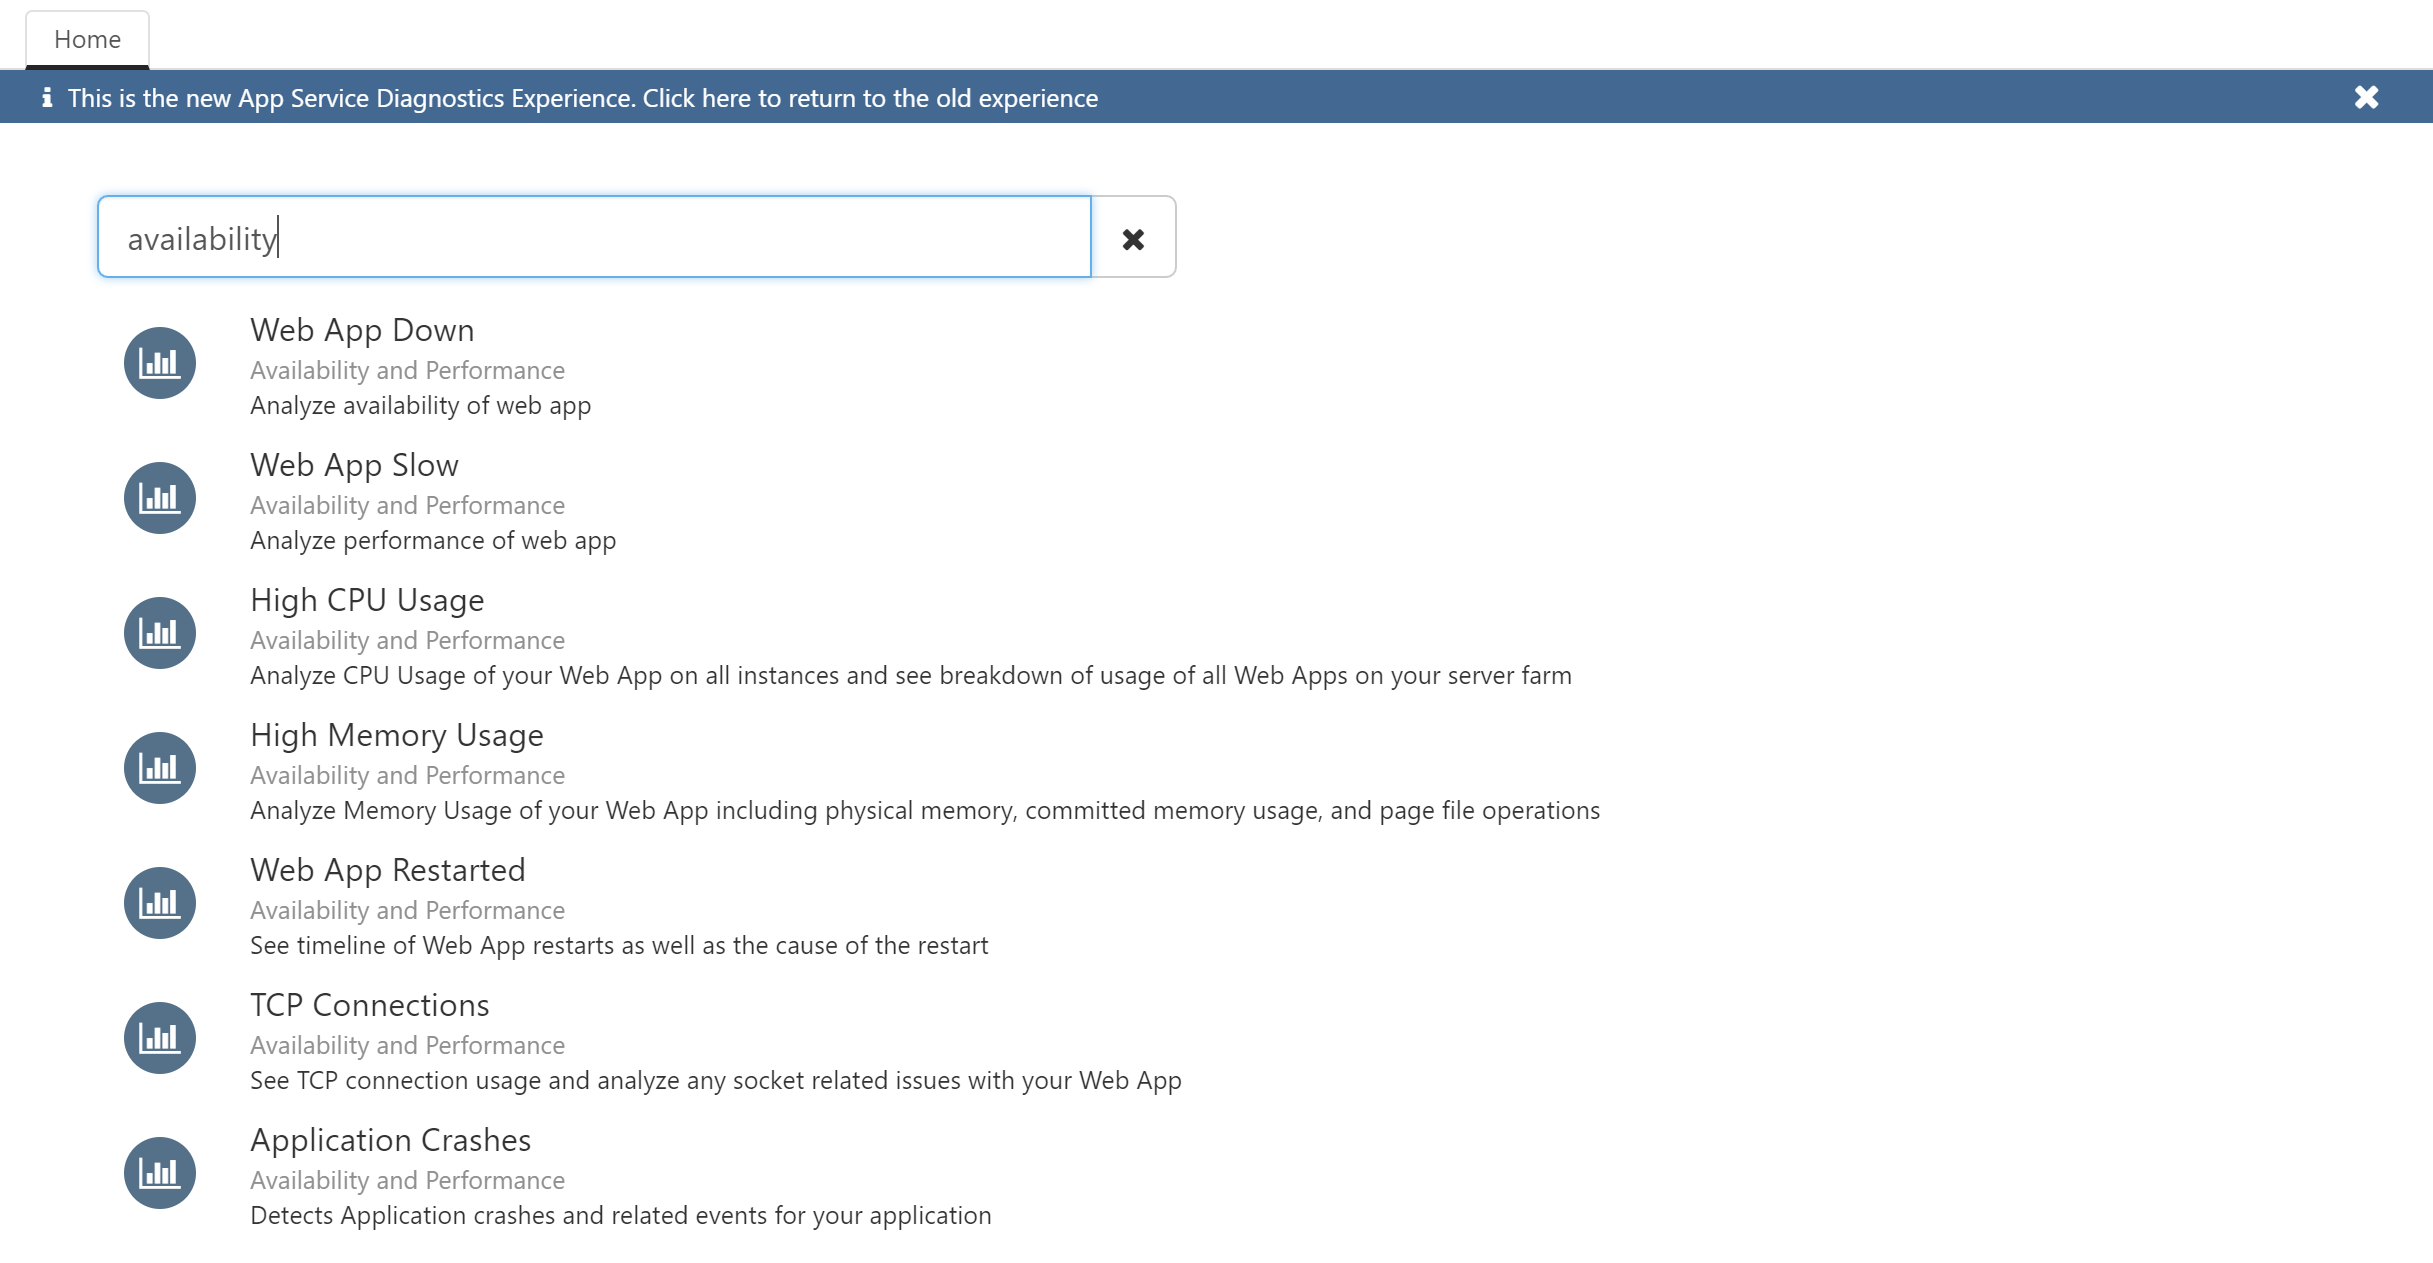
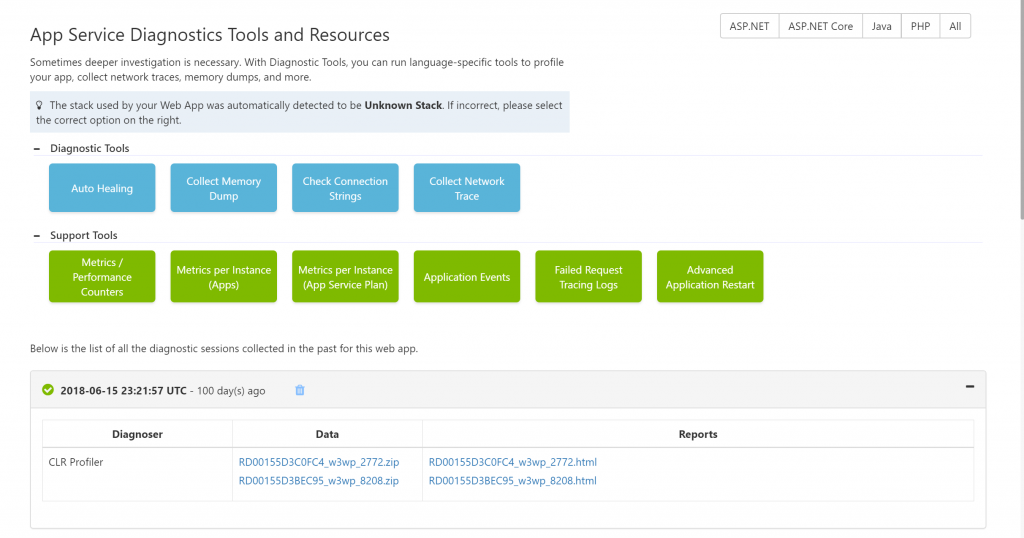
Diagnostic Tools
The Diagnostic Tools problem category is where our advanced tools are now. These include all the Support Tools that were on the right-hand side of the page as well our new Auto Healing feature. This is a great option for our advanced users who want to collect a profiler trace, memory dump, network trace, and more.
Best Practices
The Best Practices problem category is where our suggestions for running production apps in the cloud are. These suggestions are app-specific recommendations for optimizing your app configurations for production.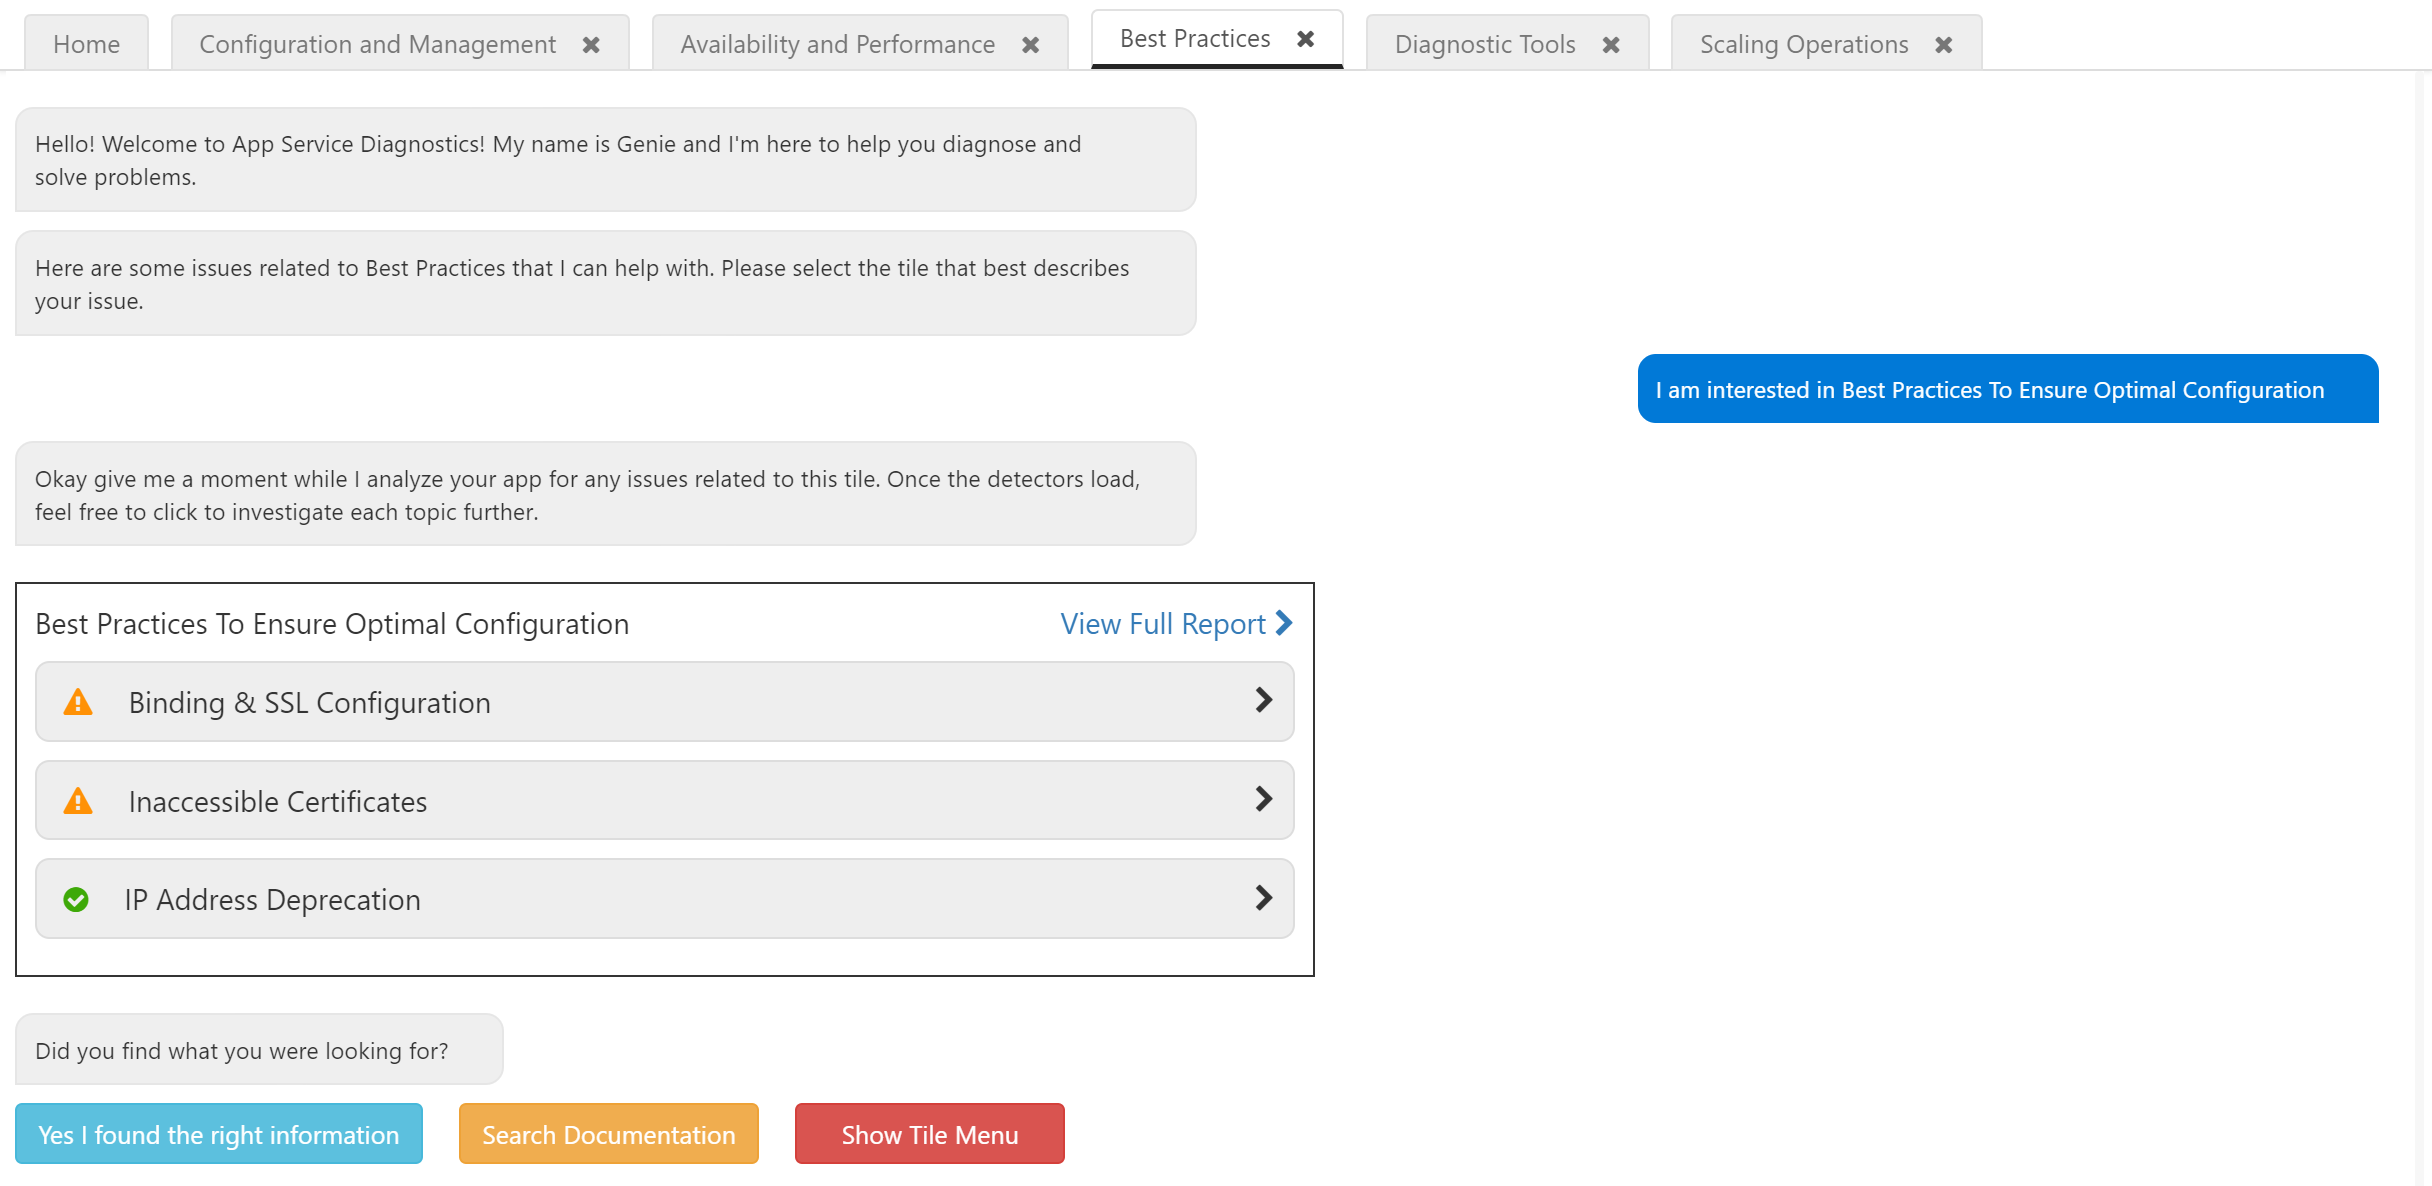 As before, App Service Diagnostics is a great first step in guiding you through the troubleshooting experience on App Service, App Service Environment, or Azure Functions. Please try out the new experience and let us know about your feedback!