⭐Creating an evaluation and reviewing evaluation results
One of the most important and subtle parts of anomaly detection happens at the intersection between predicting how a metric should behave and comparing observed values to those expectations. In this chapter, test the quality of a trained model and visually inspect the detected anomalies by creating an evaluation.
:warning:Note that the results from evaluation are retained for 30 days before removal.
For example, if you create an evaluation at 5/25/2022 12:15 PM, this evaluation result will be retained for 30 days before it expires on 6/24/2022 at 12:15 PM.
1. Before evaluating
After a model is trained; Metrics Advisor for Equipment evaluates its performance on a subset of the dataset that you've specified for evaluation purposes. It displays results that provide an overview of the performance and detailed information about the abnormal equipment behavior events and how well the model performed when detecting those.
:white_check_mark:The data being used to evaluate the model: This evaluation data set should have the same schema and data granularity as the training data set for the model.
:white_check_mark:Labels for evaluating the model: Metrics Advisor for Equipment identifies patterns in the dataset that help to detect critical issues, but it's the responsibility of a technician or subject matter expert (SME) to have a label to diagnose the problem and take corrective action, if needed.
2. Create an evaluation
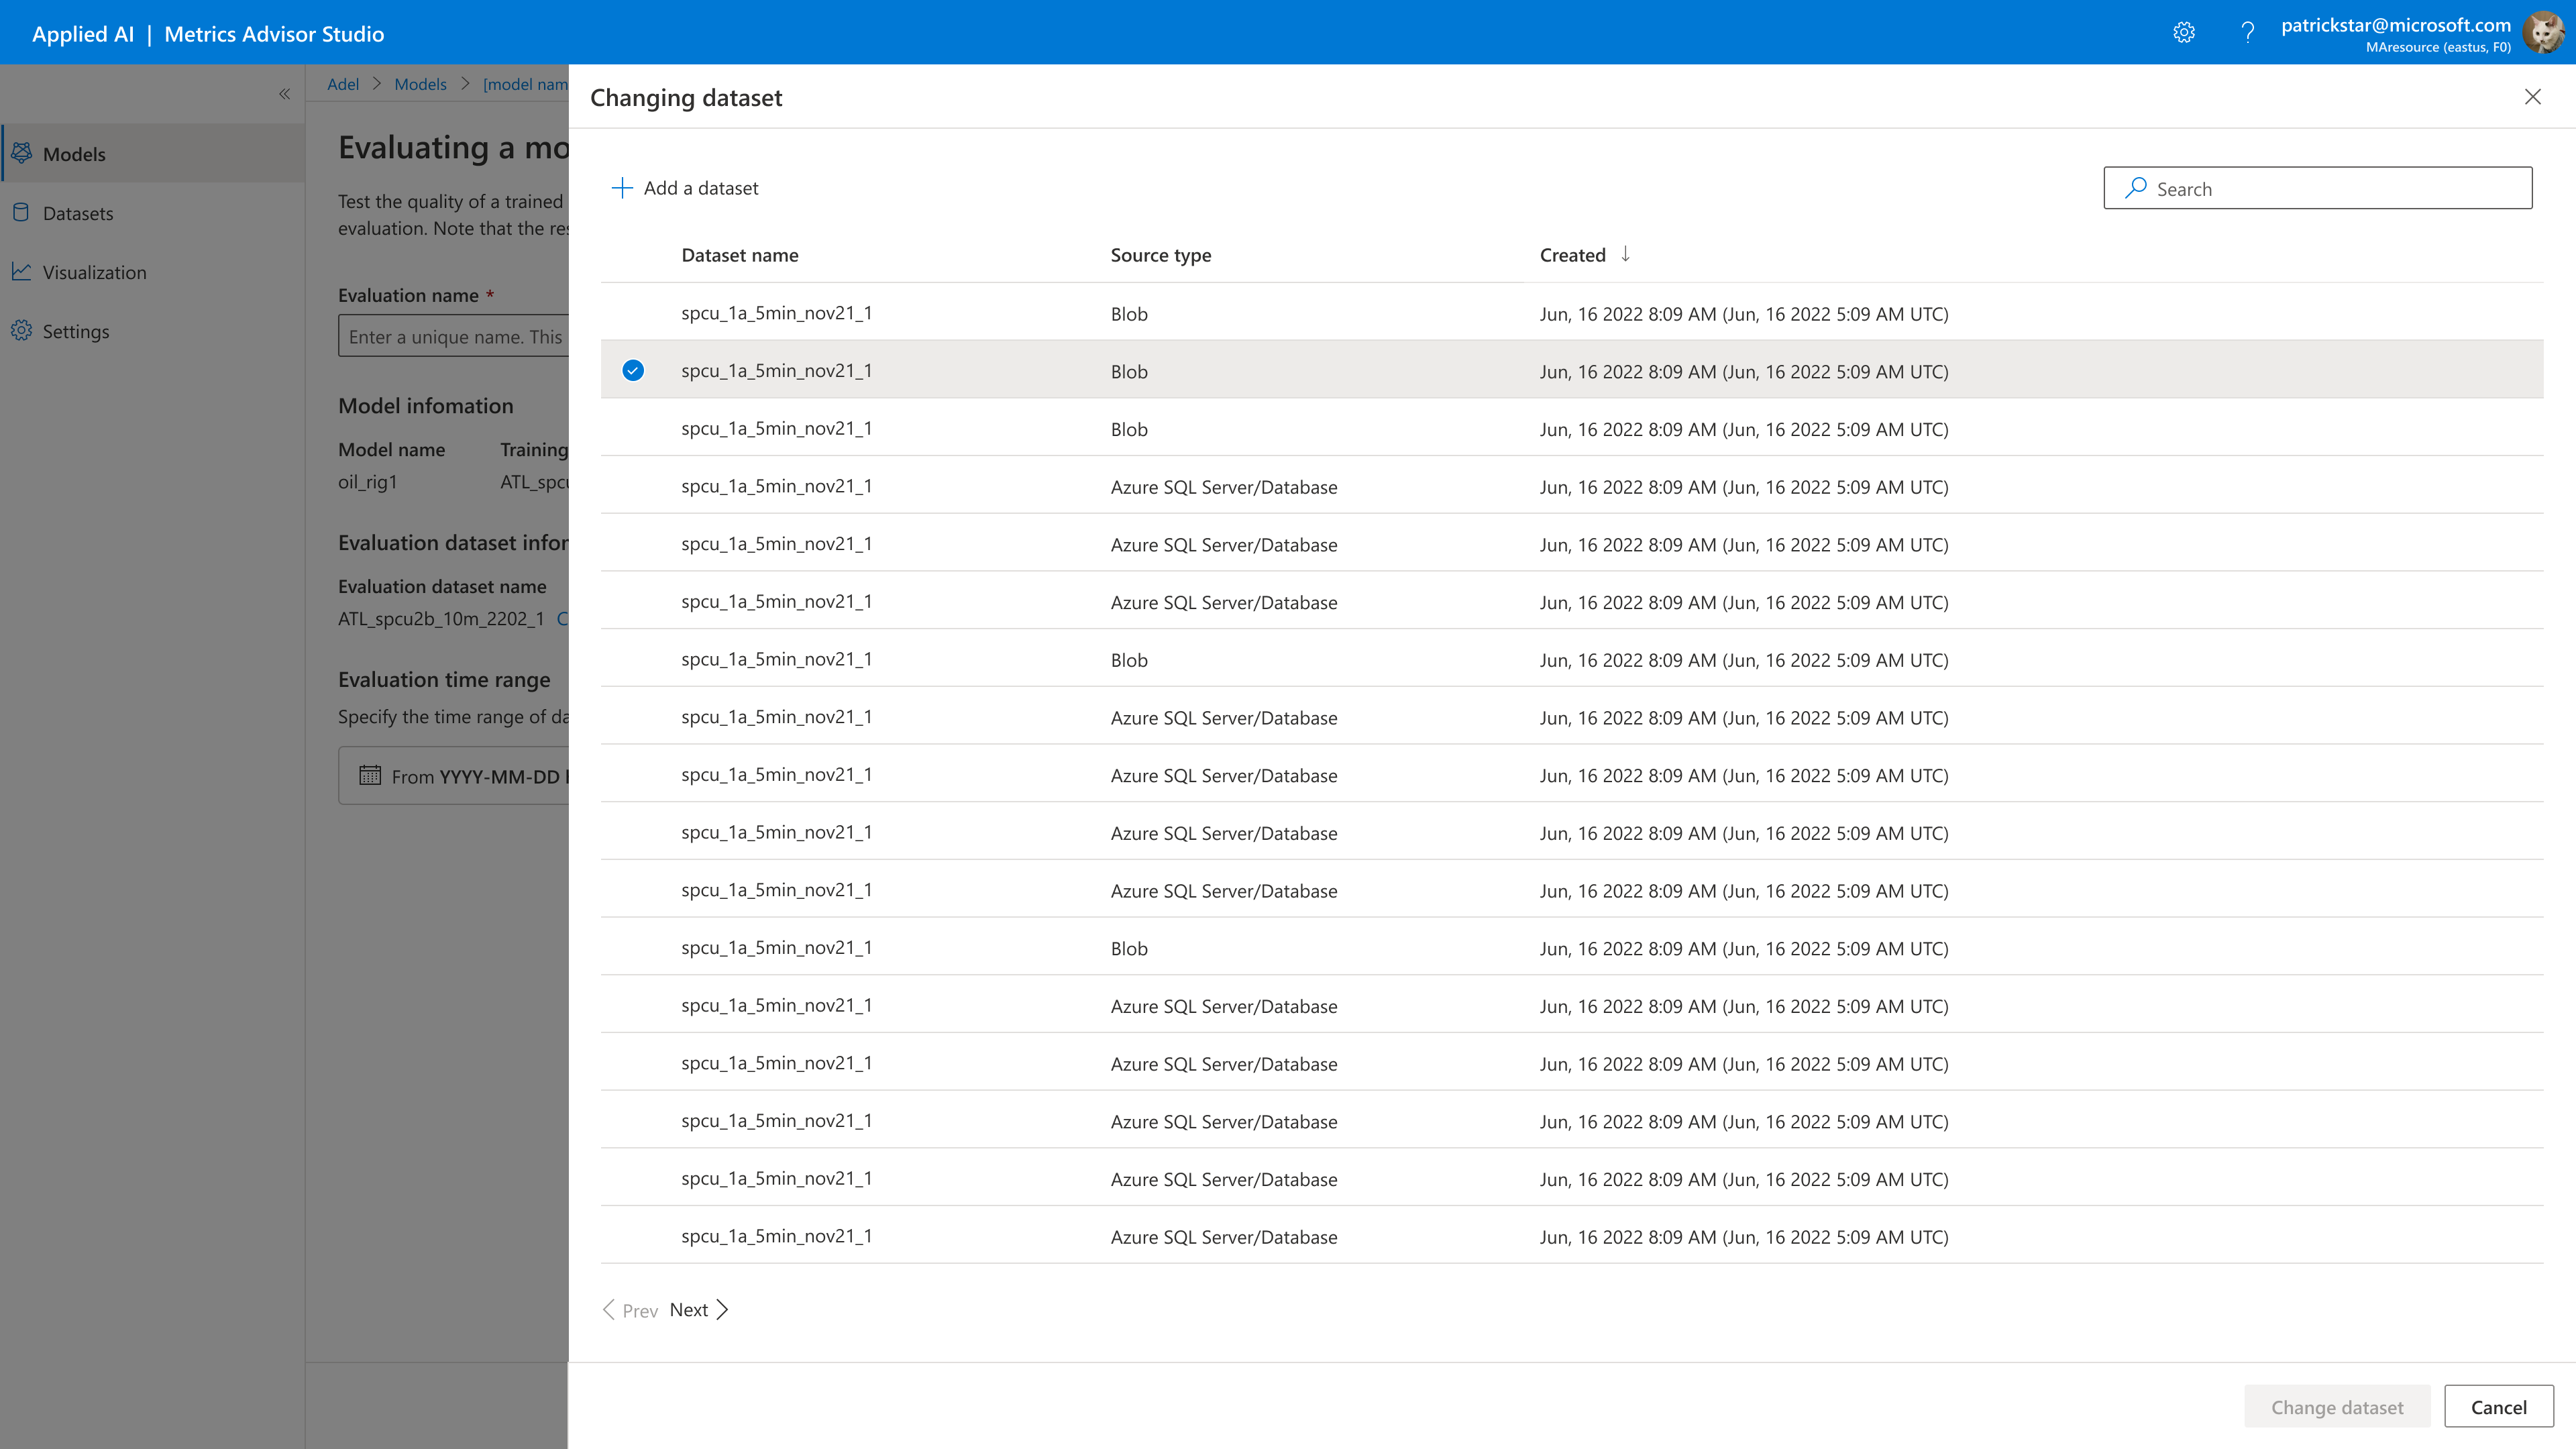
If you've used part of your dataset for training and the other part for evaluation, you can start to evaluate the model's performance after finishing the training. You can also select a different dataset for model evaluations.
You can use the following procedure and example code to view the models you've created. They also show you how to get information about a model, such as how well it performed.
To view a model:
Go to Models, Choose a model and click the model name.
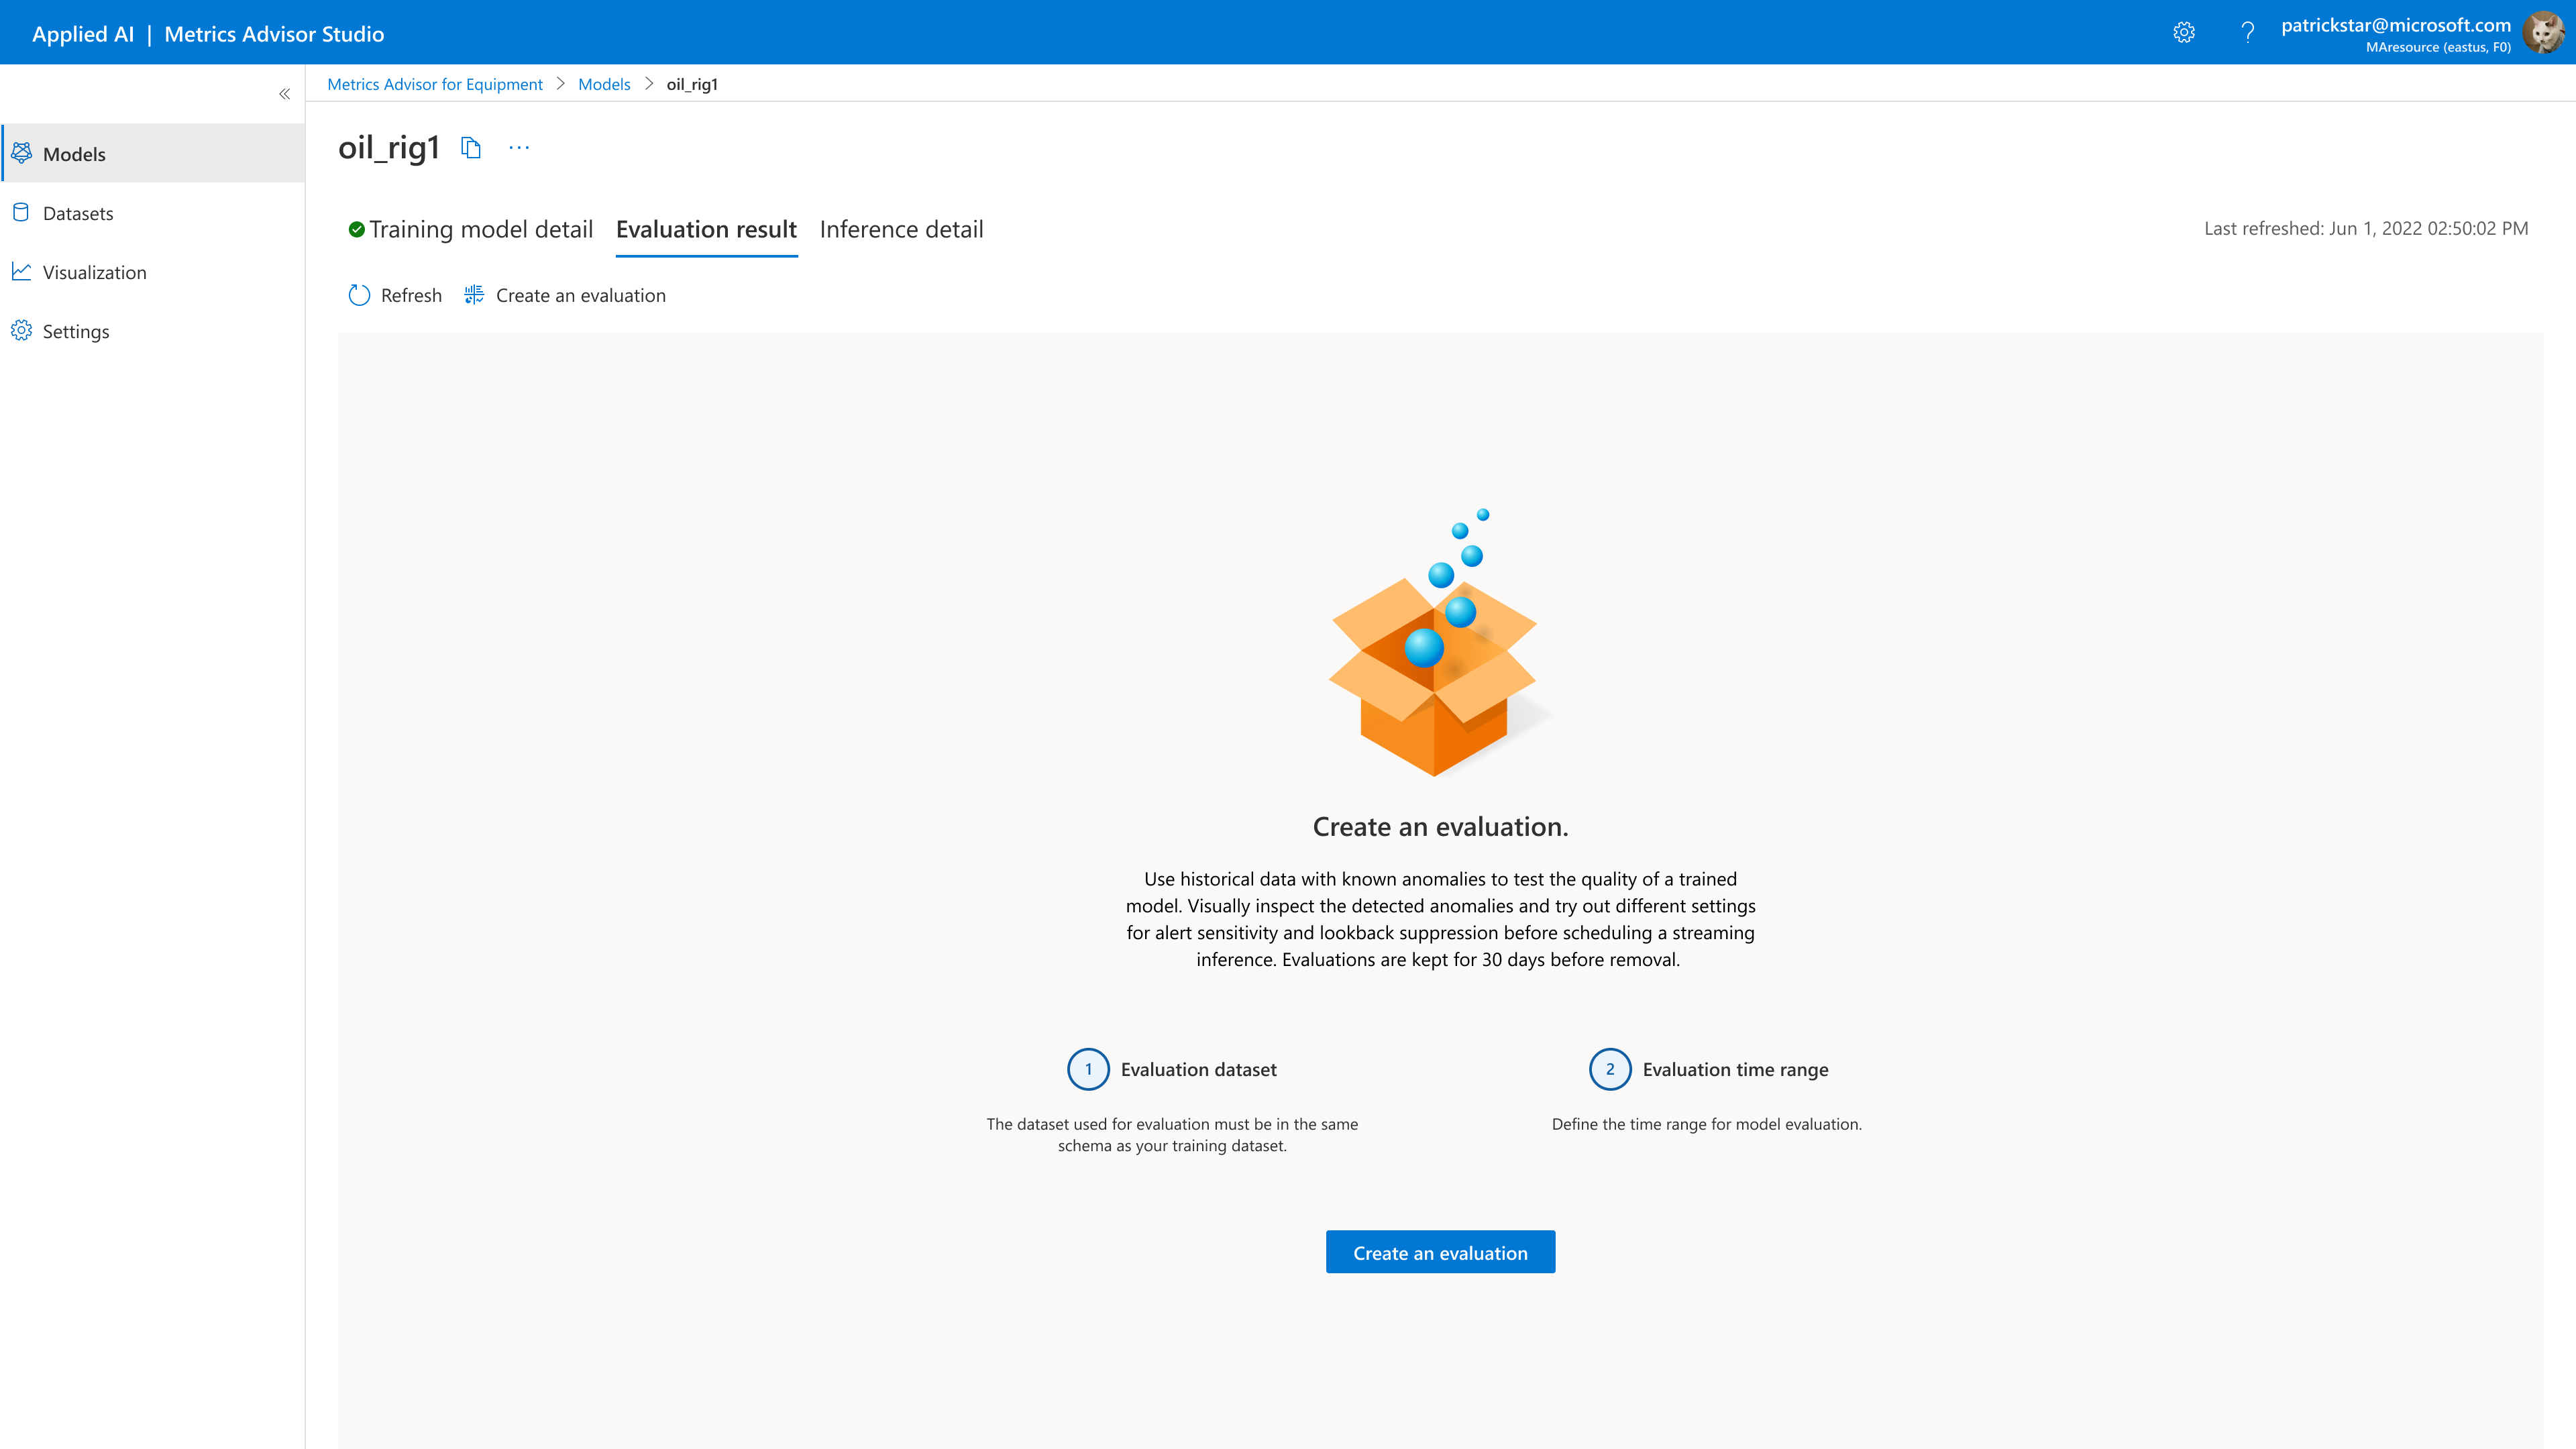
Navigate to the Model details page and choose create an evaluation.

3. Evaluation parameters
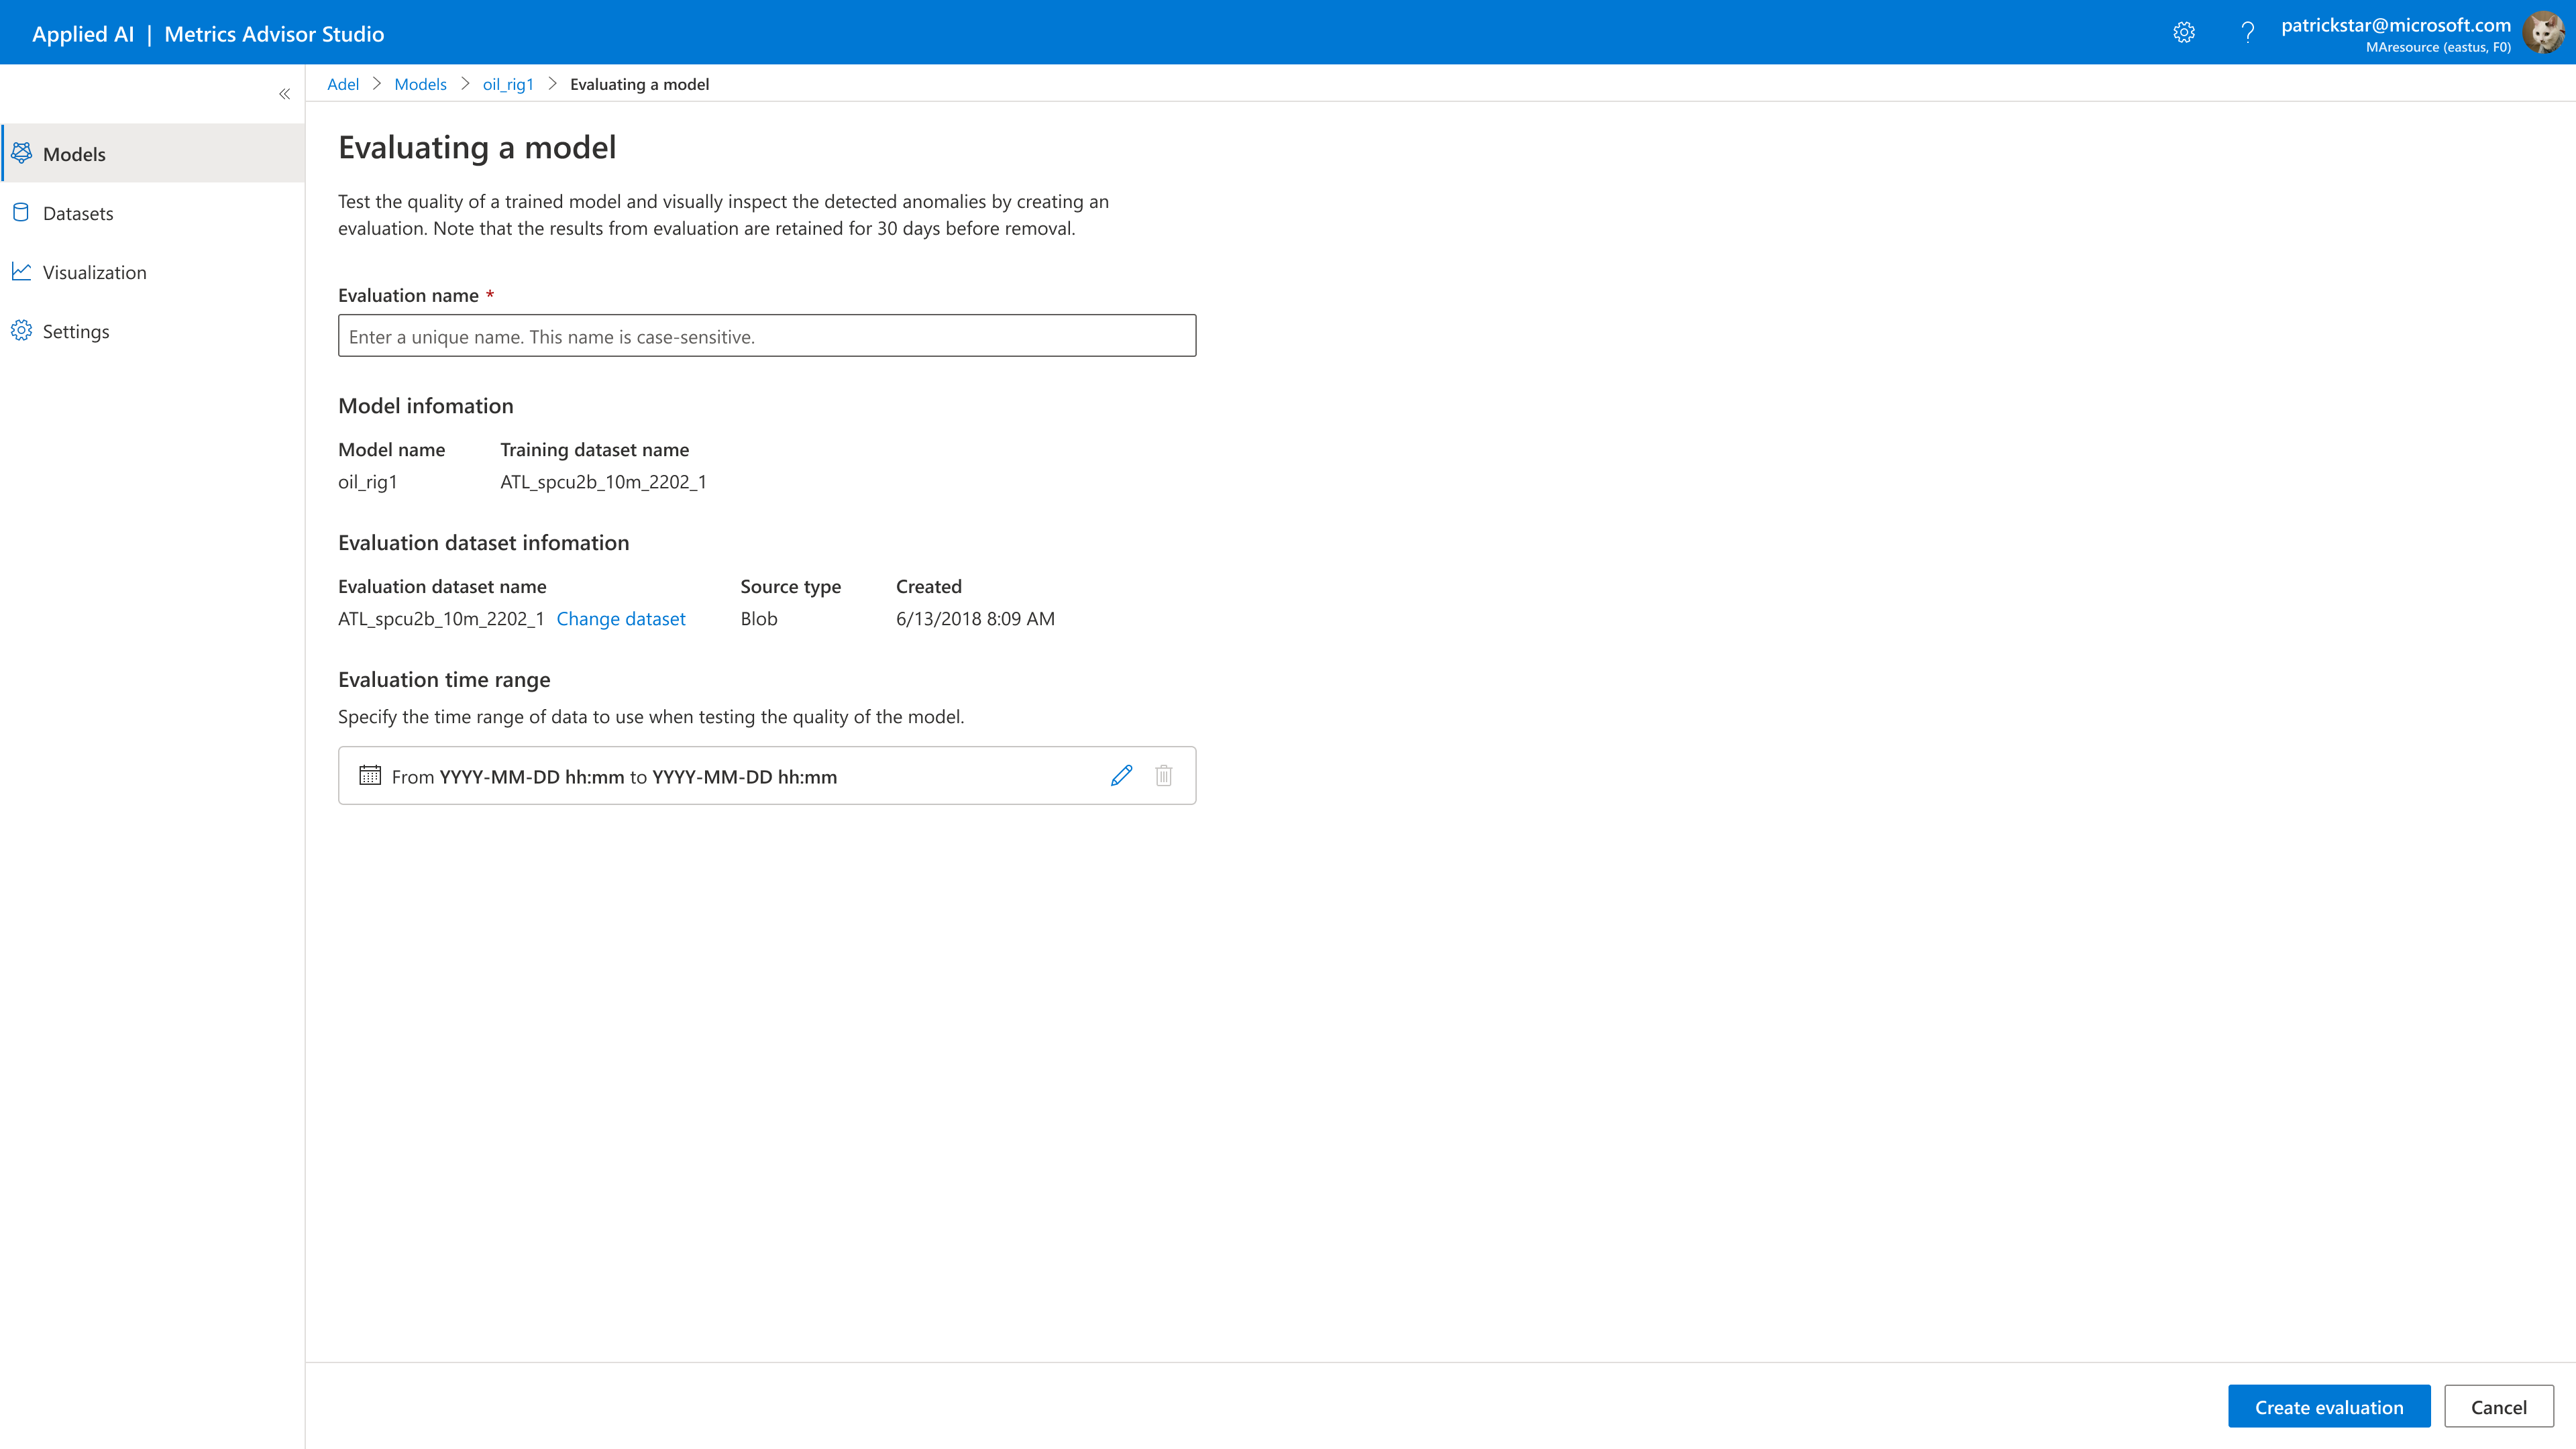
In the following image, you need to fill evaluation parameters:

You could also change your evaluation dataset.

4. Evaluation summary
Starting the evaluation process. Click the model name, then the Evaluation result tab gives you a chance to review evaluation details such as the evaluation name, the dataset, and evaluation time range.
On the evaluation results tab page you'll find your list of evaluations. Click Evaluation summary, you'll find details about the evaluation summaries.
There are three kinds of evaluation status.
| Status | Description |
|---|---|
| Running | Evaluation is in processing. |
| Completed | Evaluation is done, you can start inference. |
| Failed | Evaluation is failed for some reason. |
You can click the View details button for the error messages when you find the Evaluation status gets to Failed.
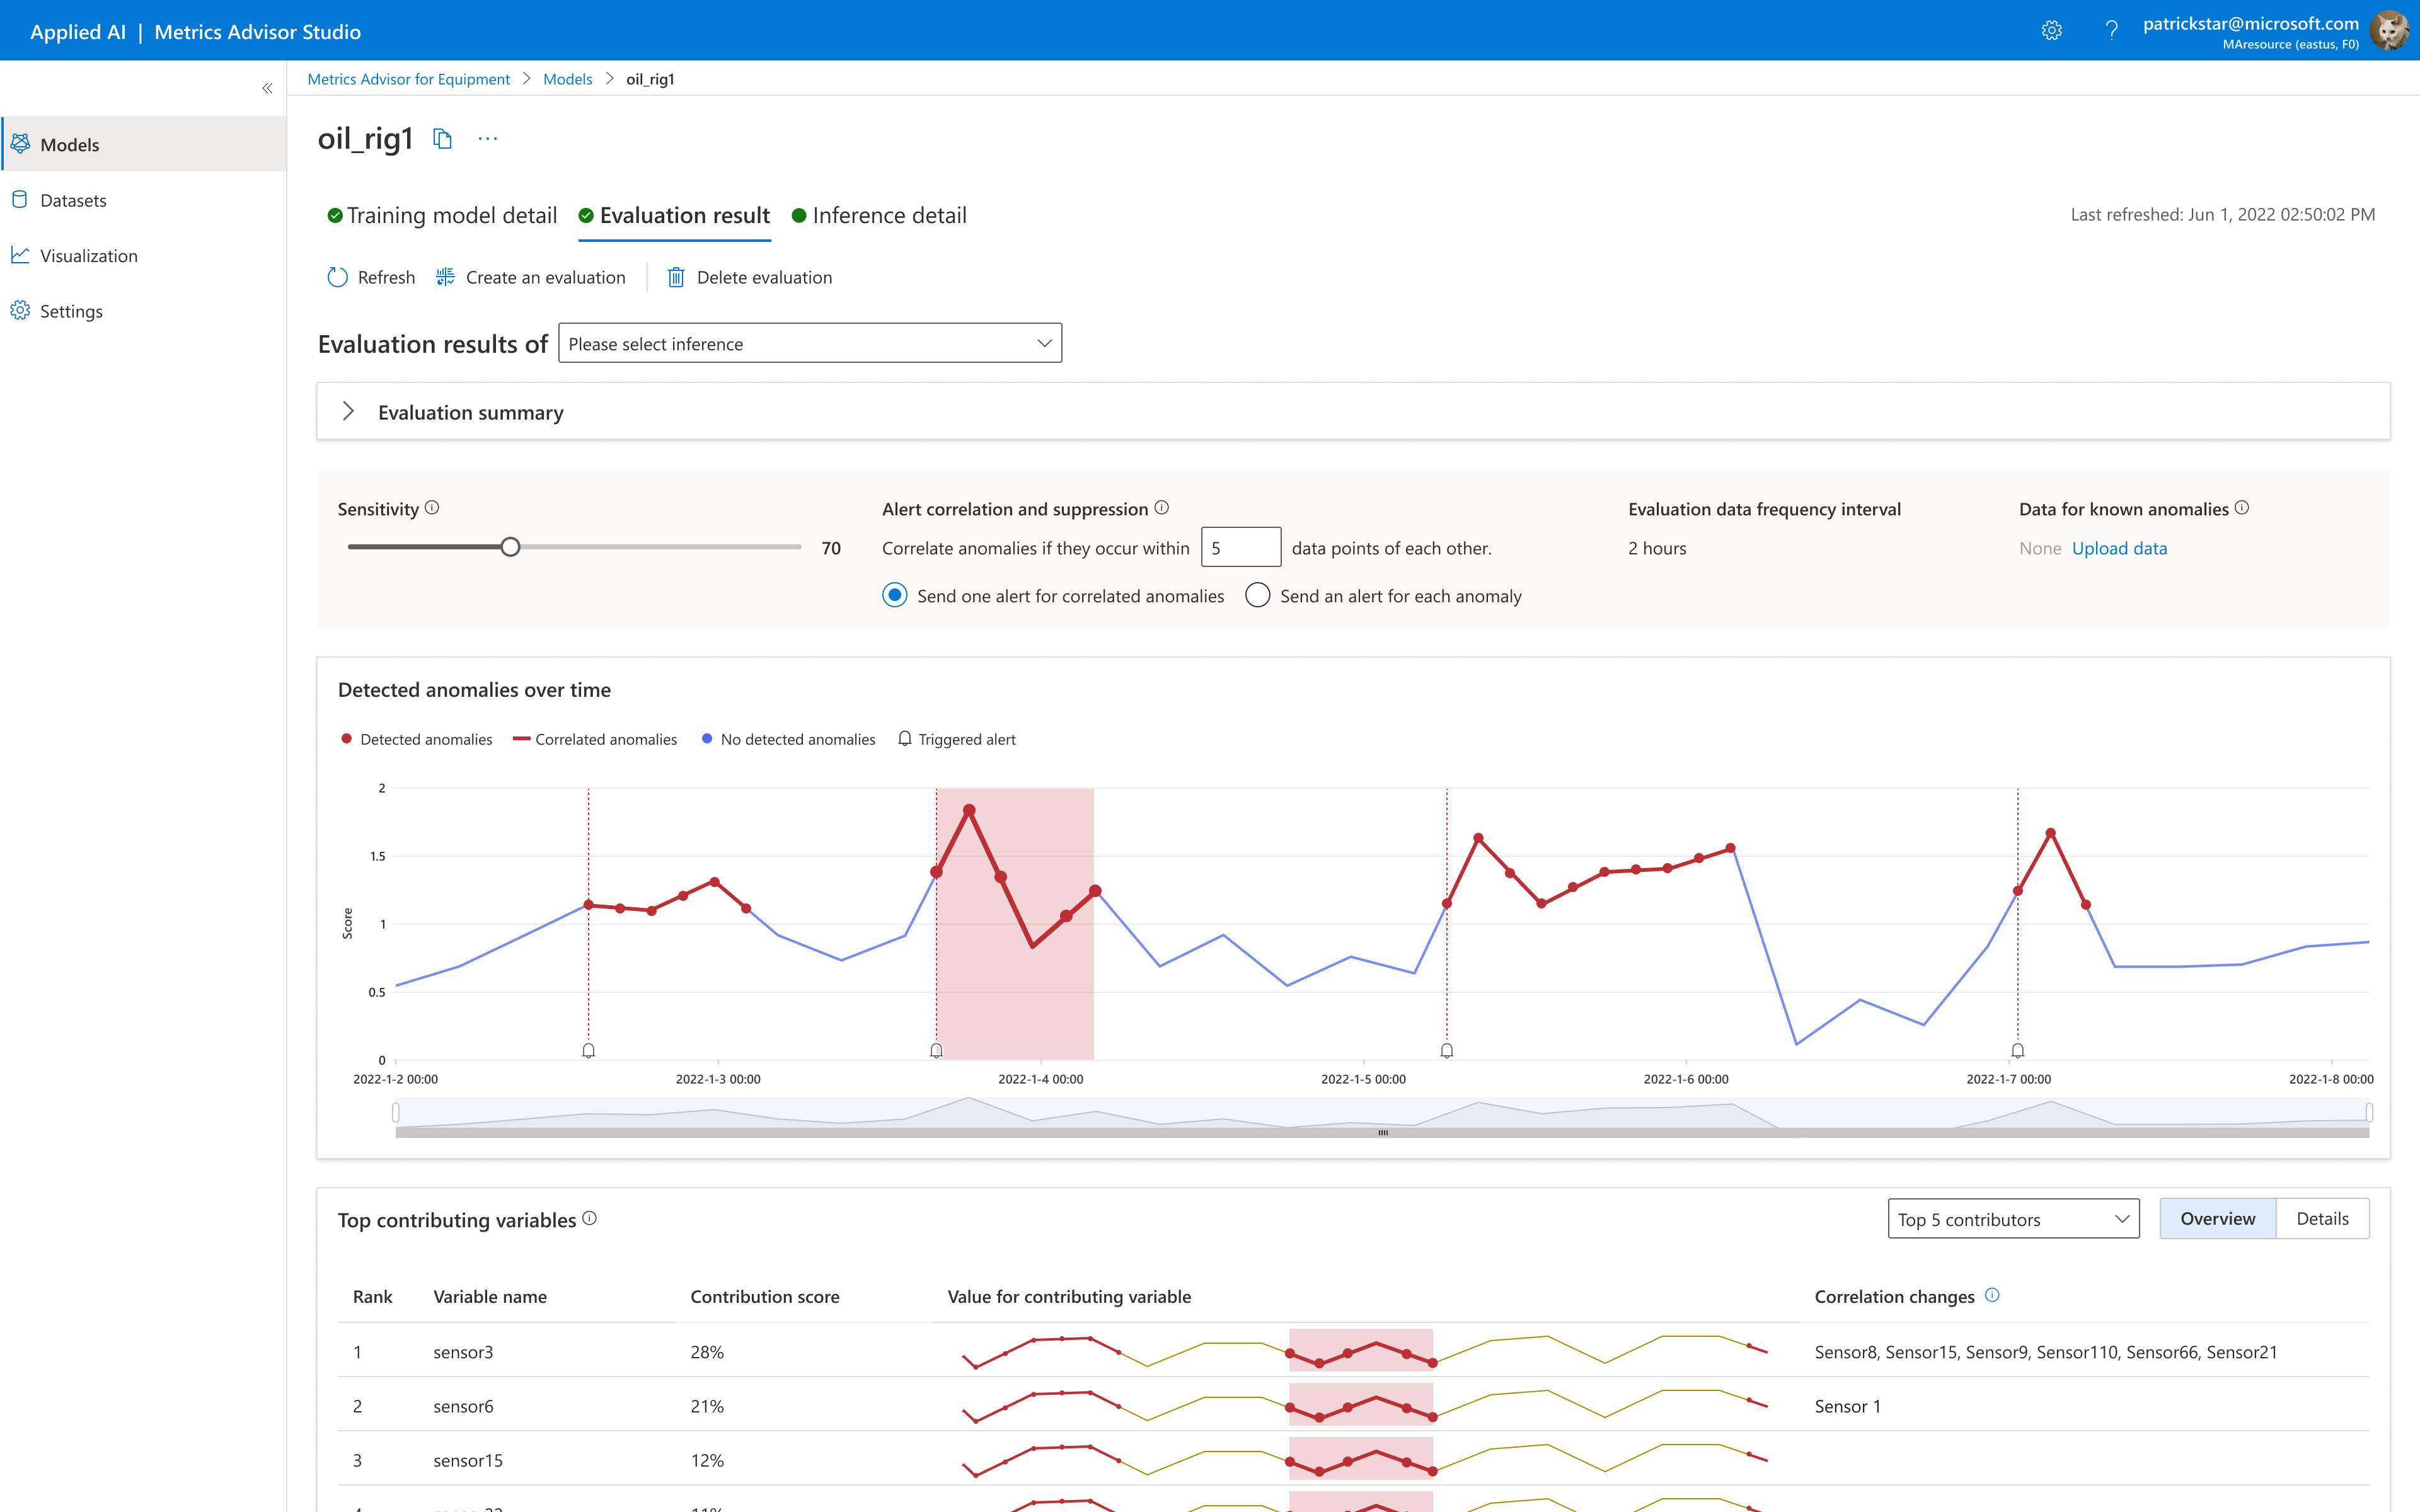
In the example below, equipment anomalies and health trend represents the results from the chosen evaluation run. These results provide information about anomalous behavior that occurred over the evaluation time range.
Use the slider to zoom in on a particular event.
Click on a particular event (red bar) to view details about it.
After you click on a particular event, the Event details tab indicates which sensors contributed the most to that event.

5. Upload the label
If you've provided Metrics-Advisor-for-Equipment with label data, you can see how the model's predictions compare to the label data.
Compare the model's detected anomalies to periods of known anomalies by uploading a CSV file that's 1 MB max. Upload the data with the same timestamp format as your evaluation dataset and in two columns: one column for known anomaly start time, and the other for the end time.

**After clicking on "Upload label", upload ONE csv file with label data. **The labels are shown in a purple ribbon labelled "Known anomalies" .
Format requirement:
Event_start_time (timestamp format MUST be the same as your evaluation data)
Event_end_time (timestamp format MUST be the same as your evaluation data)
File size limit: 1MB
Advanced settings:
Users should modify the detection configuration to let Metric Advisor for Equipment's predicted anomalies match with their labels as much as possible
When users try different numbers for sensitivity, the anomaly red points on the anomaly score trend visuals will change accordingly.
Data granularity: automatically detected on the backend;Sensitivity: choose an integer between 1-100, higher sensitivity means more anomalies will show upSnoozing window: "Do not send out alerts if an alert was already sent in the last __ min",different numbers for Snoozing window, the anomaly score trend visuals will change accordingly.
6. Anomaly score
Detected anomalies over time means the results from the most recent evaluation run. These results provide information about anomalous behavior that occurred over the past 300 points.
Use the slider to zoom in on a particular event.
Metrics Advisor for Equipment will generate the following plot where you can see:
Anomaly scoreis the raw output of the model on which the model makes a decision. The anomaly score will have a value from 0-1.78. An anomaly score usually will indicate an anomaly rise or decline, respectively.Anomalyindicates an anomaly at the current timestamp.Not Anomalyindicates the current timestamp is not an anomaly.

7. Top contributing variables
After you click on a particular event, the event details tab indicates which sensors contributed the most to that event. Users can select top 5/10/15 contributors at one time from the dropdown.
Top contributorsis a list containing the contribution score of each variable. Higher contribution scores indicate a higher possibility of the root cause. This list is often used for interpreting anomalies as well as diagnosing the root causes.Contribution scoresfor the top 30 variables will total to 100%.Correlated Variables: this field will show which variables have significant correlation change with the corresponding top contributing variable.
NOTE: Metrics Advisor for Equipment will pull 300 data points for each variable when users click on an anomalous point and show the top 5 contributors by default.
