Harnessing the Power of Network Trace Analysis in Azure App Service
We are thrilled to announce the public preview of a powerful new feature in Azure App Service: the Network Trace Analyzer. Designed to simplify the often-complex task of network trace analysis, this tool is set to revolutionize your troubleshooting process.
Capturing the right network trace at the right time is only half the battle. The major challenge often lies in interpreting the network trace, a task that requires not only the right tools but also a deep understanding of network protocols and behaviors. This innovative addition is now available in the Diagnose and Solve Problems blade in the Azure portal and is designed to streamline the process of analyzing network traces and troubleshooting issues within your web application.
Getting Started
To access the Network Trace Analysis tool, navigate to the Diagnose and Solve Blade > Diagnostics Tools and select Network Trace Analyzer.
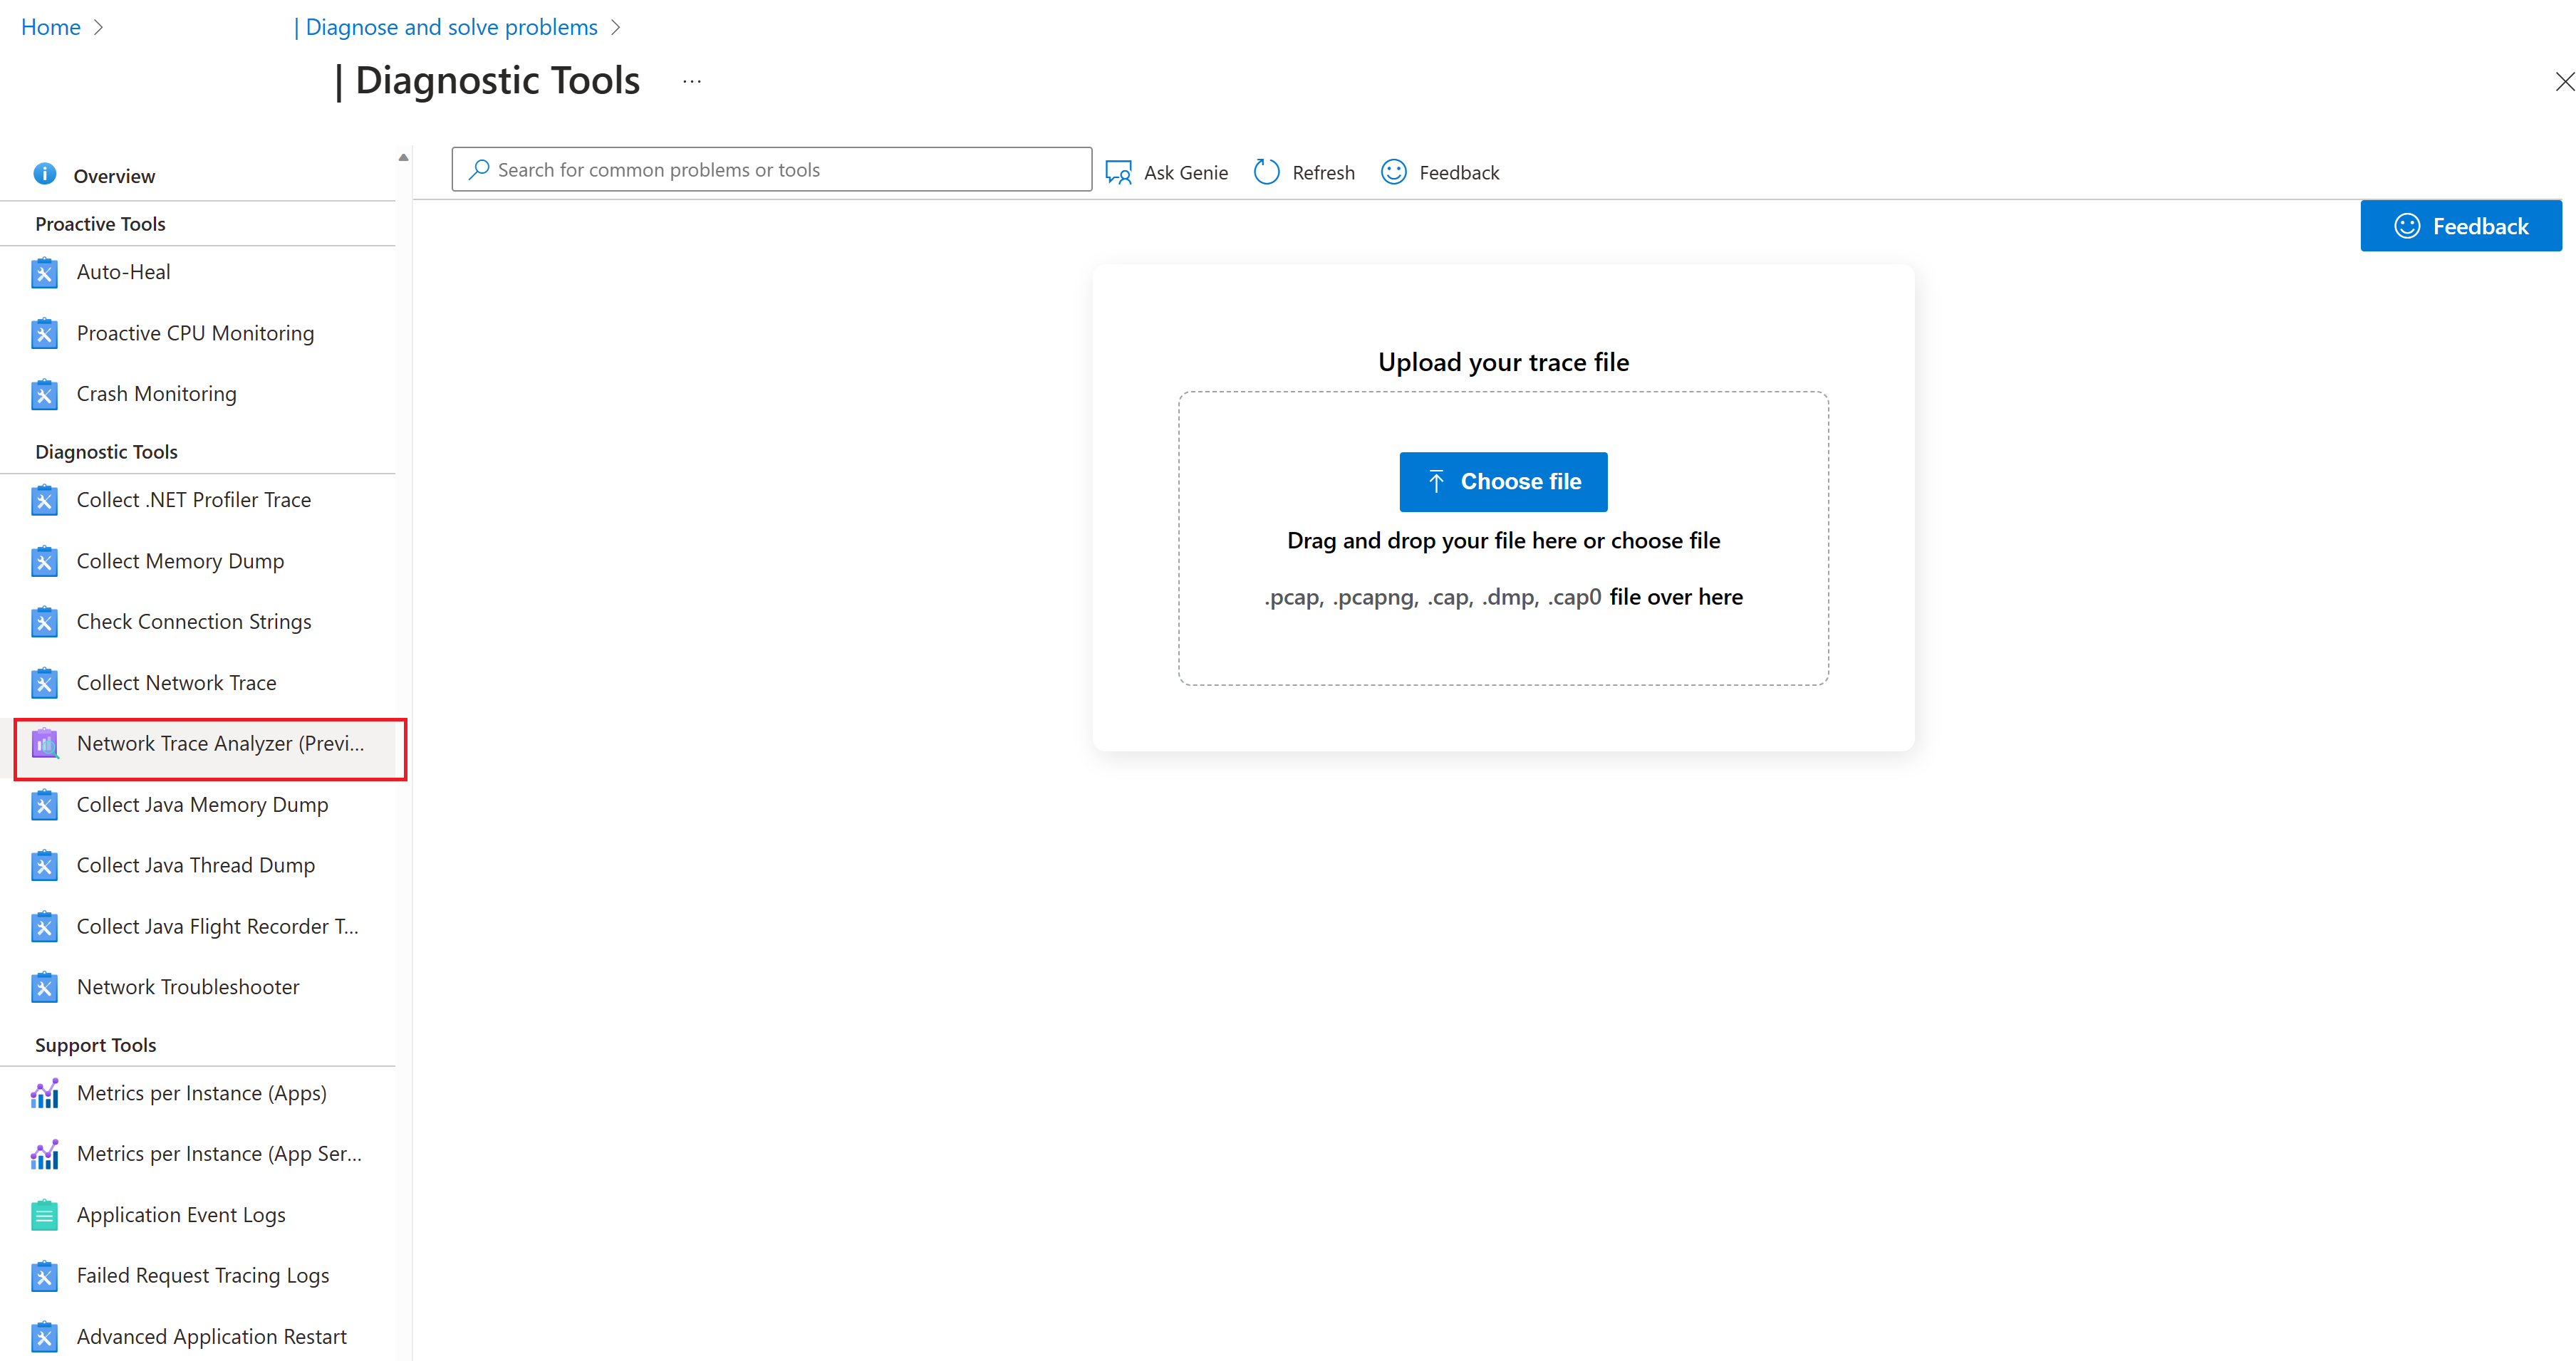
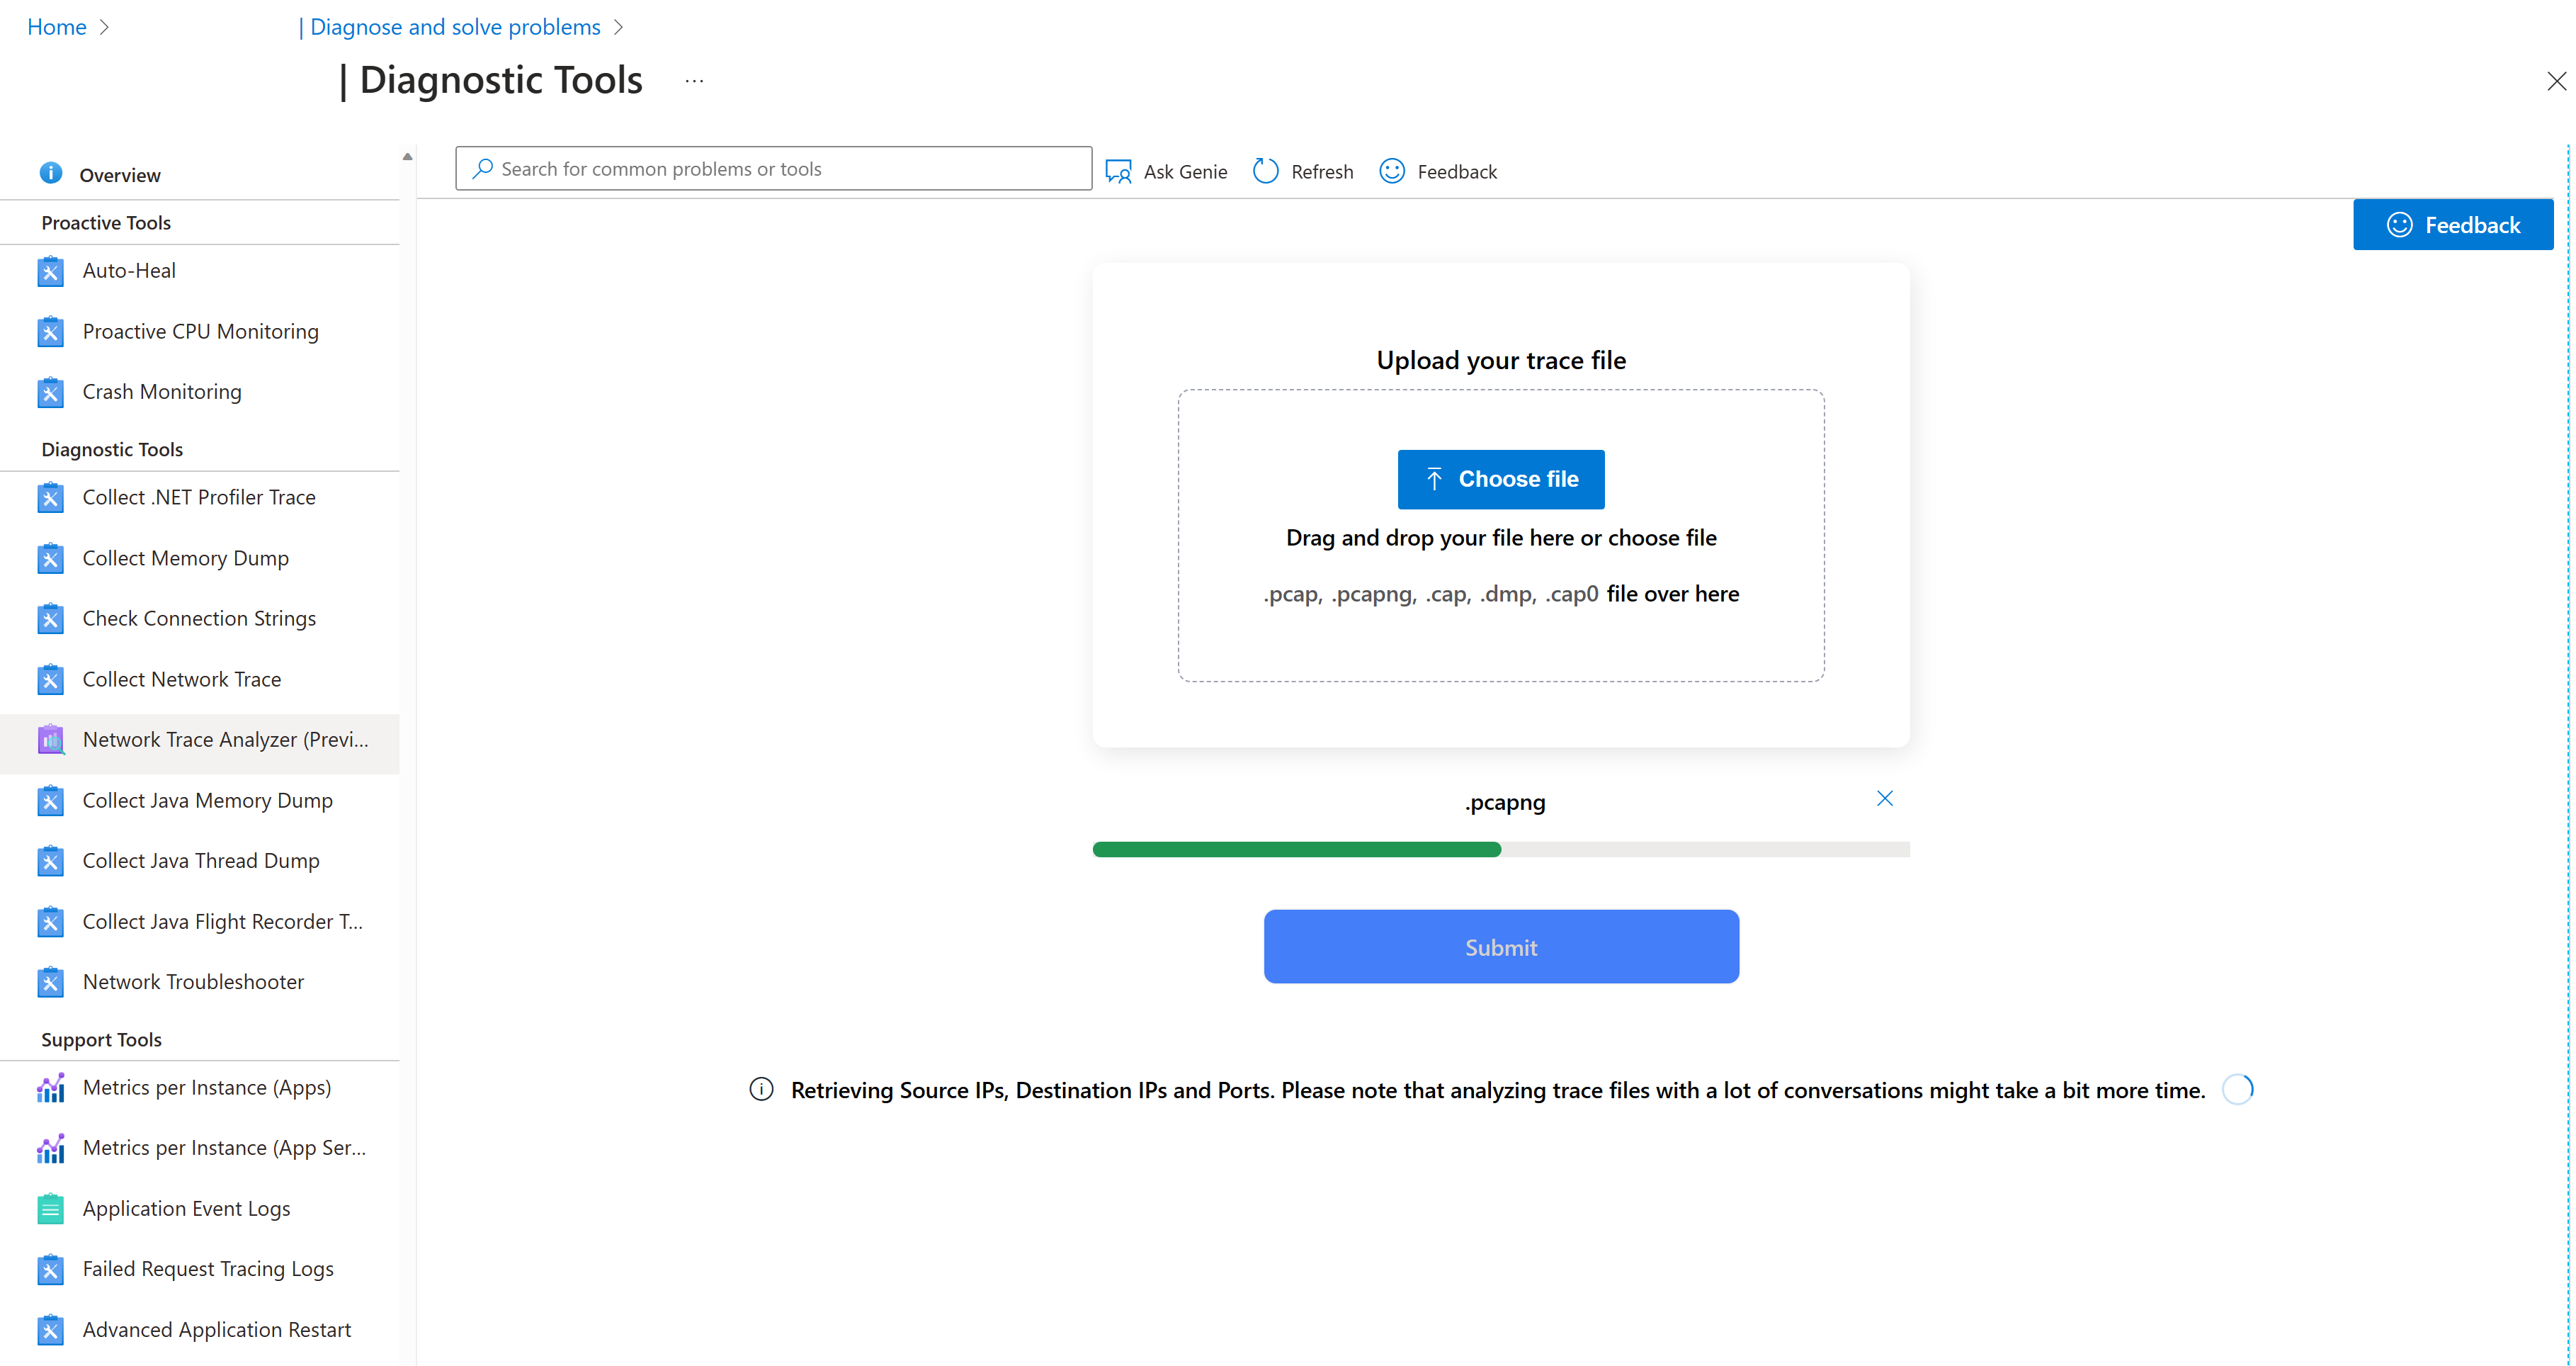
Upload your network trace file and let our tool do the heavy lifting. Once uploaded, our tool begins the background process of identifying the source and destination IPs and ports.
You will be required to select a destination IP and port for analysis. In cases where multiple source IPs are present, you will also need to choose a source IP.
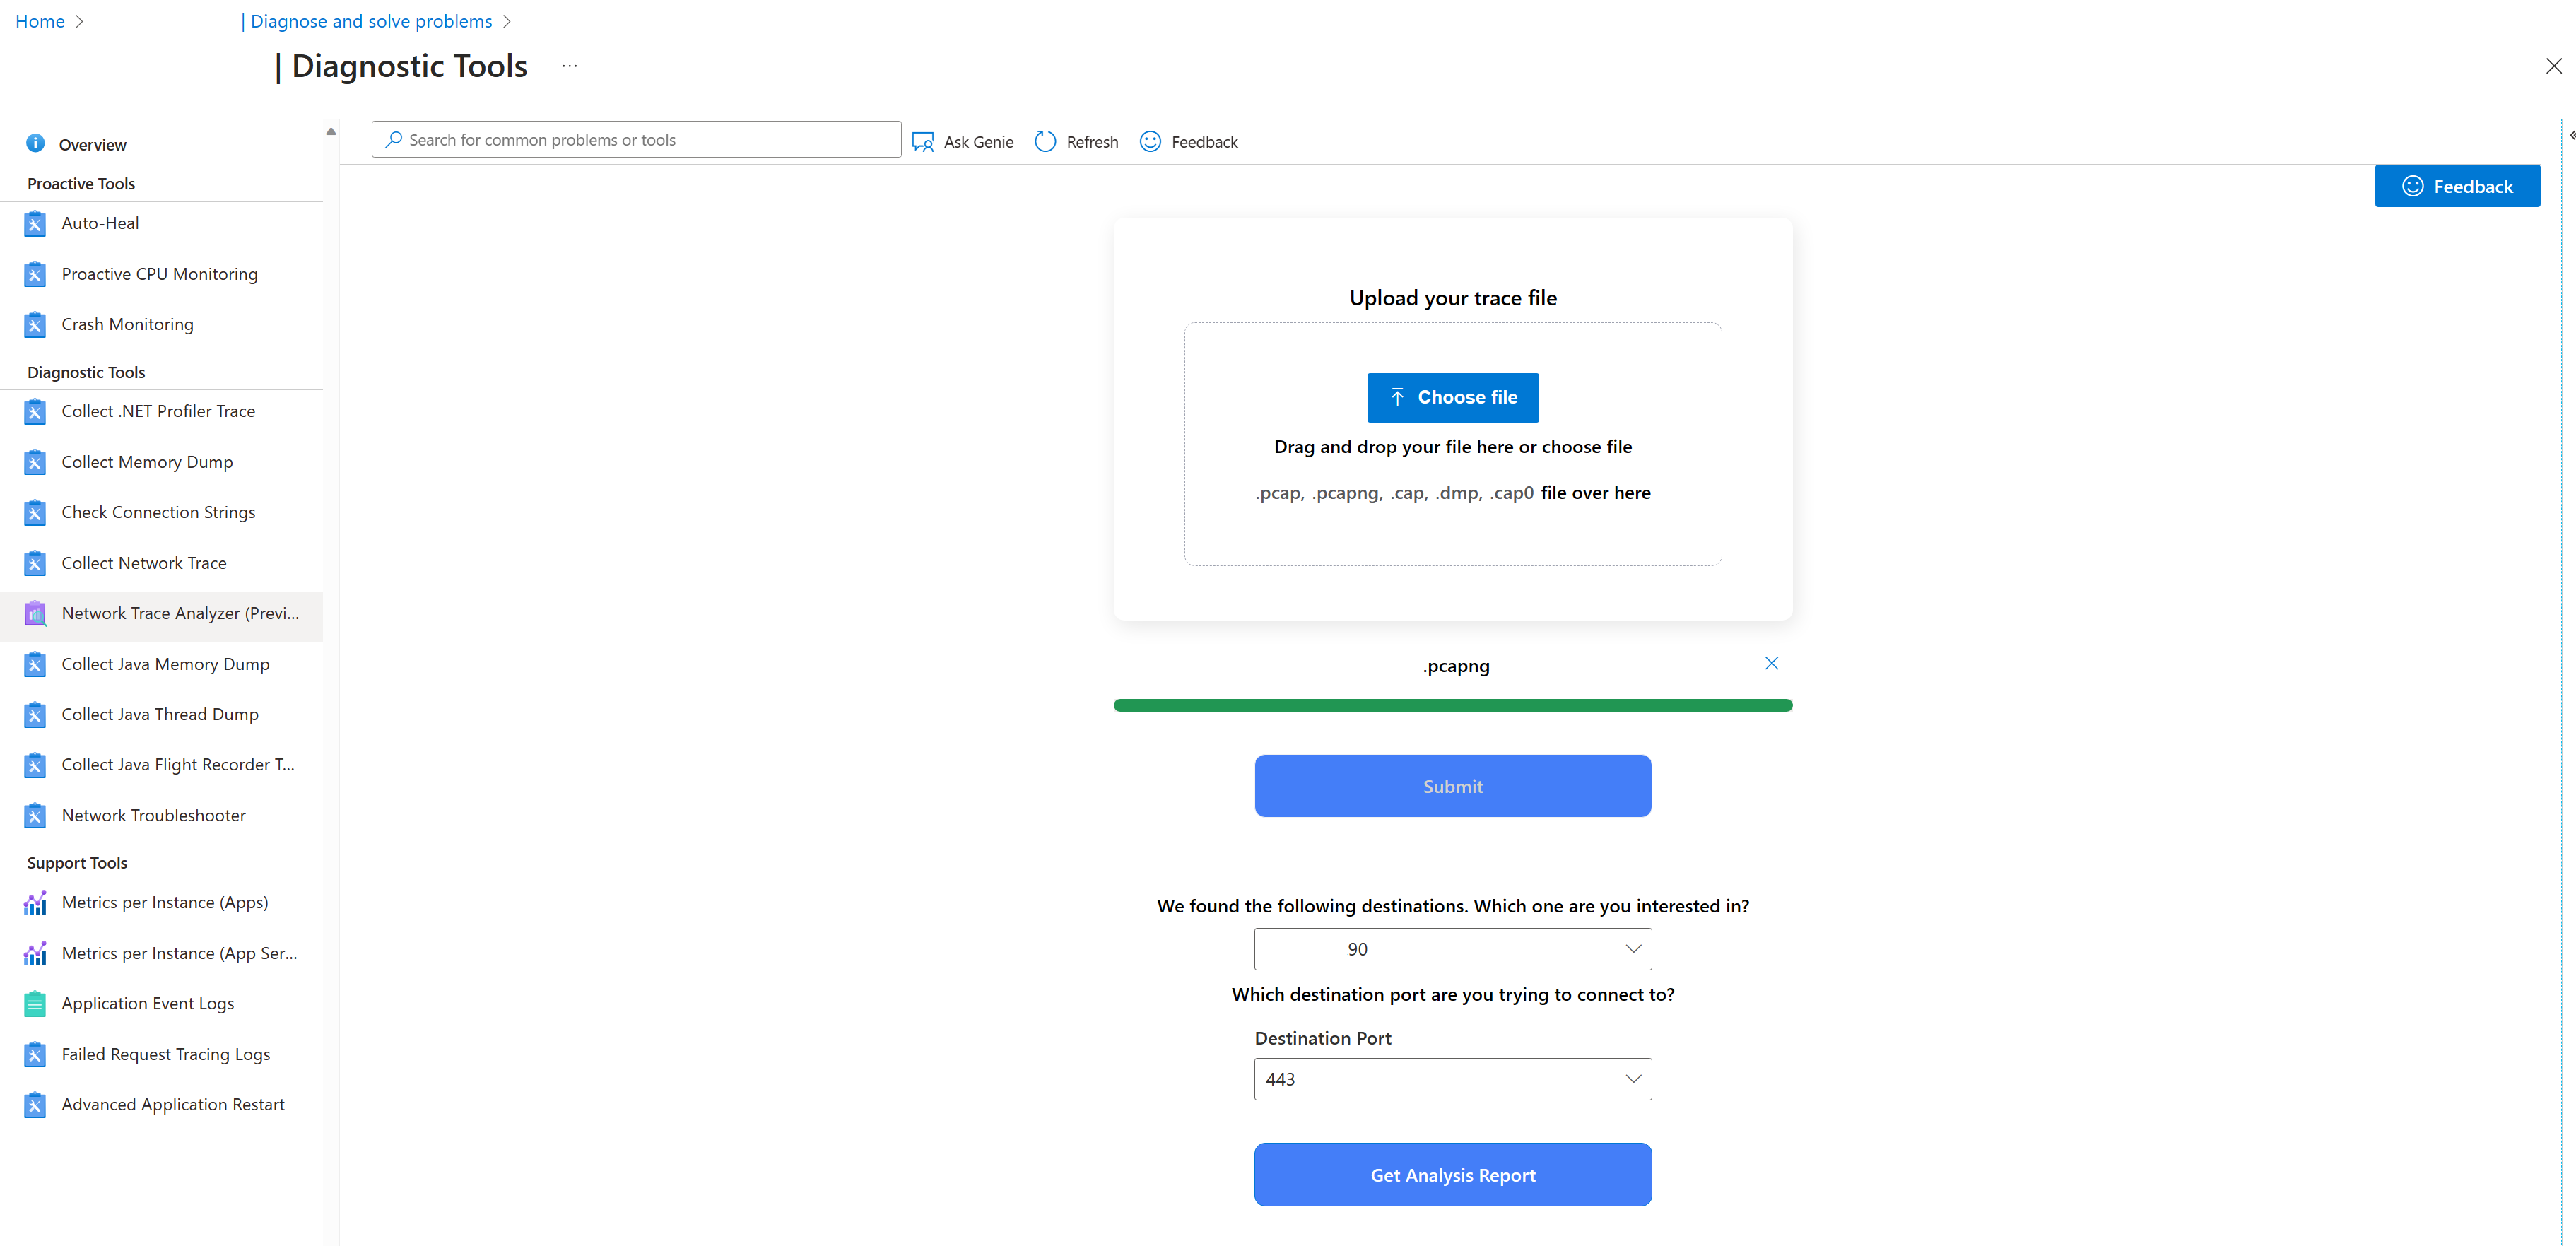
After providing the necessary information, click on the Get Analysis Report button to generate the detailed report.
Interpreting the Network Trace Analysis Graph
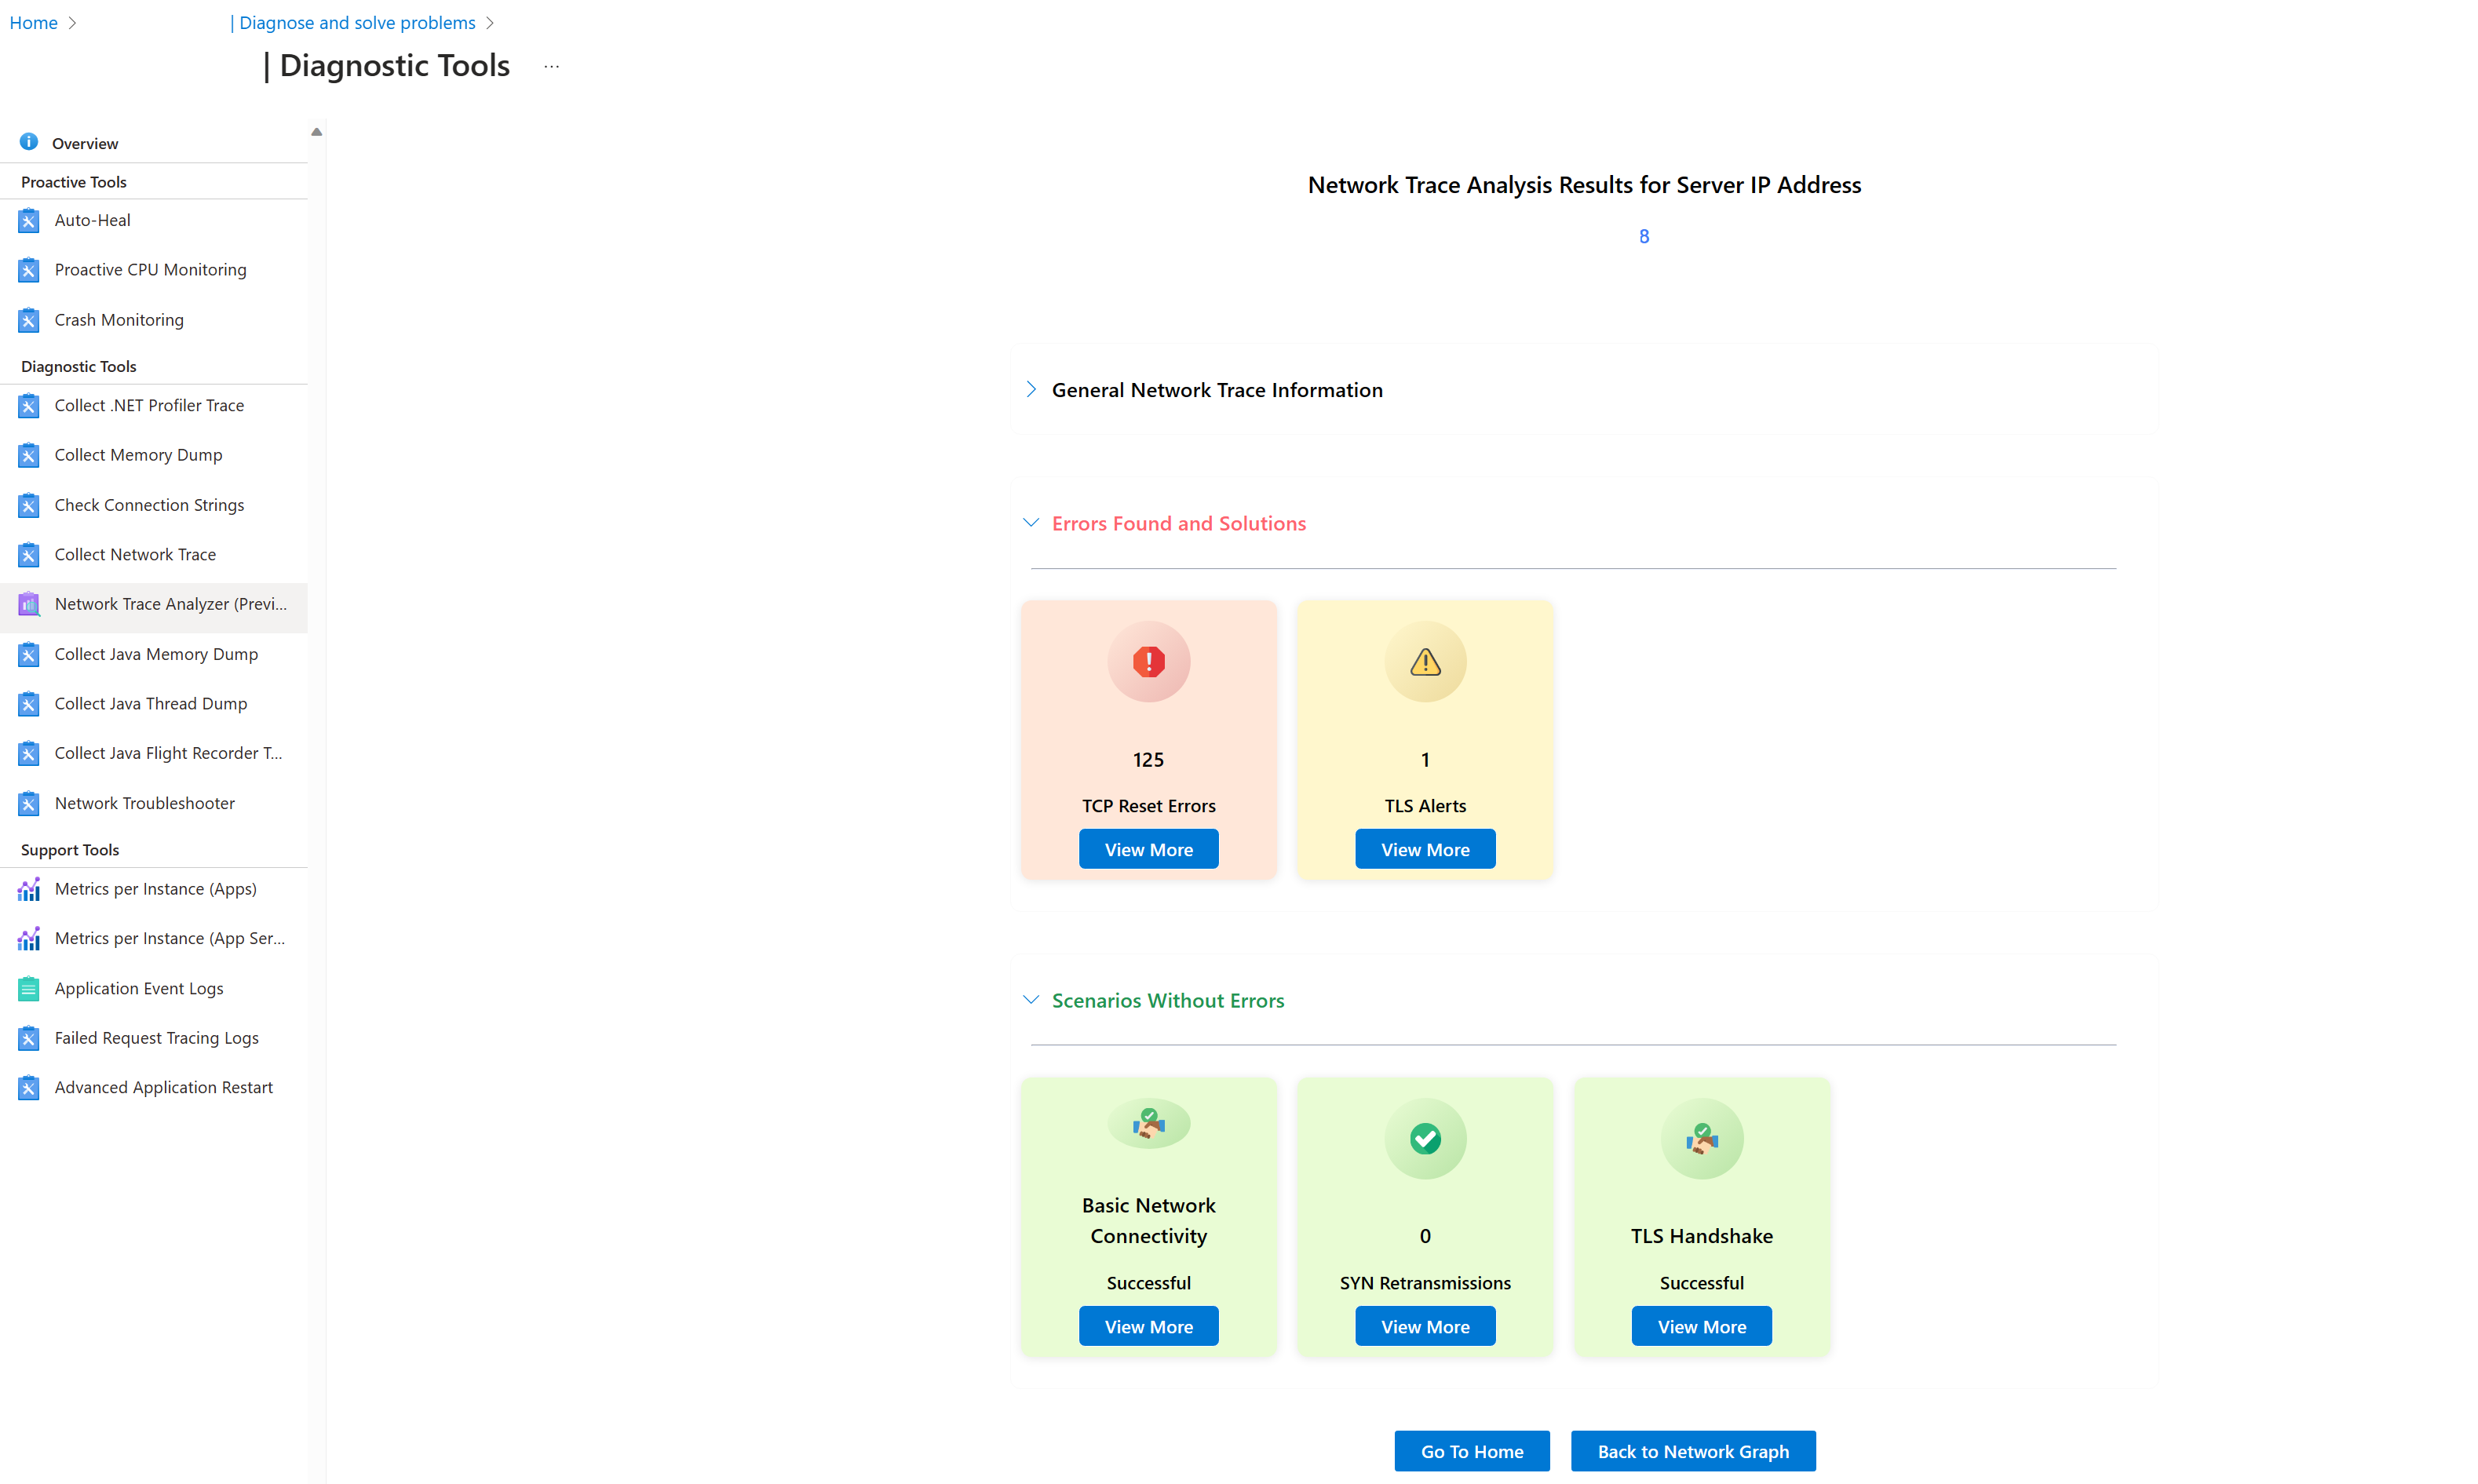
The Analysis Report presents a comprehensive network trace analysis graph depicting the current state of the basic network connectivity between your web app and various remote endpoints it is connected to.
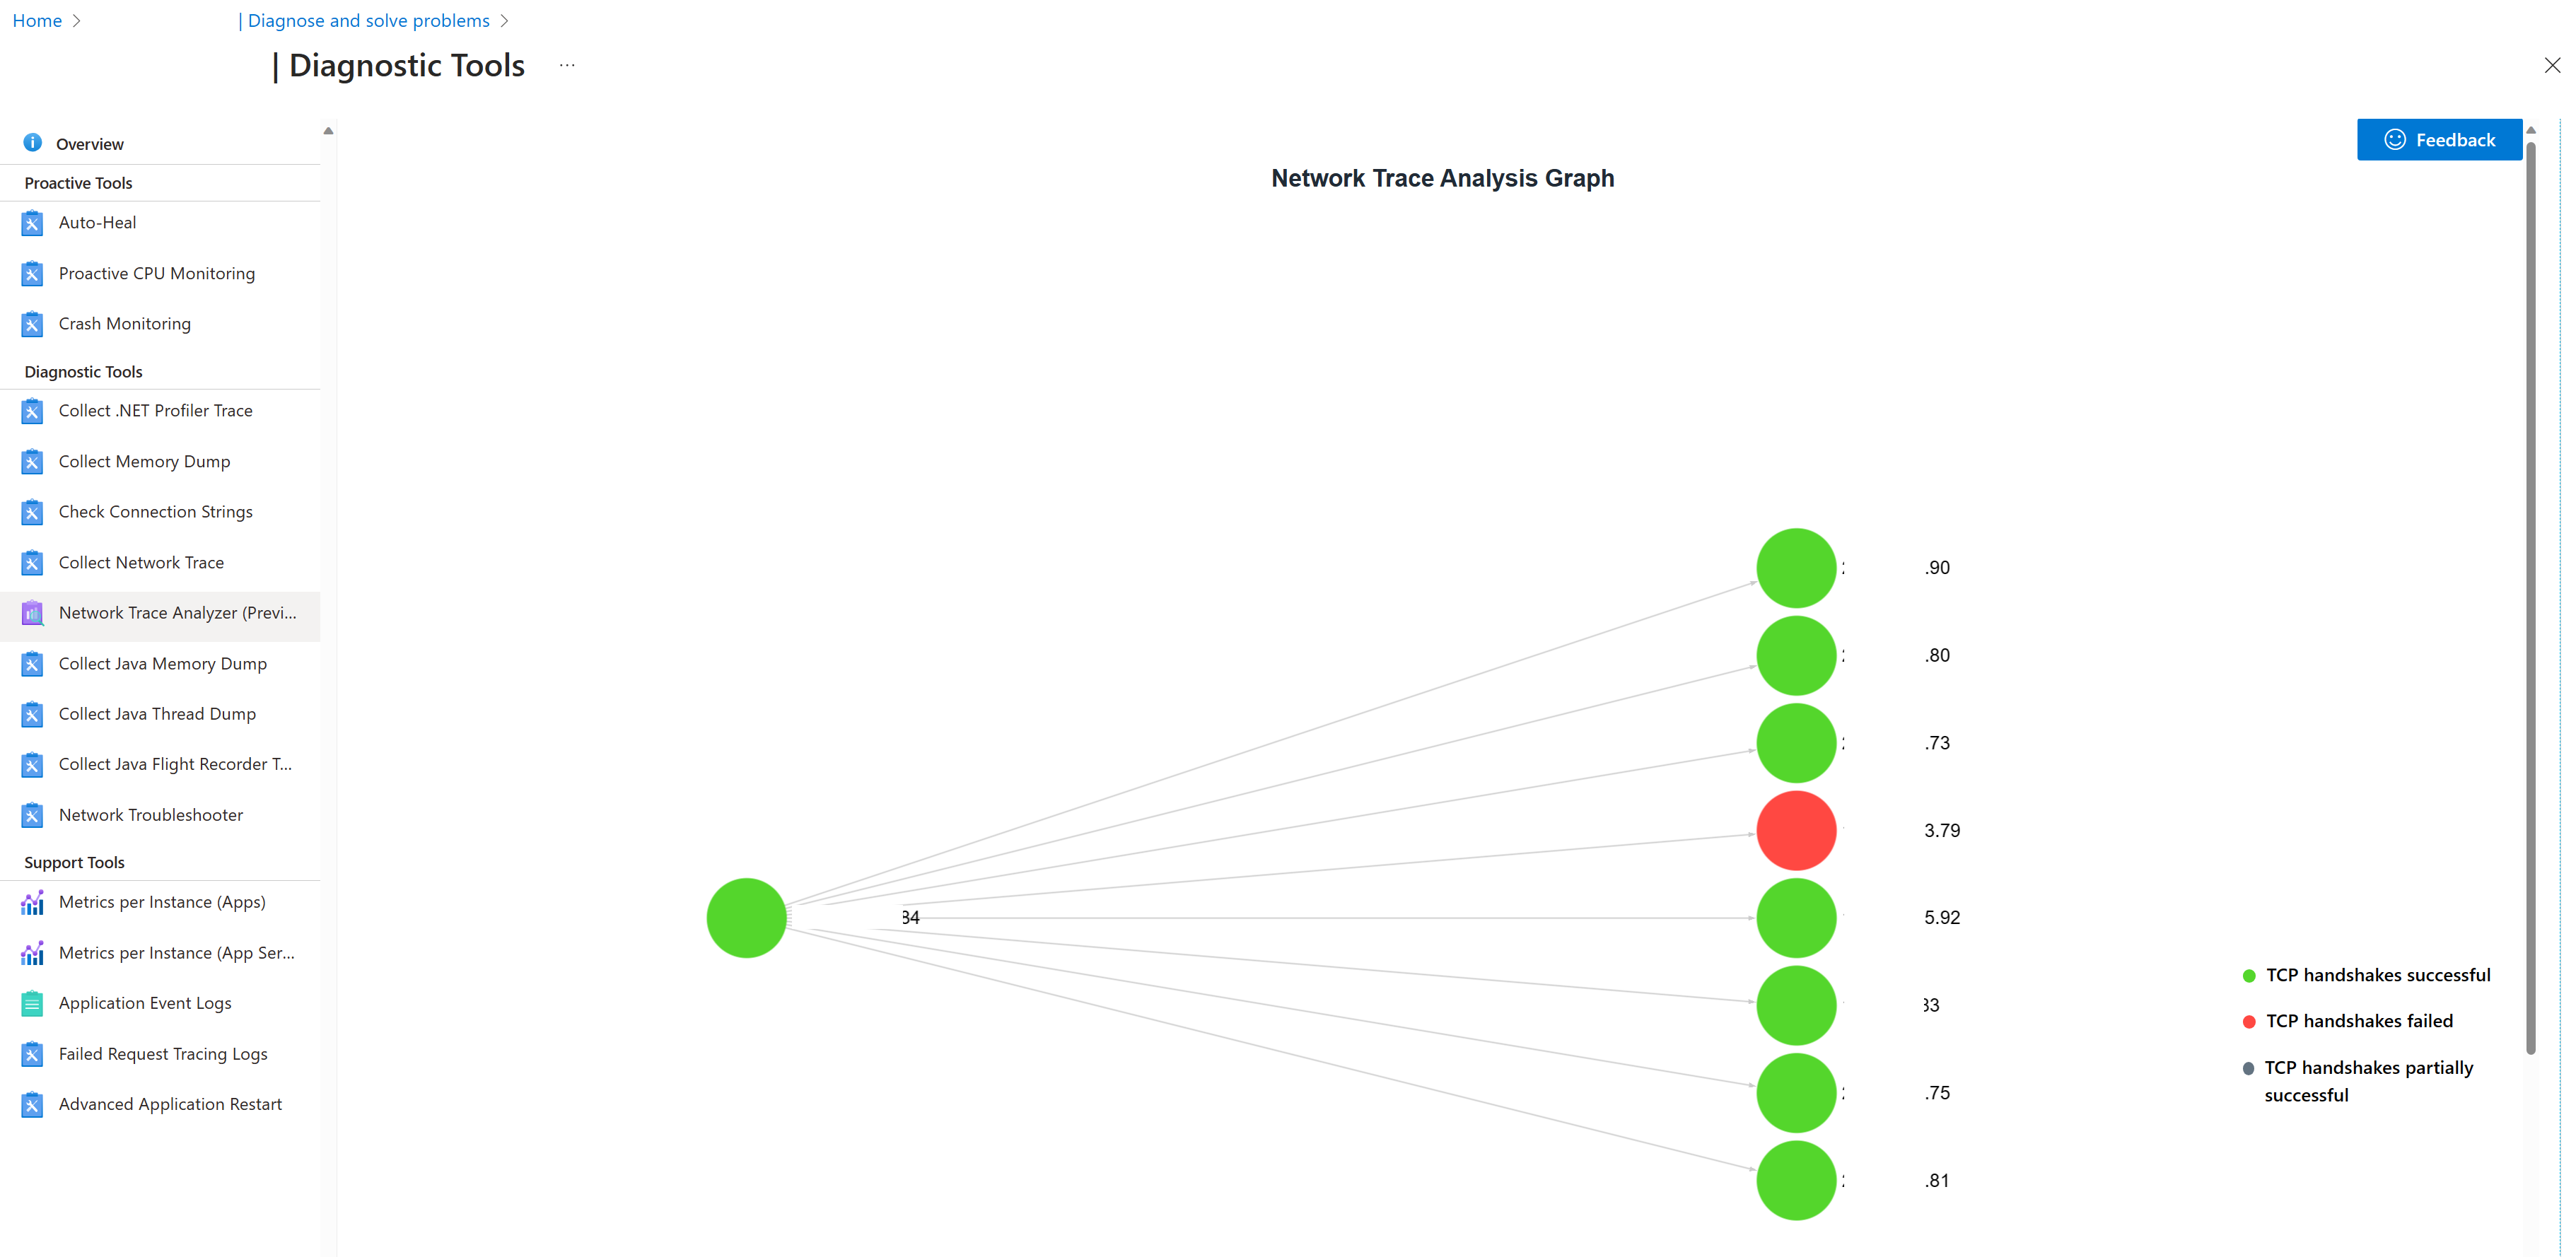
By clicking on any of the nodes for the remote endpoints, you can view a detailed analysis report. This report provides a summary of the most pertinent information in the network trace and highlights potential red flags which could be the root cause of the network-related issues on your web app. It also provides recommendations on how to resolve them, simplifying the process of troubleshooting network-related issues on your web app.
Key Features
-
Basic Network Connectivity: This feature analyzes the initiation of a TCP connection, helping you troubleshoot issues arising during the establishment of a connection between your web app and the destination endpoint.
-
Transmission Control Protocol (TCP) Reset Errors: Identify and address TCP reset errors that may be disrupting your web application’s connectivity.
-
TCP SYN Retransmissions: Detect and troubleshoot TCP SYN retransmission errors that can degrade your web application’s performance.
-
TCP Reset Errors: Checks for TCP reset errors which occur when a TCP connection is abruptly closed by the receiving end of the connection.
-
Transport Layer Security (TLS) Handshake: This tool checks the TLS “handshake” process, which is the initial step in establishing a TLS connection
-
TLS Alerts: Monitor for TLS alerts, which are warning or error messages that can be sent at any time during the TLS connection process. These alerts can indicate issues like an unknown certificate authority, a decryption error, or a protocol version mismatch.
Future updates will introduce scenarios like TCP Packet Loss, TCP Zero Window Dead, and more.
Conclusion
The Network Trace Analyzer in Azure App Service is a significant leap forward in simplifying network trace analysis. This tool not only makes it easier for you to identify potential issues but also provides actionable recommendations for resolving them.
We’re excited for you to try out this new feature and look forward to your valuable feedback. As always, our commitment is to continually enhance your experience within Azure App Service.
Questions/Feedback
If you have any questions or feedback, please reach out to our team at diagnostics@microsoft.com