Public Preview: Codeless Monitoring for Windows Containers
We are happy to share that Auto-Instrumentation of Application Insights for Windows Container applications is now in public preview! Auto-Instrumentation allows you to monitor your applications with Application Insights without changing your code. When enabled, the App Service platform will configure and attach the agent to the application in your container. Once attached, metrics such as requests, dependencies, latency, and stack traces will flow into your Application Insights resource where you can analyze the data and set up alerts.
Note: Auto-Instrumentation for Windows Containers on App Service currently supports .NET and Java applications. Node.js support is planned. For other stacks, consider adding the Application Insights SDK to your application.
Enable Auto-Instrumentation
You can enable Auto-Instrumentation from the Create blade, or from the Application Insights blade.
Create Blade
- Go to the Create Web App blade
- Provide a name for your web app, and select Docker Container as the Publish type, and Windows as the Operating System
-
Go to the Monitoring tab, and select Yes to enable Application Insights

- Go to Review + Create and click Create
That’s it! Once your container is deployed, Application Insights will attach automatically and begin sending metrics.
Application Insights Blade
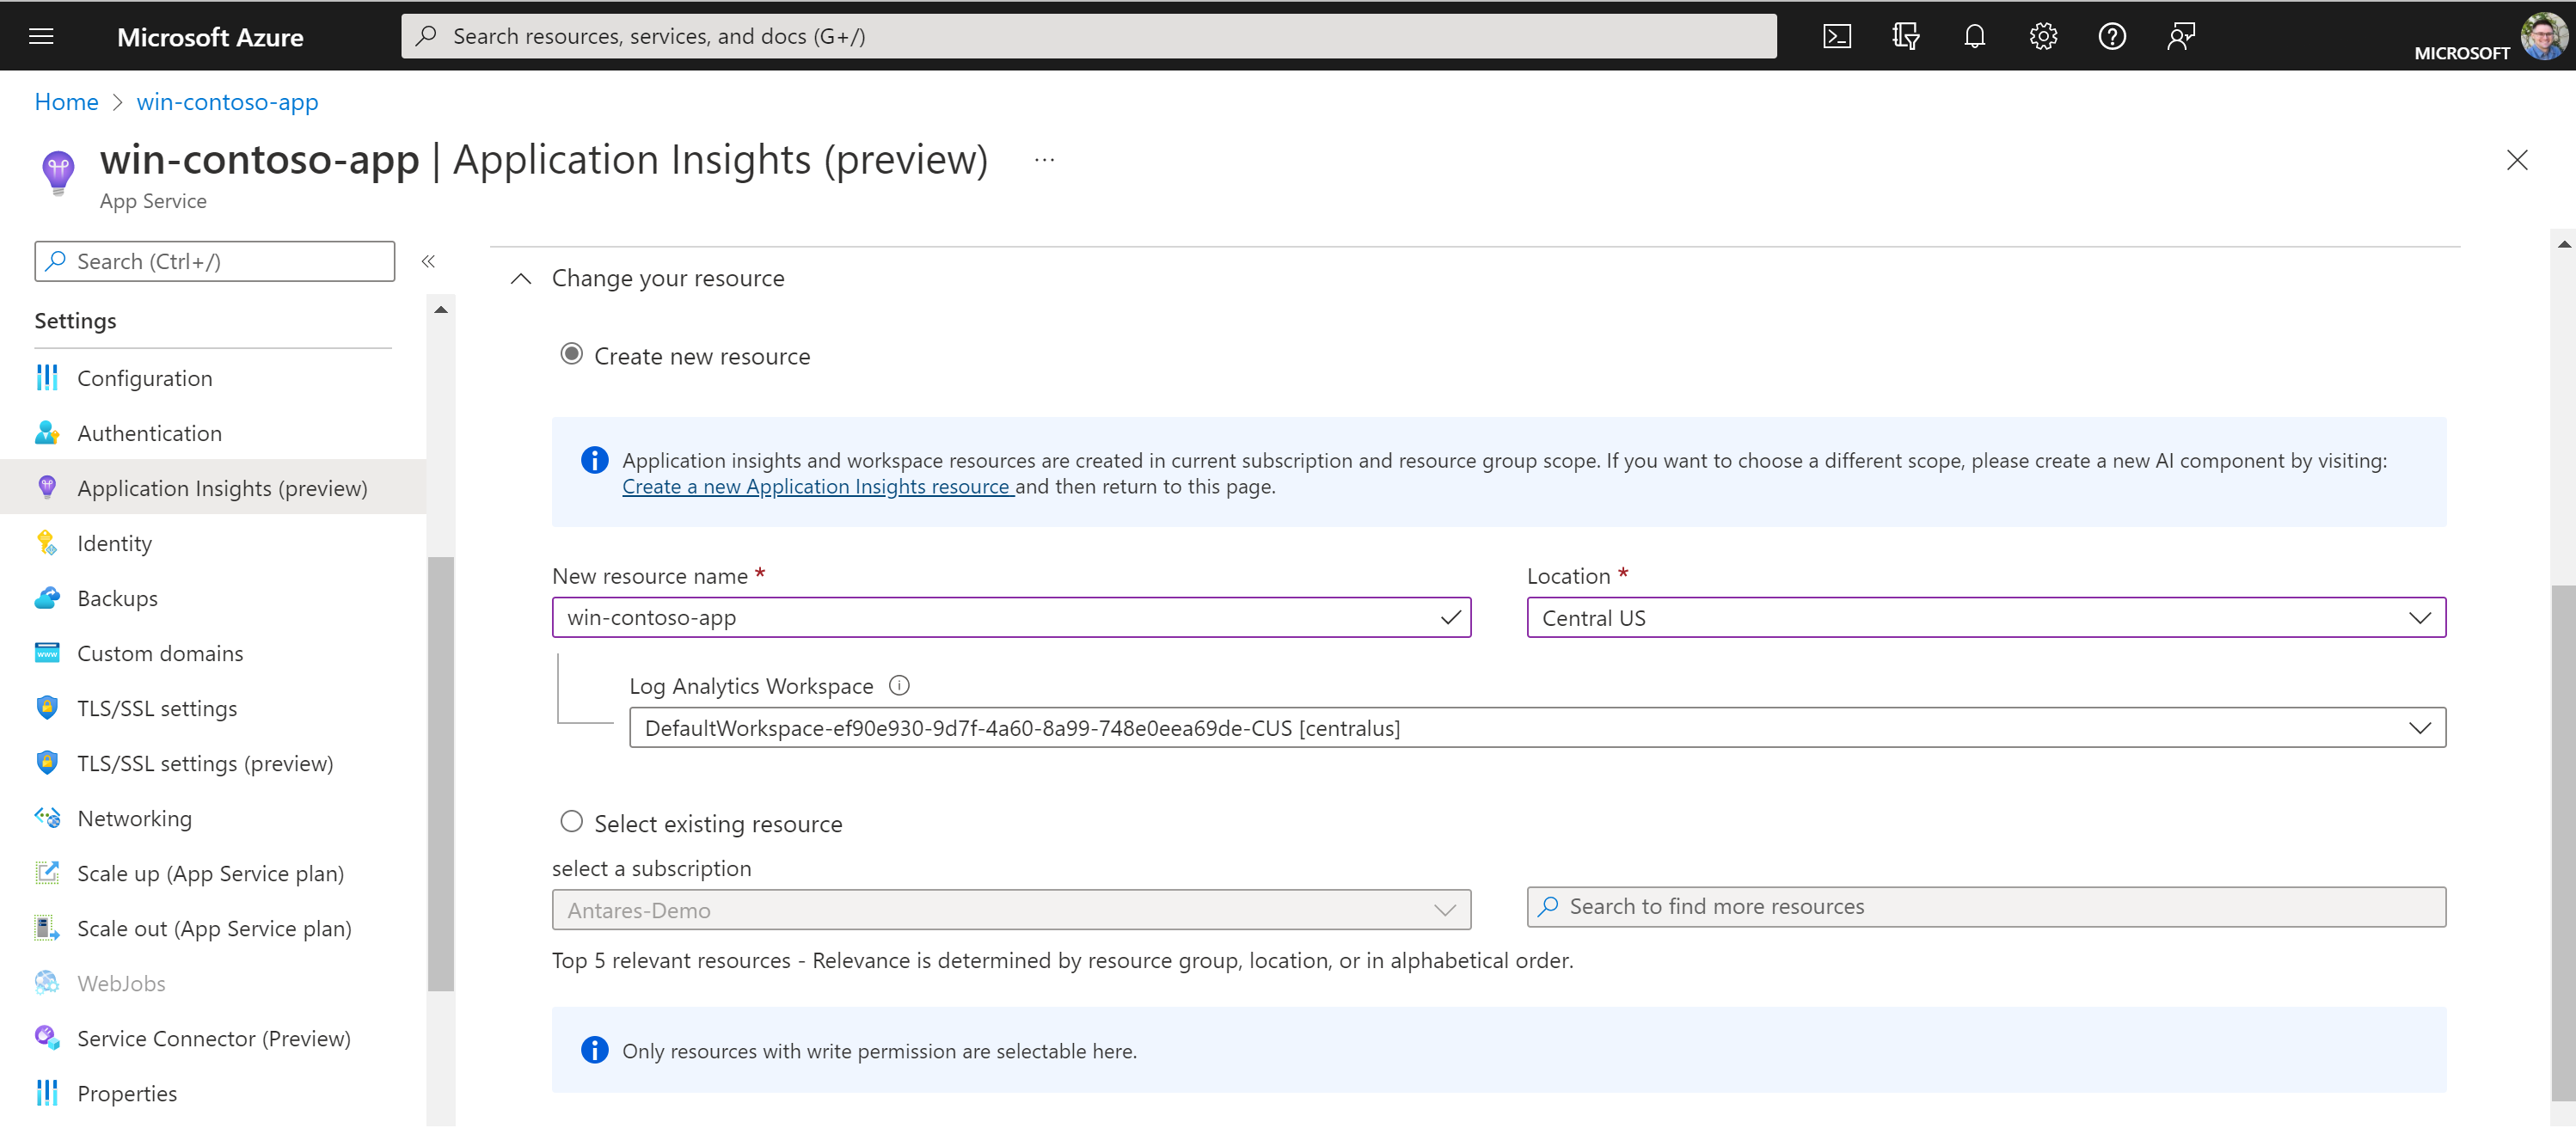
If you already have a Windows Container web app, open it in the Azure Portal and go to the Application Insights (preview) menu item.
- Select Turn on Application Insights
-
Select a Location for your Application Insights resource to be created. (It’s suggested to create the resource in the same region as the Web App.)

- (Optional) use the language tabs at the bottom for .NET, .NET Core, and Java to configure the agent
- Click Apply to save your changes
And you’re done! Your web app will restart and Application Insights will attach automatically to begin sending metrics.
