Proactive Crash Monitoring in Azure App Service
A crash of a process happens when the process terminates due to an unhandled exception within the application code. A crash leads to a restart and all the in-flight requests (requests currently being handled by the process) are aborted abruptly and may fail with an HTTP 502 error. The process restart causes the application startup code to kick in and the result might be observed as slowness in the application for end-users. Hence, crashes should be avoided as much as possible! Proactive Crash Monitoring is a feature of Azure App Service that checks for process crashes and collects diagnostic data that helps you determine the root cause of the crash.
Currently offered in App Service Diagnostics for Windows web apps.
How does Proactive Crash Monitoring work?
Whenever the worker process (w3wp.exe) corresponding to your app crashes due to an unhandled exception for more than 3 times in 24 hours on the same instance, the feature is enabled automatically and a debugger process is attached to your site’s main worker process. This debugger process then waits for your process to crash again and, assuming it does crash again, a memory dump is collected. This memory dump is then analyzed and the call stack of the thread that caused the crash is logged in your App Service’s logs.
Viewing Crashing thread information
Folow these steps to view the crashing thread’s call-stack.
- Open the Diagnose and Solve blade for the app (in the left-side navigation menu)
- Choose Availability and Performance category
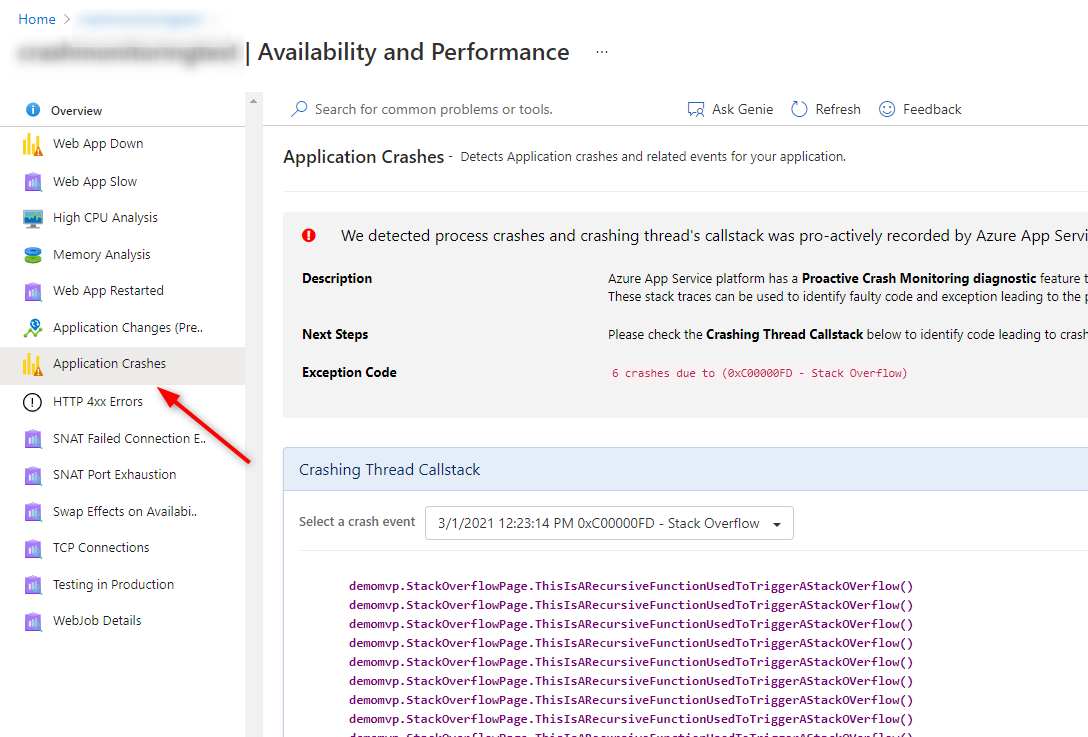
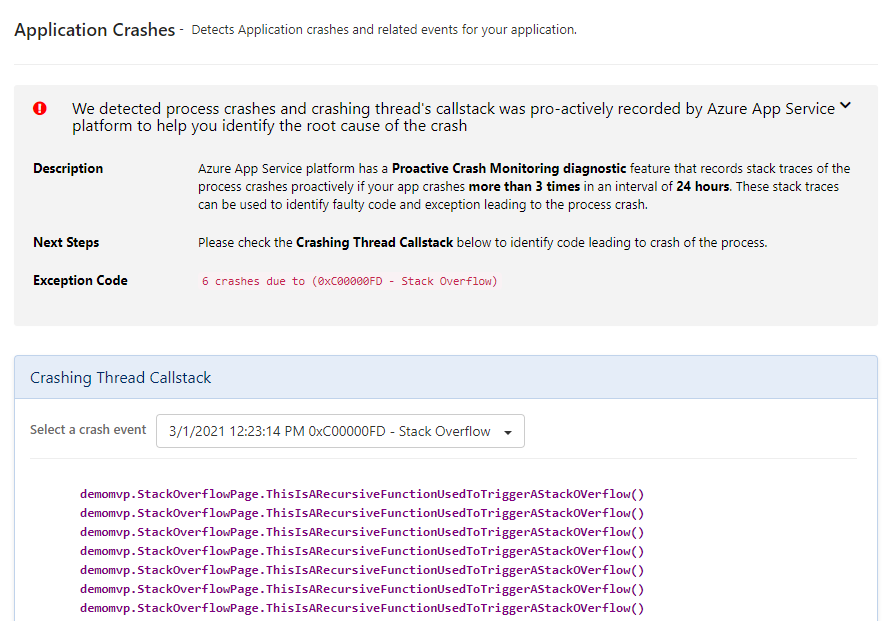
- Choose Application Crashes tool
-
If this feature has collected a crashing thread stack trace, you will find an insight like in the image below
FAQ
How frequently are the crash dumps recorded?
Once a memory dump is captured on an instance, further memory dumps on the same instance may not be captured for the next 8 hours even if the process keeps crashing.
What happens to the memory dump that is collected?
Since the memory dump contains PII data, the memory dump is deleted once the call stack and exception information is recorded. There is no way to retrieve this dump later as this dump is not stored or persisted anywhere. If you need to capture a memory dump for further investigation and a call stack alone is not sufficient, then leverage the Crash Monitoring feature of Azure App Service that allows you to collect memory dumps on process crashes.
Is the original exception message logged somewhere?
The exception message may contain PII data due to which the exception message is not logged in Azure App Services Platform telemetry. There is a log file created in d:\home\logfiles\crashdumps folder for each crash and this log file contains the exception type and full exception message. Information about the last 10 crashes only is saved and older files are deleted. You can view this log file by going to the KUDU console (available at yoursitename.scm.azurewebsites.net) for your app.
Which processes are monitored by this feature?
This feature only monitors the w3wp.exe corresponding to the main app. Any processes that are spun up for out-of-process hosting scenarios (like PHP, CGI, Java, or .Net Core OutProc) are not monitored by this feature. Also, any processes that belong to the SCM site (for e.g. Webjobs) are not monitored by this feature.
Are there additional processes started as a result of this feature?
When this feature is trying to capture a crash dump of your process, you may see CrashMon.exe, procdump.exe, or dbghost.exe running in the Kudu Console for your app.
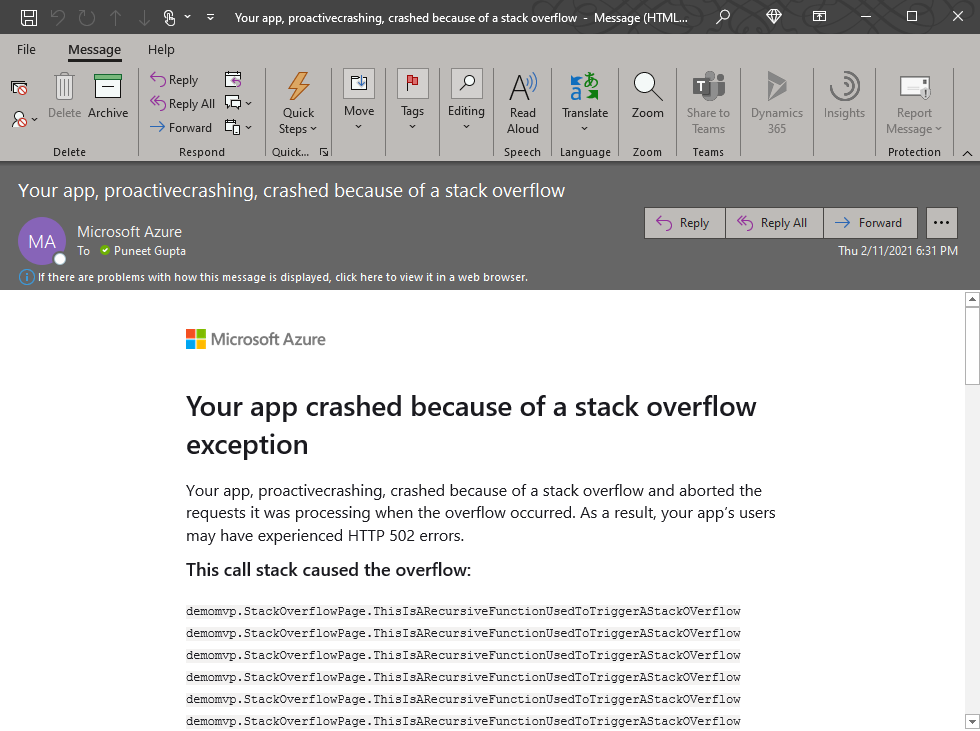
Are we notified for unhandled exceptions recorded by this feature?
We notify by sending emails to the “ServiceAdmin”, “AccountAdmin” and “Owner” roles for the subscription when a crash is recorded by this feature.
What is the performance overhead introduced by the feature?
There might be slight performance impact to your app because a debugger process is attached till the worker process crashes once. The overhead introduced should be negligible but only for apps that have very high exceptions per second rate, some delay may be observed.
Can this feature be disabled?
You can opt-out of this feature by adding the APP SETTING WEBSITE_PROACTIVE_CRASHMONITORING_ENABLED and setting it to FALSE.
Happy Debugging!