A New Look for App Service Diagnostics
The new experience is currently available for select Windows web apps. We are gradually rolling it out to all subscriptions in the coming weeks.
App Service Diagnostics is an intelligent and interactive experience to help you troubleshoot your app with no configuration required. When you run into issues with your app, App Service Diagnostics points out what’s wrong to guide you to the right information to more easily troubleshoot and resolve issues.
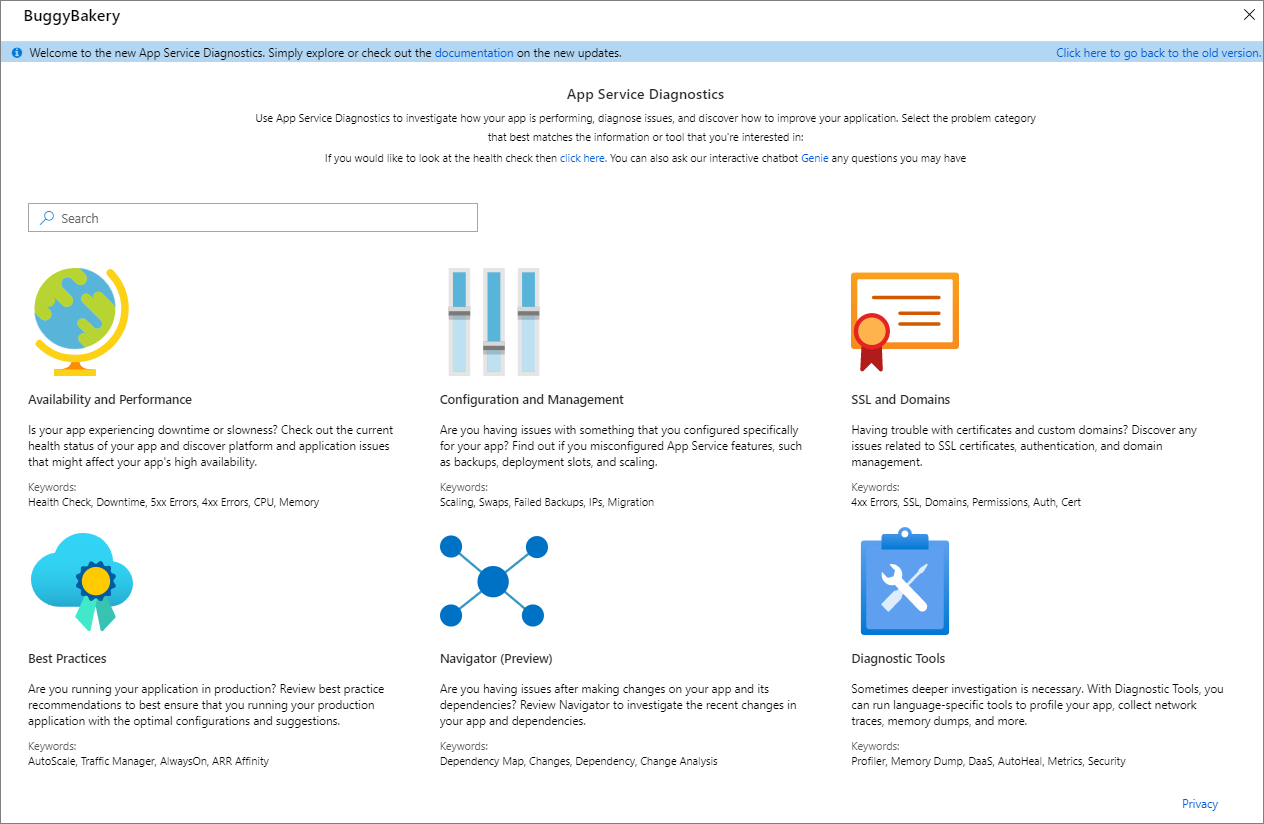
To make it easier for you to discover your application’s issues and helpful insights, we are launching a new experience in App Service Diagnostics.
Discover Issues Faster
The new experience allows you quickly discover issues that your application might be encountering by running health checks for each problem category upfront. Upon clicking on each problem category in the homepage, a series of checks are run, and the results are presented in the overview page.
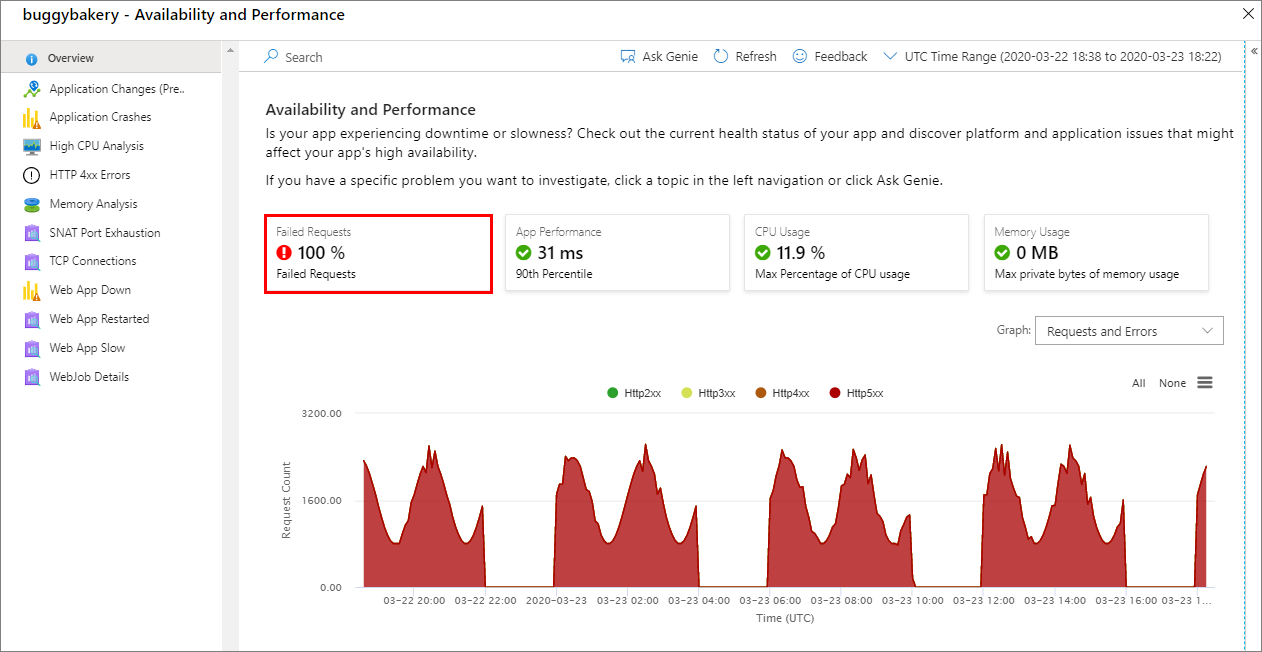
The cards at the top of the overview page show the status of your app by performing pre-selected checks on your application’s backend telemetry. You can click on these cards to further investigate the issue.
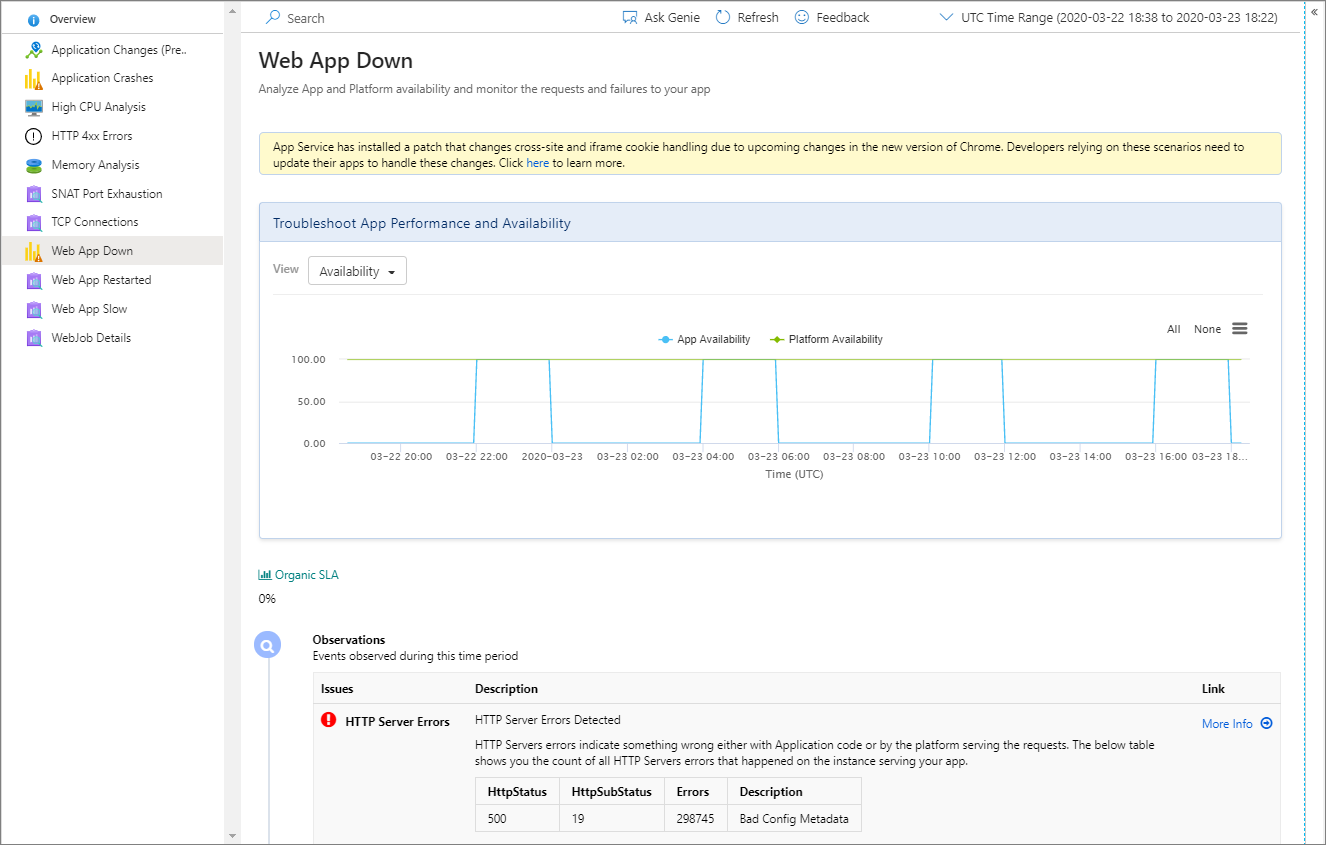
If you already know the problem you want to drill down to, choose a relevant item in the left navigation where you will find more comprehensive checks on different topics.
Interactive Interface: Genie
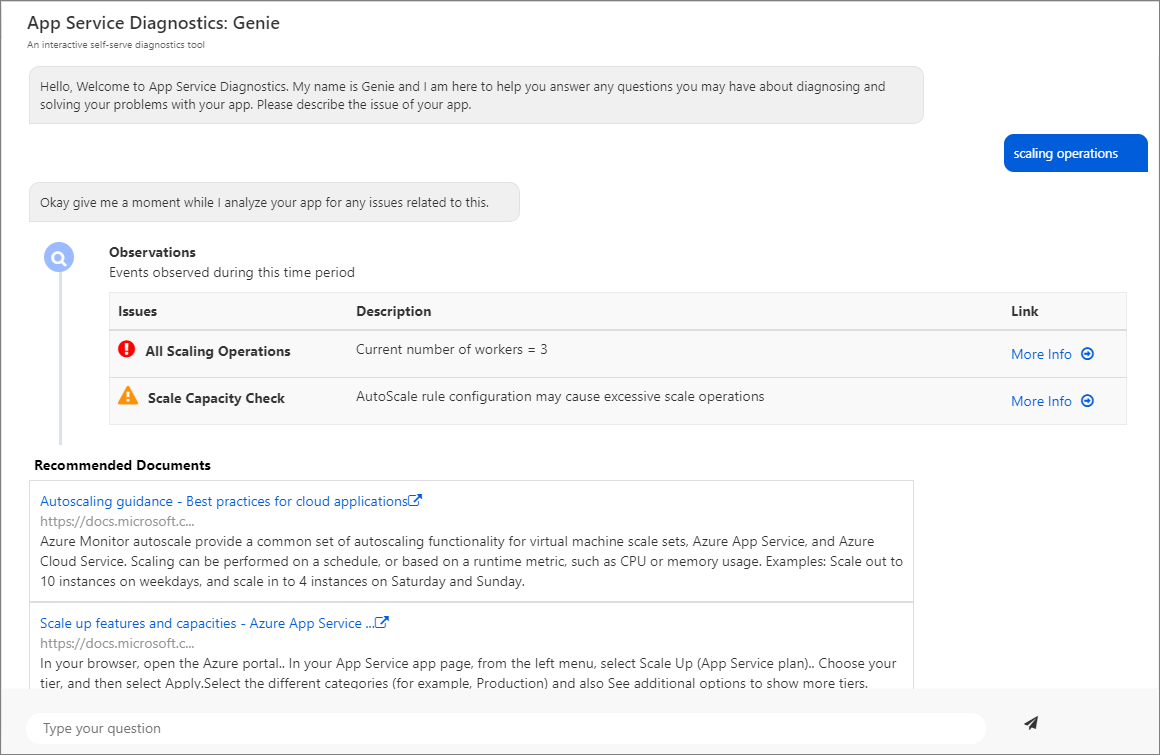
When you are not sure where to begin, or you cannot find the information you are looking for, App Service Diagnostics’ interactive interface, Genie, can help guide you through diagnosing and solving problems of your app.
Click the Ask Genie button at the top of the page to start a chat with our interactive interface, Genie. Type in the issue you are experiencing, and Genie will automatically fetch relevant diagnostics available in App Service Diagnostics and return the results along with relevant documentation found on the web. Genie will share its observation on the issue and list out checks that have succeeded. You can click on More Info to see additional information for each check.
Command Bar
The new experience introduces a command bar control at the top where you will find buttons and controls you often interact with. Below controls are now available in every page with diagnostics.

- Search: Search is now available in every page for you to quickly find and navigate to different diagnostics of your choice.
- Ask Genie: Ask Genie button is available in every page for you to get analysis and documentation results tailored to your issue.
- Refresh: Refresh button is available in every page for you to reload the diagnostics.
- Feedback: Feedback button is available in every page for you to share feedback with the App Service Diagnostics Product team.
- Time Filter: The new time filter now gives options to choose from predefined time range and custom time range using date picker and time picker to more easily filter the diagnostics to your desired time range. The time you select will be honored when you switch to another page. (Current limitations: The end time cannot be more than (current time - 15 minutes) due to limitations on data ingestion; The time range will reset to a 24-hour range once you go back to the homepage.)
What’s Next
For more information on App Service Diagnostics, please visit Azure App Service diagnostics overview.
Feel free to share your feedback or questions about App Service Diagnostics by emailing diagnostics@microsoft.com or posting on UserVoice with “[Diag]” in the title.