Announcing the new change analysis experience in App Service Diagnostics
In a fast-paced development environment, sometimes it is difficult to keep track of all the changes made to your app… let alone pinpoint a change that caused an unhealthy behavior. Change Analysis can help you narrow down on changes made to your app to facilitate the trouble-shooting experience.
Finding Change Analysis
Change Analysis is embedded in App Service Diagnostics’ tiles such as Application Changes and Application Crashes so you can use it concurrently with information from other tiles. For more information on how to navigate to App Service Diagnostics, please visit Azure App Service diagnostics overview.
How to enable Change Analysis
Upon opening a diagnostic report, you will see a message to enable Change Analysis. You can access the Change Analysis Settings by clicking on the Enable Now button.

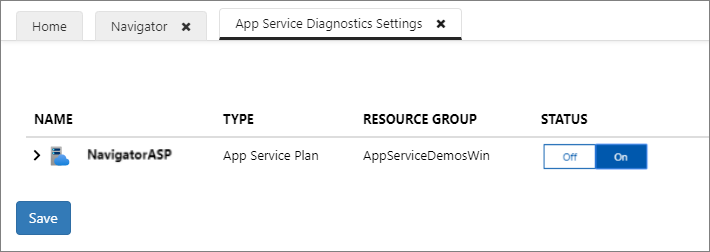
Turn on Change Analysis and click Save to get property changes and code changes for your main web app. [Note: If you are using Change Analysis for the first time, enabling this setting will register Change Analysis Resource Provider on your subscription.] By enabling Change Analysis, your app’s Kudu will trigger a snapshot every 4 hours to capture the changes made between those time intervals.
To disable Change Analysis on your web app, click on Go to Change Analysis Settings in the upper right corner of Change Analysis in the diagnostic report. [Note: Change Analysis Resource Provider is still registered on the subscription of your web app.] To unregister Change Analysis Resource Provider from your subscription, navigate to your subscription, click Resource providers in the left navigation, select Microsoft.ChangeAnalysis, and click Unregister.
Navigating through the change timeline
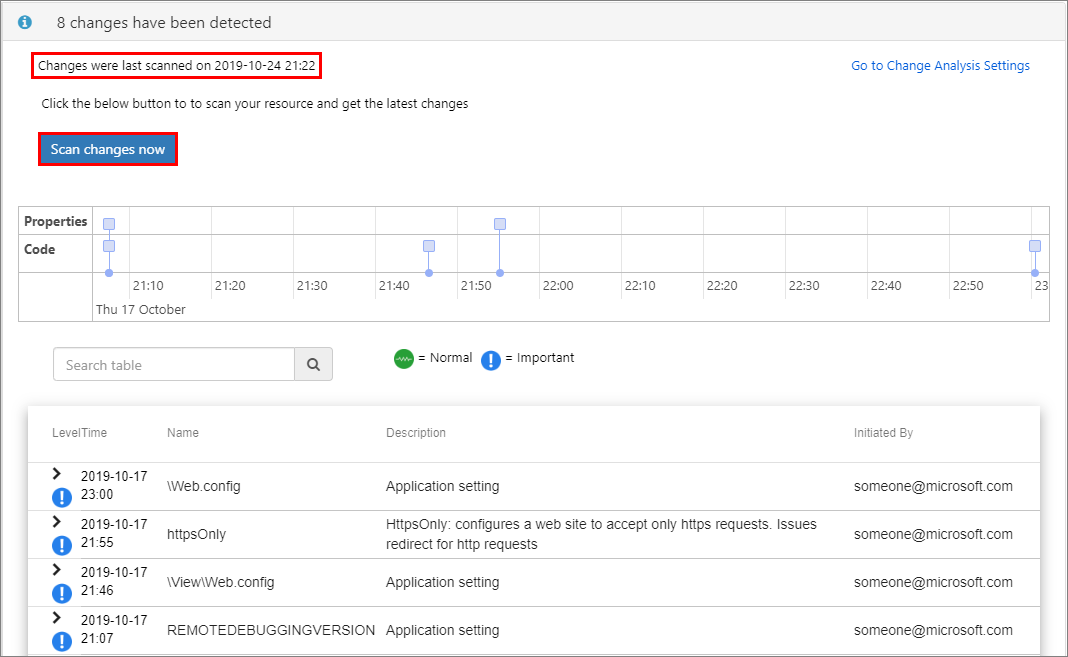
Once Change Analysis is enabled, you will see a change timeline embedded in the diagnostic reports. The change timeline is populated by changes made in the past 24 hours, represented by square boxes on the timeline. You can click on each box to filter for corresponding change(s) in the change chart below. You can also use the search bar to filter for changes that have your search term.

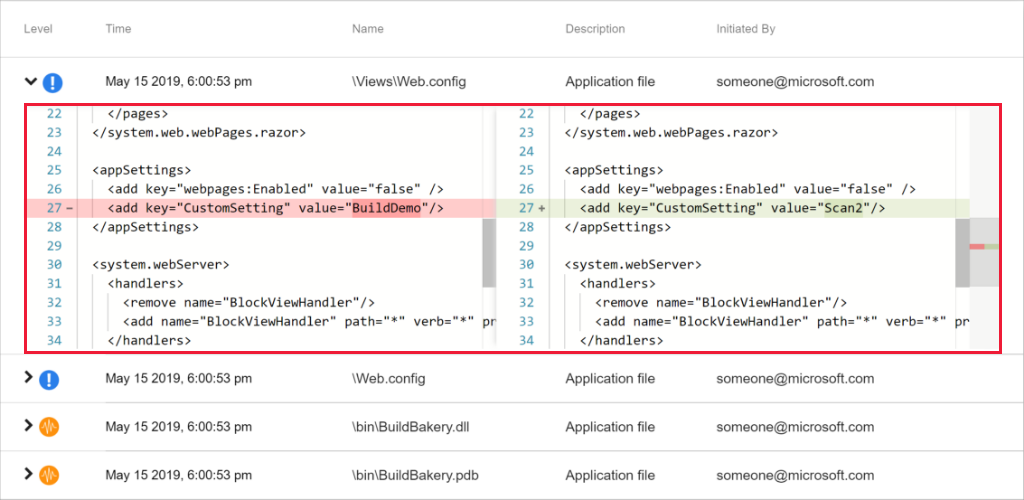
You can also expand each row of change to view the difference between the old values and the new values.
Above the timeline is the last scanned time stamp that shows the last time the timeline was updated. If you wish to find out about changes made after the last scanned time, click Scan changes now. (This process may take few minutes)
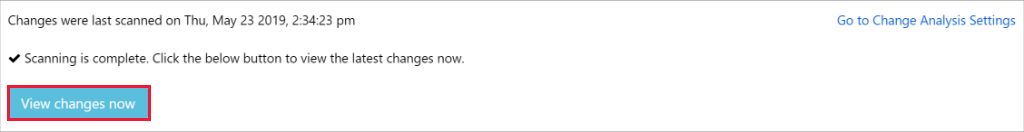
After scanning is complete, you can update the timeline by clicking on View changes now.
Change Analysis in Practice
Now, let’s walk through a scenario where Change Analysis can be helpful. Suppose you have noticed some downtime in your app caused by a changed App Setting, but you do not know what has caused the issue. First, open a diagnostic report with Change Analysis like Application Crashes. Browse through the change timeline to see if there were any changes made before the app started crashing. If you do not find any changes on the timeline that could be related to the issue, click Scan changes now to update the timeline with the most recent changes. After the scanning completes, click View changes now to populate the timeline with the new changes. You notice there is one change that occurred right before the app started crashing. Expand the new change to view the differences. You may find that you accidentally deleted the connection string when you last made your code changes.
Used in tandem with other information, Change Analysis can serve as a powerful tool for diagnosing and solving problems with your web app.
Feel free to post any questions about Change Analysis on the MSDN Forum.