App Service Diagnostics Comes to Functions, ASE, and More!
Jennifer Lee (MSFT)
Have you ever had issues with an unhealthy web app? Last year, we launched App Service Diagnostics, an intelligent and guided troubleshooting experience that points you and the right direction to diagnose and solve issues of your web app (without having to configuring anything special to enable this feature!). Since then, we’ve read all the feedback that you all have given, and have added new capabilities to make this feature even more robust and insightful, all without you have to configure anything special.
 Our newest tile shortcuts are in the Management and Configuration problem category. You can now validate your swap operations, use our "Check Best Practices for Prod Apps" tile shortcut to make sure that you're configuring everything optimally for production workloads, and even check if your autoscaling operation is running correctly.
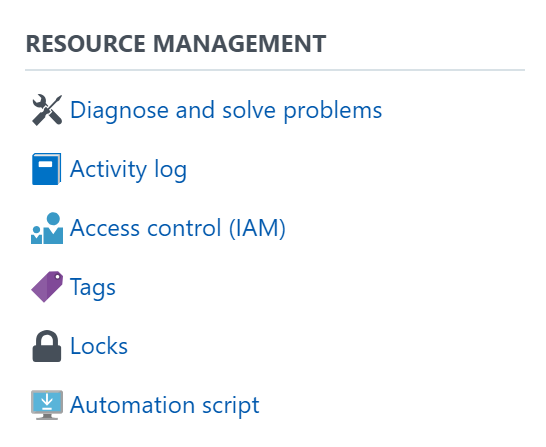
 For Azure Functions, navigate to the Functions Portal. Click on the Platform Overview tab, and then click on Diagnose and solve problems under the Resource Management category.

 Click on Change Stack to view the Diagnostic Tools relevant to your stack of interest.
 Next time you’re having issues with an unhealthy web app, App Service Environment, or Function, try out App Service Diagnostics to talk to Genie to get guidance on how to cure for your unhealthy web app. If you haven’t already, definitely leverage App Service Diagnostics to run a health checkup for piece-of-mind or drill-down to your specific issue that’s happening to your app.
New Tile Shortcuts for Management and Configuration
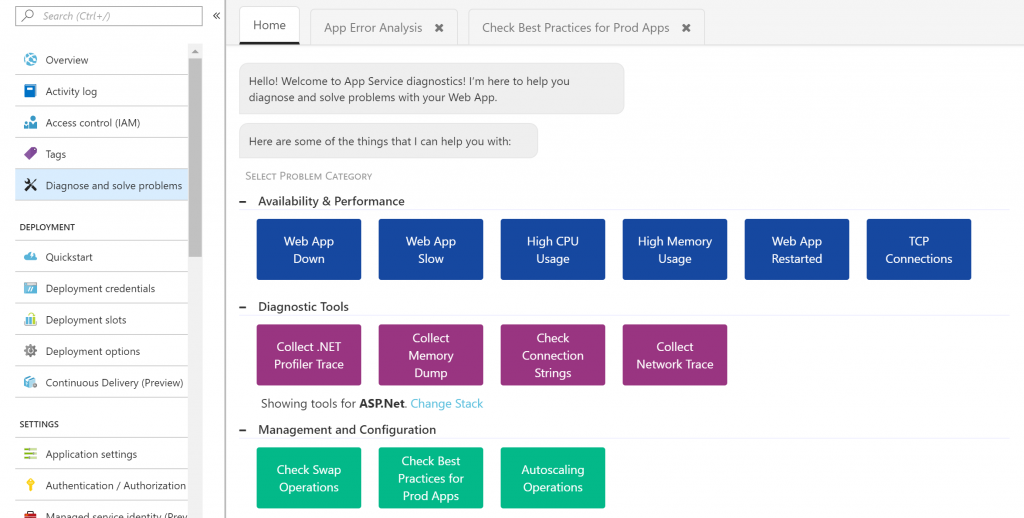
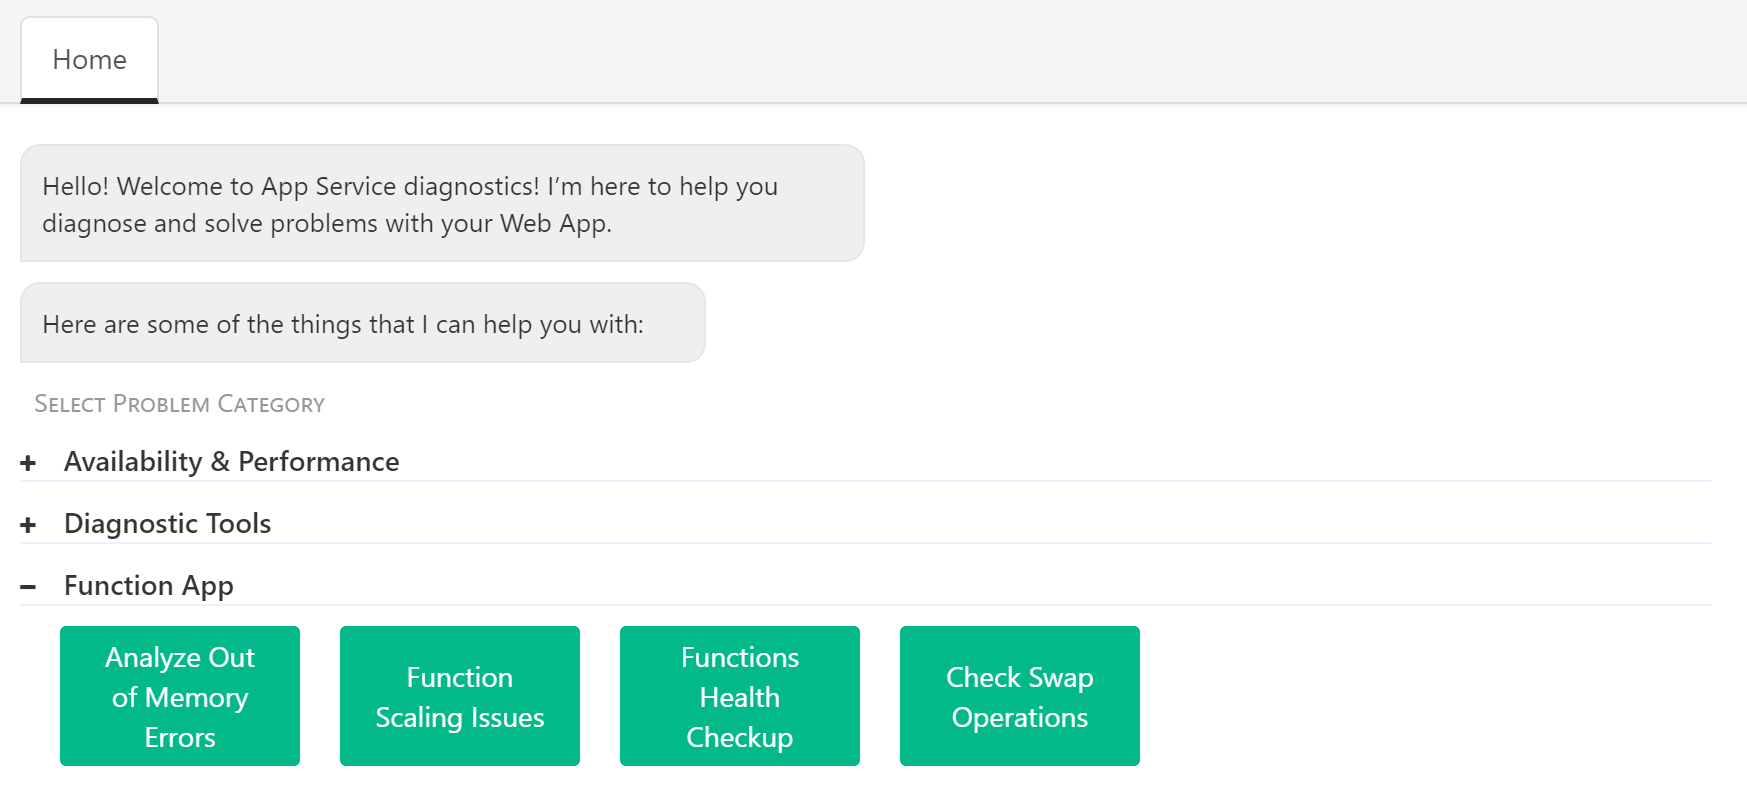
When you visit App Service Diagnostics (by clicking on Diagnose and solve problems in the left-hand menu), you will be greeted by Genie, who will point you in the right direction to start troubleshooting your issue. If you have some experience or know a little bit about the nature of the issue, you should select one of the tile shortcuts that match your problem category. We have now added parent problem categories, such as Availability and Performance, to help keep the tile shortcuts organized. If you don’t know where to start, Genie will also allow you to run a health checkup, which will run several checks on our backend and intelligently highlight where you’re experiencing an issue. Our newest tile shortcuts are in the Management and Configuration problem category. You can now validate your swap operations, use our "Check Best Practices for Prod Apps" tile shortcut to make sure that you're configuring everything optimally for production workloads, and even check if your autoscaling operation is running correctly.
App Service Diagnostics is now live for…
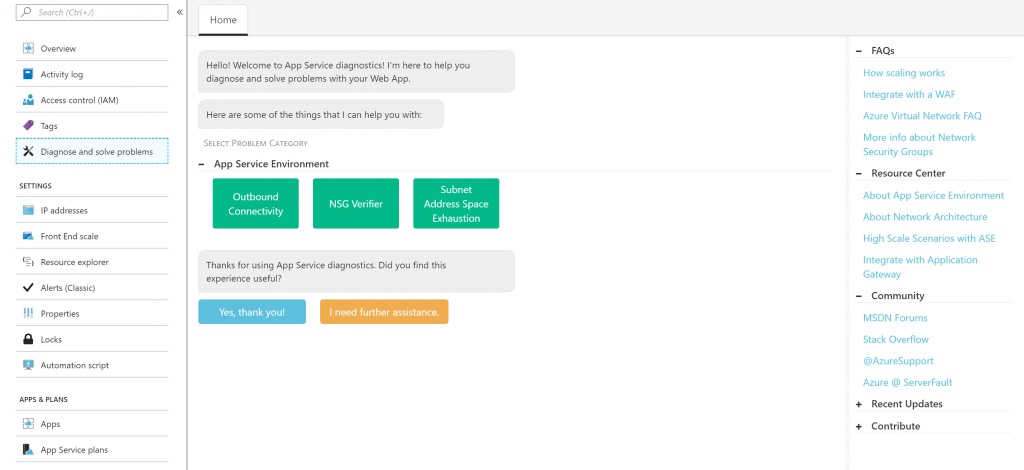
Before, only web app users could get help from App Service Diagnostics. Today, we are excited to announce that you can now leverage App Service Diagnostics to diagnose and troubleshoot issues with not only your Windows web apps, but also your web apps on Linux, App Service Environment, and even Azure Functions. For each service, we have tailored the troubleshooting problem categories to cater to the most common scenarios that customers have been looking to diagnose and troubleshoot. For example, for Functions, you can now identify scaling issues and analyze functions in error. For App Service Environment, we know that our customers have quite a few questions about networking, so we added a network security group verifier and also a tile shortcut to validate outbound connectivity from your ASE. For Windows and Linux web apps, navigate to the App Service Portal. Click on Diagnose and solve problems on the left-hand menu. For App Service Environments, navigate to the App Service Environment Portal. Click on Diagnose and solve problems on the left hand menu. For Azure Functions, navigate to the Functions Portal. Click on the Platform Overview tab, and then click on Diagnose and solve problems under the Resource Management category.
New Diagnostic Tools
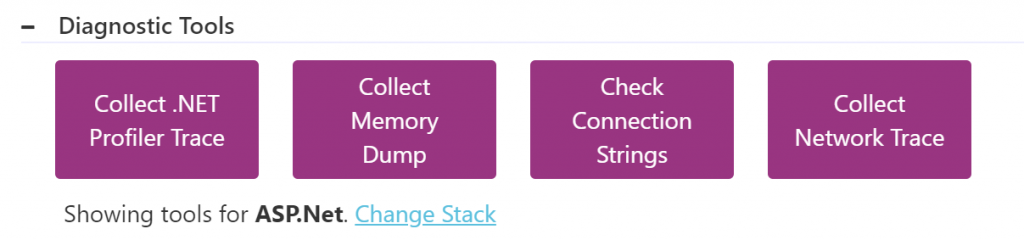
For our more advanced users who are familiar with troubleshooting web app issues, we released a new set of tile shortcuts under Diagnostic Tools (a new parent problem category). These Diagnostic Tools are stack specific and are here to help you dive deeper in investigating issues related to your application code, root causes for slowness, connection strings, and even issues with connecting to a remote server. As always, all of these tools have actionable documentation, which means not only do we tell you a little bit about what the tool does, but also allow you to perform that action right in App Service Diagnostics.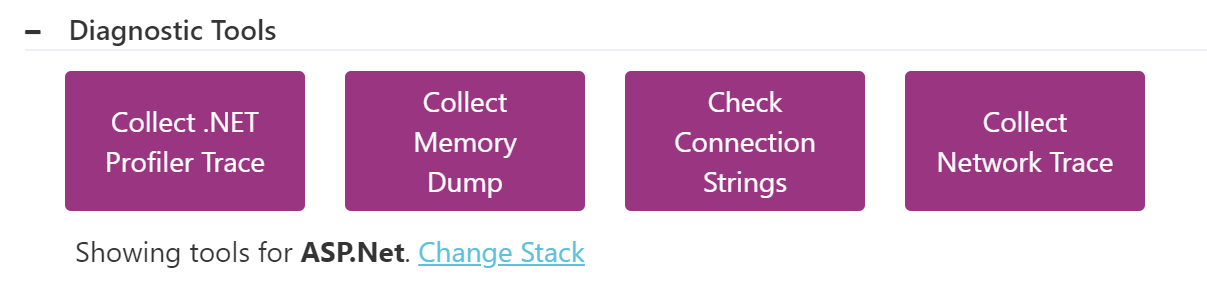 Click on Change Stack to view the Diagnostic Tools relevant to your stack of interest.
Integration with Application Insights
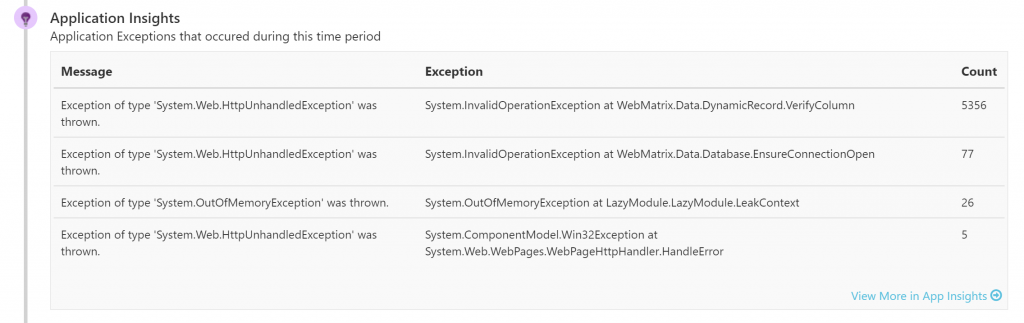
Another insight that we’ve heard from our App Service Diagnostics users is about troubleshooting issues in their application code. To help with this beyond distinguishing between platform and application issues, we have integrated with Application Insights to provide code-level insights in context to availability downtimes. Application Insights is Azure’s application performance management and analytics tool that allows you to monitor your application. Although you do need to configure Application Insights to enable it for your application, once you do, you will be able to see common exceptions that your app is throwing and dependencies that are causing issues under Web App Down and Web App Slow. These are all correlated to the downtimes that you’ve selected via the orange bar. Hopefully, you’ll be able to recognize your application code issues from the commonly occurring exceptions, but if not, we deep link into Application Insights for more context.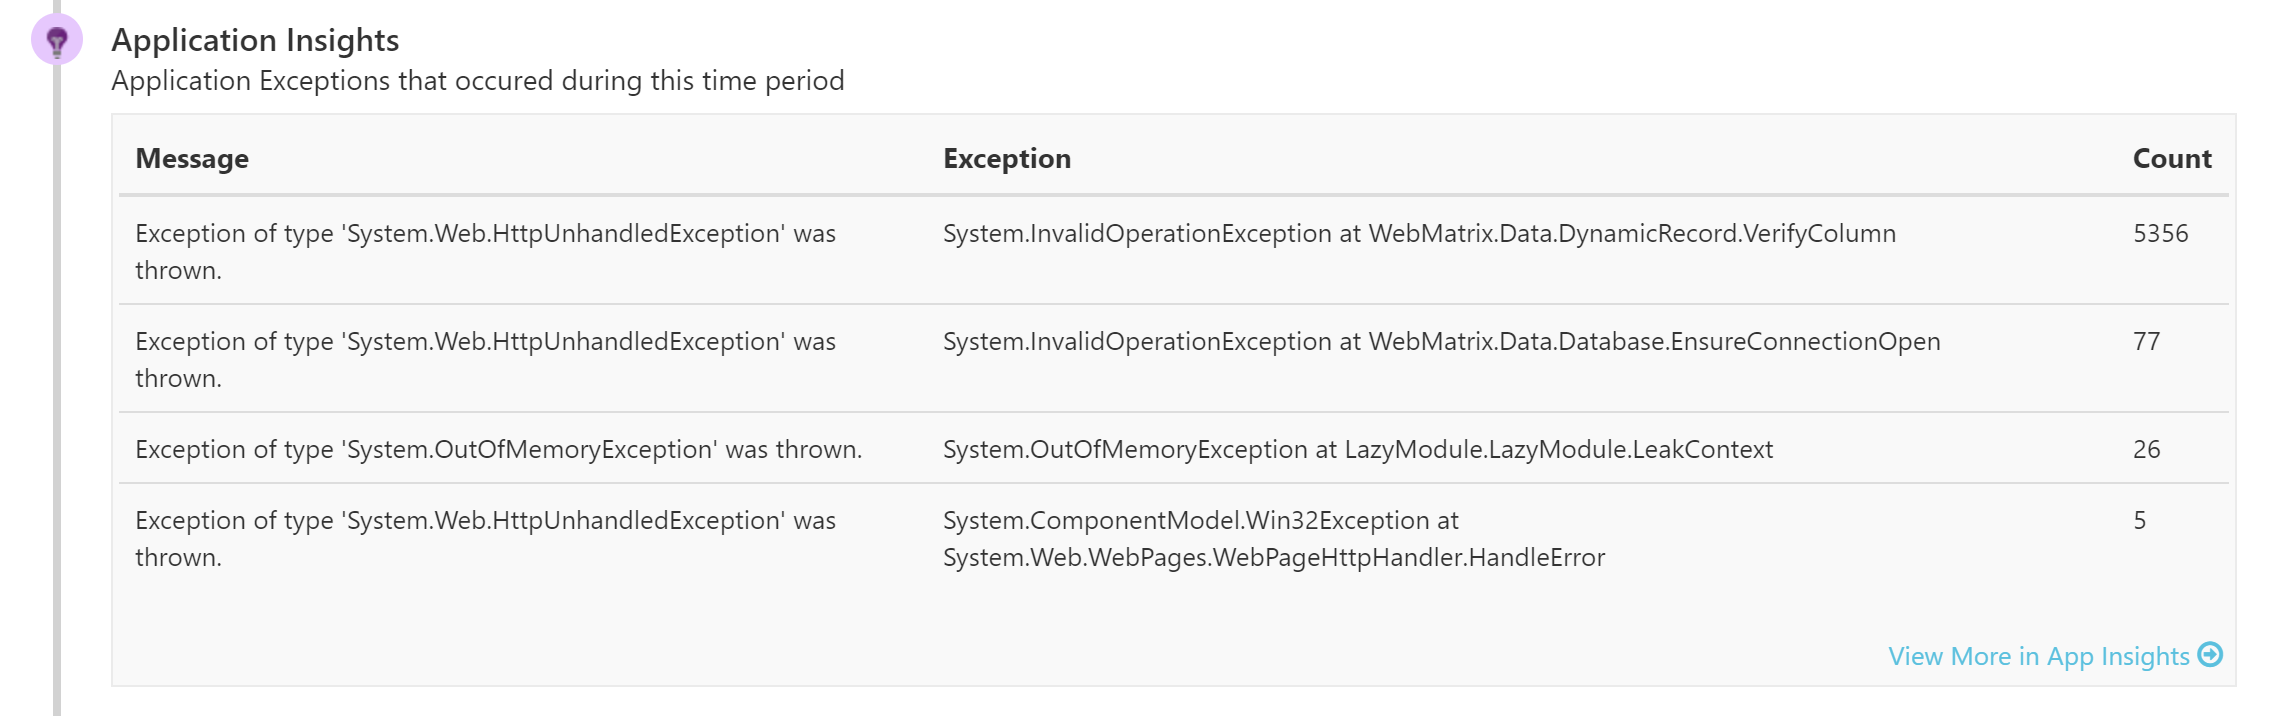 Next time you’re having issues with an unhealthy web app, App Service Environment, or Function, try out App Service Diagnostics to talk to Genie to get guidance on how to cure for your unhealthy web app. If you haven’t already, definitely leverage App Service Diagnostics to run a health checkup for piece-of-mind or drill-down to your specific issue that’s happening to your app.