Deep Dive into TCP Connections in App Service Diagnostics
Jennifer Lee (MSFT)
Note: This information below only applies to Windows web apps on App Service.
Recently, we released the TCP Connections tile shortcut in App Service diagnostics. In this blog, we will walk through the implications of having unhealthy TCP Connections and how you can analyze them using App Service diagnostics.
 Upon opening the TCP Connections, you can quickly see three levels of data: TCP Connections, Connections Rejections, Open Socket Handles. If it’s healthy, there will be a green checkmark. If it’s unhealthy, there will be an orange exclamation mark.
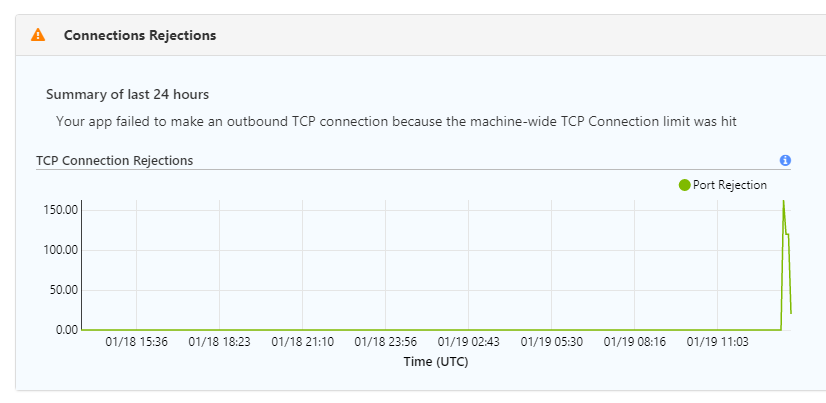
 Connections Rejections
Check if there are any port rejections. If your web app failed to make an outbound TCP connection because the machine-wide TCP Connection limit was hit, we will highlight that in the Summary and associated graph.
Connections Rejections
Check if there are any port rejections. If your web app failed to make an outbound TCP connection because the machine-wide TCP Connection limit was hit, we will highlight that in the Summary and associated graph.
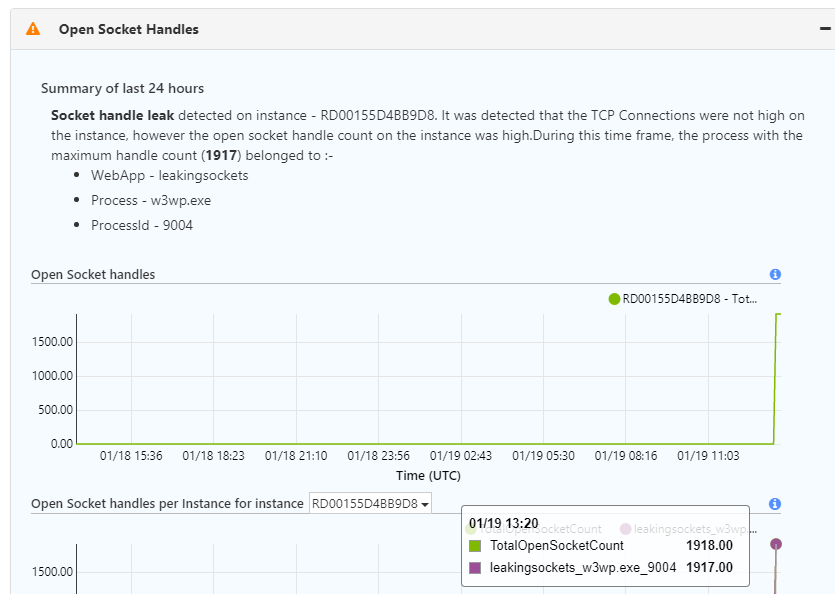
 Open Socket Handles
Here, you can determine which web app is causing a socket leak if you have multiple web apps in your App Service Plan.
If your web app has leaking connections, you will see the process name, process ID, site name, and number of open handles. We will highlight the process that is causing the maximum damage in the Summary.
Open Socket Handles
Here, you can determine which web app is causing a socket leak if you have multiple web apps in your App Service Plan.
If your web app has leaking connections, you will see the process name, process ID, site name, and number of open handles. We will highlight the process that is causing the maximum damage in the Summary.
Why should you care about TCP Connections?
Let's say that you have created two web apps on the App Service Plan, and both are breaking. An example of when TCP Connections can cause this behavior in your web apps could be that one app is leaking a lot of socket handles and ends up hitting the machine wide TCP Connection limit. App Service enforces limits on the number of outbound connections that can be outstanding at any given point in time. When web apps run into these connection limits, they will start intermittently failing because calls to those remote endpoints will fail, causing downtime. You’ll frequently see errors like the following: “An attempt was made to access a socket in a way forbidden by its access permissions aaa.bbb.ccc.ddd.” The maximum connection limits are the following:- 1,920 connections per B1/S1/P1 instance
- 3,968 connections per B2/S2/P2 instance
- 8,064 connections per B3/S3/P3 instance
- 16,000 connections per I1/I2/I3 instance
TCP Connections Walkthrough
To examine your TCP Connections more closely, click on the "Diagnose and solve problems" tab in the left hand menu. Then, select the "TCP Connections" tile shortcut.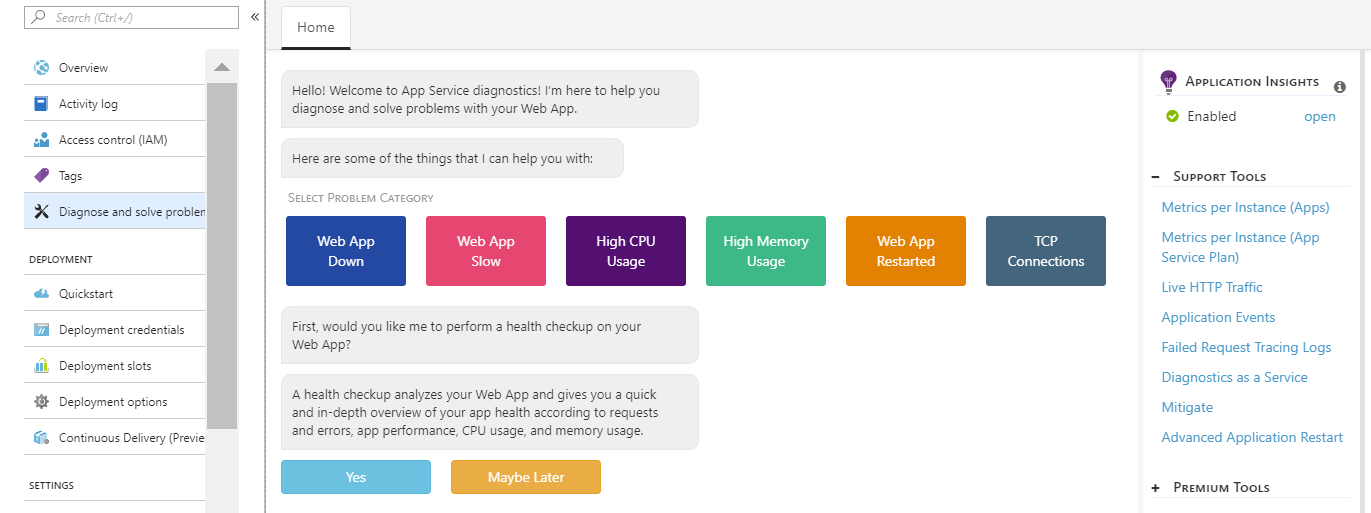 Upon opening the TCP Connections, you can quickly see three levels of data: TCP Connections, Connections Rejections, Open Socket Handles. If it’s healthy, there will be a green checkmark. If it’s unhealthy, there will be an orange exclamation mark.
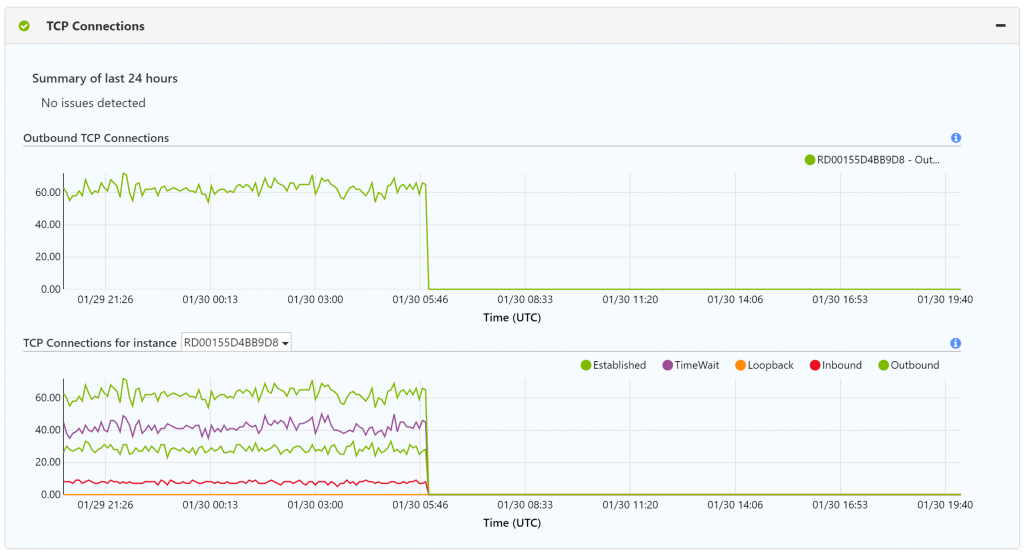
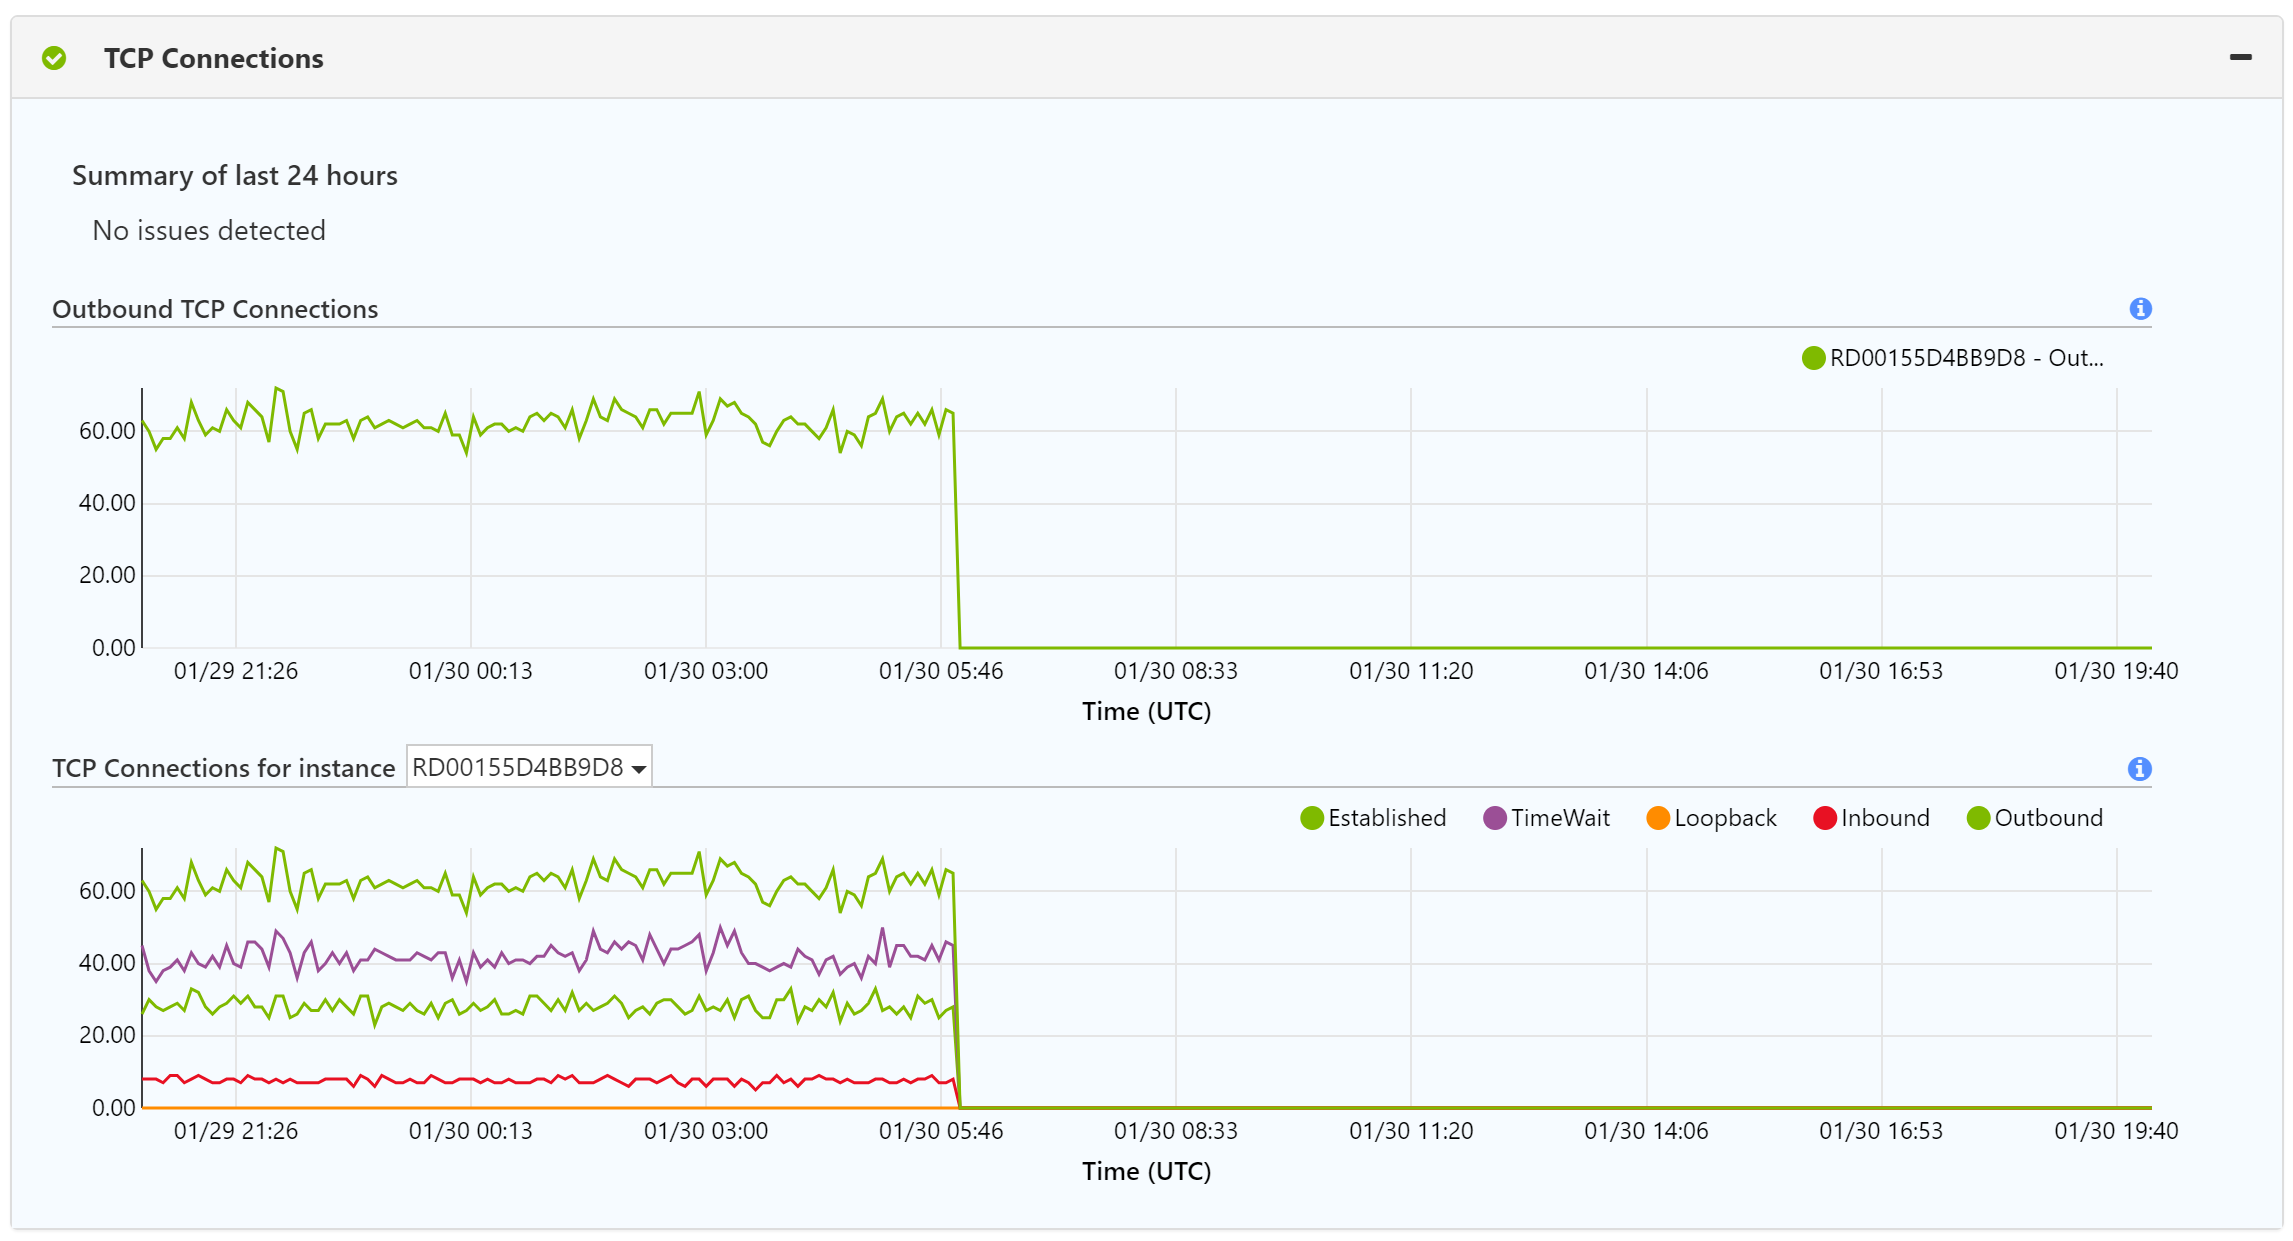
TCP Connections
Here, you can monitor the total connections on your instances and the state of the connections, which include TIME_WAIT, ESTABLISHED etc. If your web app has high outbound connections (> 1500 outbound connections), you will see the IP addresses’ first three octets and the port number in the Summary. By examining the port number, you can determine what type of remote service is causing the high outbound connections.| Port Number | Service |
| 1433 | SQL |
| 80 or 433 | Web Service |
 Connections Rejections
Check if there are any port rejections. If your web app failed to make an outbound TCP connection because the machine-wide TCP Connection limit was hit, we will highlight that in the Summary and associated graph.
Open Socket Handles
Here, you can determine which web app is causing a socket leak if you have multiple web apps in your App Service Plan.
If your web app has leaking connections, you will see the process name, process ID, site name, and number of open handles. We will highlight the process that is causing the maximum damage in the Summary.
Connections Rejections
Check if there are any port rejections. If your web app failed to make an outbound TCP connection because the machine-wide TCP Connection limit was hit, we will highlight that in the Summary and associated graph.
Open Socket Handles
Here, you can determine which web app is causing a socket leak if you have multiple web apps in your App Service Plan.
If your web app has leaking connections, you will see the process name, process ID, site name, and number of open handles. We will highlight the process that is causing the maximum damage in the Summary.