Introducing Azure App Service Support Center
Apurva Joshi (AJ)
 There are many reasons why a web app could experience a downtime – for instance, platform service outages, application code bugs, CPU or memory exhaustion, new deployment having unknown bugs, app crashes, faulty VM instances, abnormal recycles, port or socket exhaustions, exceptions in code, thread exhaustions and many more.
In this initial release of Azure App Service Support Center, we are optimizing for the following scenarios
There are many reasons why a web app could experience a downtime – for instance, platform service outages, application code bugs, CPU or memory exhaustion, new deployment having unknown bugs, app crashes, faulty VM instances, abnormal recycles, port or socket exhaustions, exceptions in code, thread exhaustions and many more.
In this initial release of Azure App Service Support Center, we are optimizing for the following scenarios
“Why was my Web App down?”
“How do I fix it?”
These are the common questions with no easy answers. Wouldn’t it be nice if solutions on what to do next are readily available? The Azure App Service Support Center is the answer. You can access it via “Diagnose and solve problems” in the web app settings blade.
There are many reasons why a web app could experience a downtime – for instance, platform service outages, application code bugs, CPU or memory exhaustion, new deployment having unknown bugs, app crashes, faulty VM instances, abnormal recycles, port or socket exhaustions, exceptions in code, thread exhaustions and many more.
In this initial release of Azure App Service Support Center, we are optimizing for the following scenarios
- Service outages, platform health issues
- Abnormal CPU usage
- Abnormal memory usage
- Application code issues
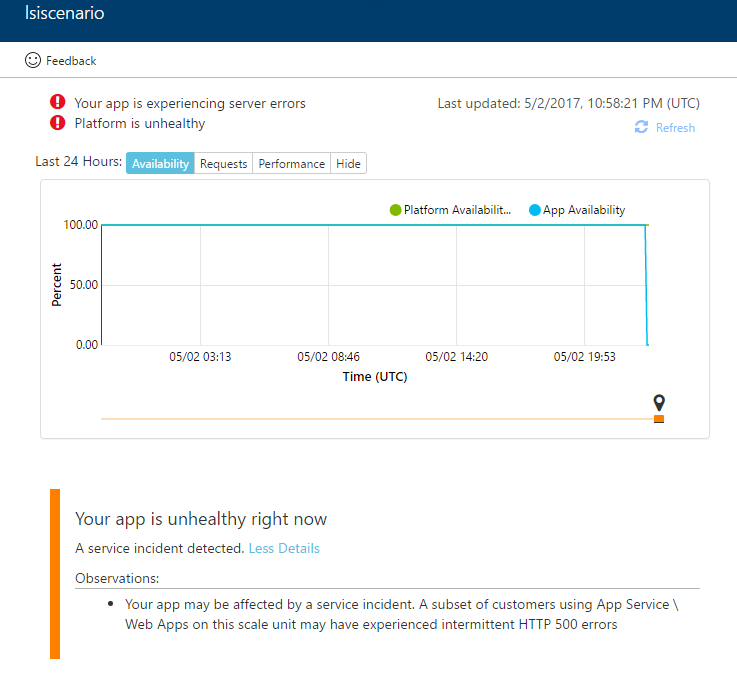
Platform Incidents
In the case of a platform incident, your app may be affected. In such cases, Microsoft engineers will have already been engaged to resolve the issue. The “Diagnose and Solve problems” blade will highlight this scenario right away making isolating the issue obvious. Screenshot below is an example of such an incident.
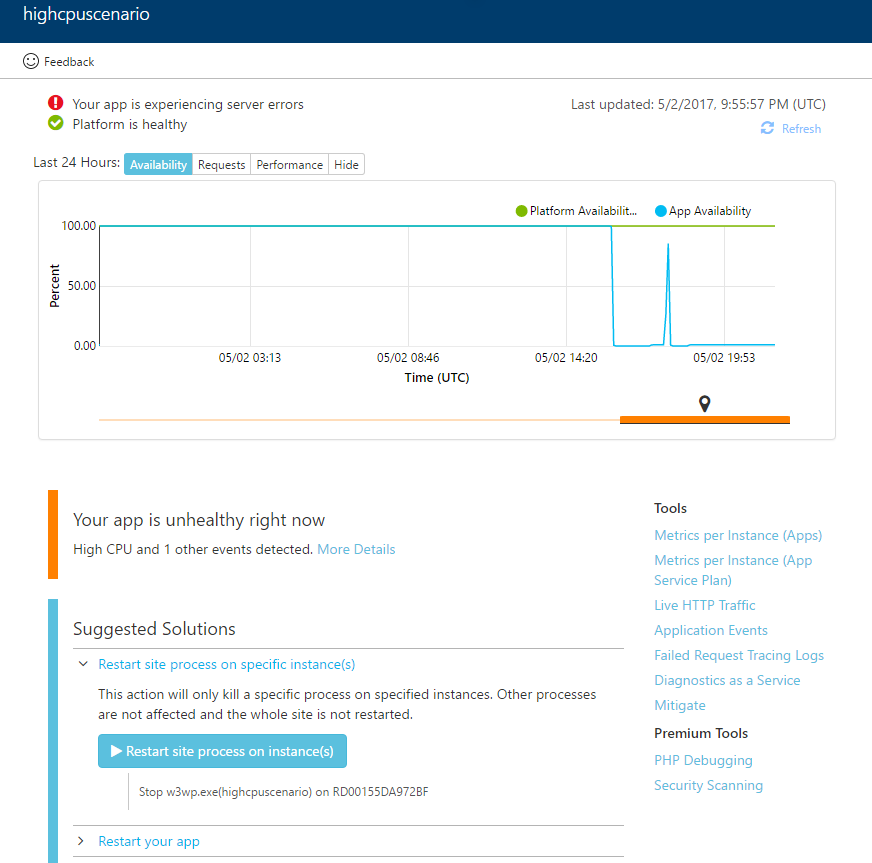
CPU and Memory Issues
High CPU or Memory usage can cause your web app to have downtime. In this case, you can identify the specific instances and web apps consuming resources. Solutions for these issues include- Advanced application restart – restart a specific web app process on a specific instance
- Restarting the web app – restart the web app on all instances
- Scale up – scale up to instances with larger memory and more CPU
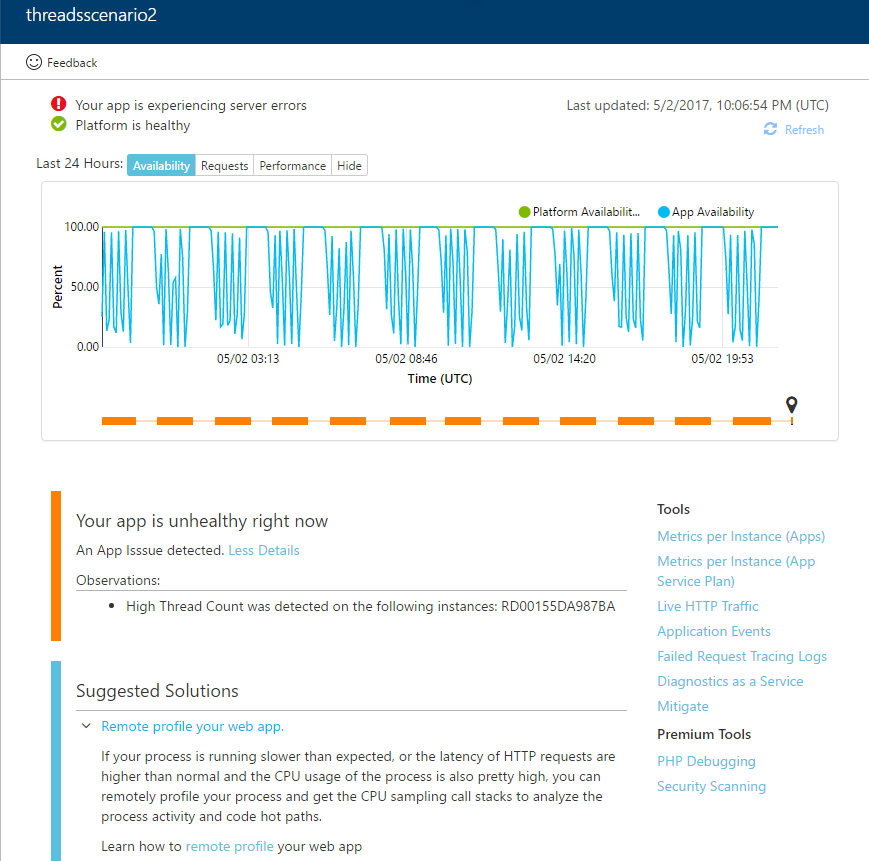
Application code issue
Often, issues within the application code are the cause of downtime. These could include bugs, race conditions, external dependencies or your web app throwing exceptions. The failed requests log analysis, threads analysis detectors can determine when failures are a result of an application issue or a result of a platform issue. As instructed in the screenshot below, remote profiling is the best way to troubleshoot application specific issues. Screenshot below is an example of such an incident.
How does it all work?
Under the covers, the user experience is powered by a big data solution, where we mine large amounts of platform and application data to perform intelligent pattern analysis algorithms and surface most relevant observations and problems. Internally we refer to these algorithms that perform analysis as “detectors”. Each detector analyzes the data and determines the appropriate solutions to fix your problem when it is happening. The “Solution” option will be displayed when our detectors have determined that there is a mitigation step you could take to recover your web app. In addition, the troubleshoot section contains other mitigation options as well as specific troubleshooting tools. The goal of this new self-service diagnostics blade is to answer the questions Why was my Web App down? and How do I fix it? The detectors will provide insights and solutions that enable users to quickly mitigate and diagnose any issues. As you continue to use self-serve diagnostics, we will be adding new detectors and improving the existing ones with richer data and solutions that are more precise.Full List of Detectors
- Service Health - This detector looks at ongoing and past service incidents. Whenever this happens, Microsoft engineers are engage very quickly and start working to solve the problem
- CPU Analysis - This detector can identify instances where there is high CPU usage. It can also determine the specific site process within the app service plan that is using the most CPU.
- Memory Analysis: This detector can identify instances where there is high Memory usage. It can also determine the specific site process within the app service plan that is using the most Memory.
- Failed Requests Analysis: This detector looks for requests with 5xx http status code, detailed error codes and win32 status codes. It tracks the request’s journey all the way to your application code. If errors are happening purely in application layer (not in platform pipeline) this detector provides suggestions on debugging application code
- Site deployments: This detector looks for web and kudu deployments as a possible cause for downtime.
- Site Crashes: This detector looks for abnormal terminations (crashes) of w3wp (application code) processes.
- Worker Availability: This detector gives you insights into whether the problem is happening on a specific instance, which could point to a resource constraint or another problem with that instance alone.
- Process Restarts: This detector considers possible reasons that could have caused the application code to restart (w3wp process). Process restarts can cause transient availability issues. Reasons for process restart include: user initiated, config updates, auto heal, resource contentions, etc.
- Site quota exceeded: This detector indicates when failures are a result of a site in Free or Shared SKU exceeding a quota. When sites exceeded quota limits, the platform turns it off temporarily.
- Port and Socket Exhaustion: This detector figures when an outbound network connection is rejected because of port exhaustion.
- Thread and Handle usage: This detector detects if there is abnormally high usage of threads or handles that could affect application’s uptime.