Module 5: Lab 1 - Container Insights
Here, in this lab, as part of Module 5: Operate and Monitor, we will look at Container Insights.
Before attempting this lab, please be sure to complete the items described in the Getting Started Section.
Container Insights
Container Insights is a feature designed to monitor the performance of container workloads deployed to the cloud. It gives you performance visibility by collecting memory and processor metrics from controllers, nodes, and containers that are available in Kubernetes through the Metrics API. After you enable monitoring from Kubernetes clusters, metrics and Container logs are automatically collected for you through a containerized version of the Log Analytics agent for Linux. Metrics are sent to the metrics database in Azure Monitor. Log data is sent to your Log Analytics workspace.
Enable Container Insights
Container Insights is designed to store its data in a Log Analytics workspace. You can let the enablement process create a Log Analytics workspace for this purpose, or if you already have a workspace, you can use that one. See Designing your Azure Monitor Logs deployment to learn more about best practices for Log Analytics.
Here, let’s begin by creating a Log Analytics workspace in order to support Container Insights. Right now, we will do this using the Azure CLI. Later, we will augment our Bicep templates in order to perform this same work.
az monitor log-analytics workspace create --resource-group $resourceGroupName --workspace-name $workspaceName
WORKSPACEID=$(az monitor log-analytics workspace show --resource-group $resourceGroupName --workspace-name $workspaceName --query id -o tsv)
Now, let’s augment our cluster and enable Container Insights.
az aks enable-addons -a monitoring --resource-group $resourceGroupName --name $clusterName --workspace-resource-id $WORKSPACEID
Let’s verify that the Container Insights agent and solution were successfully deployed. First, we’ll verify the daemonset was deployed:
kubectl get daemonset ama-logs --namespace=kube-system
The output should resemble the following:
NAME       DESIRED   CURRENT   READY   UP-TO-DATE   AVAILABLE   NODE SELECTOR   AGE
ama-logs   3         3         3       3            3           <none>          45m
Next, we’ll verify that the deployment was created:
kubectl get deployment ama-logs-rs --namespace=kube-system
The output should resemble the following:
NAME          READY   UP-TO-DATE   AVAILABLE   AGE
ama-logs-rs   1/1     1            1           47m
Using Container Insights
Now that Container Insights has been enabled, we can turn our attention to the Azure Portal and see the results of our labor. (It may take a few minutes for data to flow into the Log Analytics workspace.)
Within the Portal, navigate to the cluster. Once inside the cluster, check out the Monitoring section of the menu system and open the Insights tab. Here, you will be presented with a nice visualization of your cluster, showing node count, CPU, and memory utilization. You’ll also a graph showing the active pod count. These views are dynamic. You can change the time range, or even look at live data from the cluster.
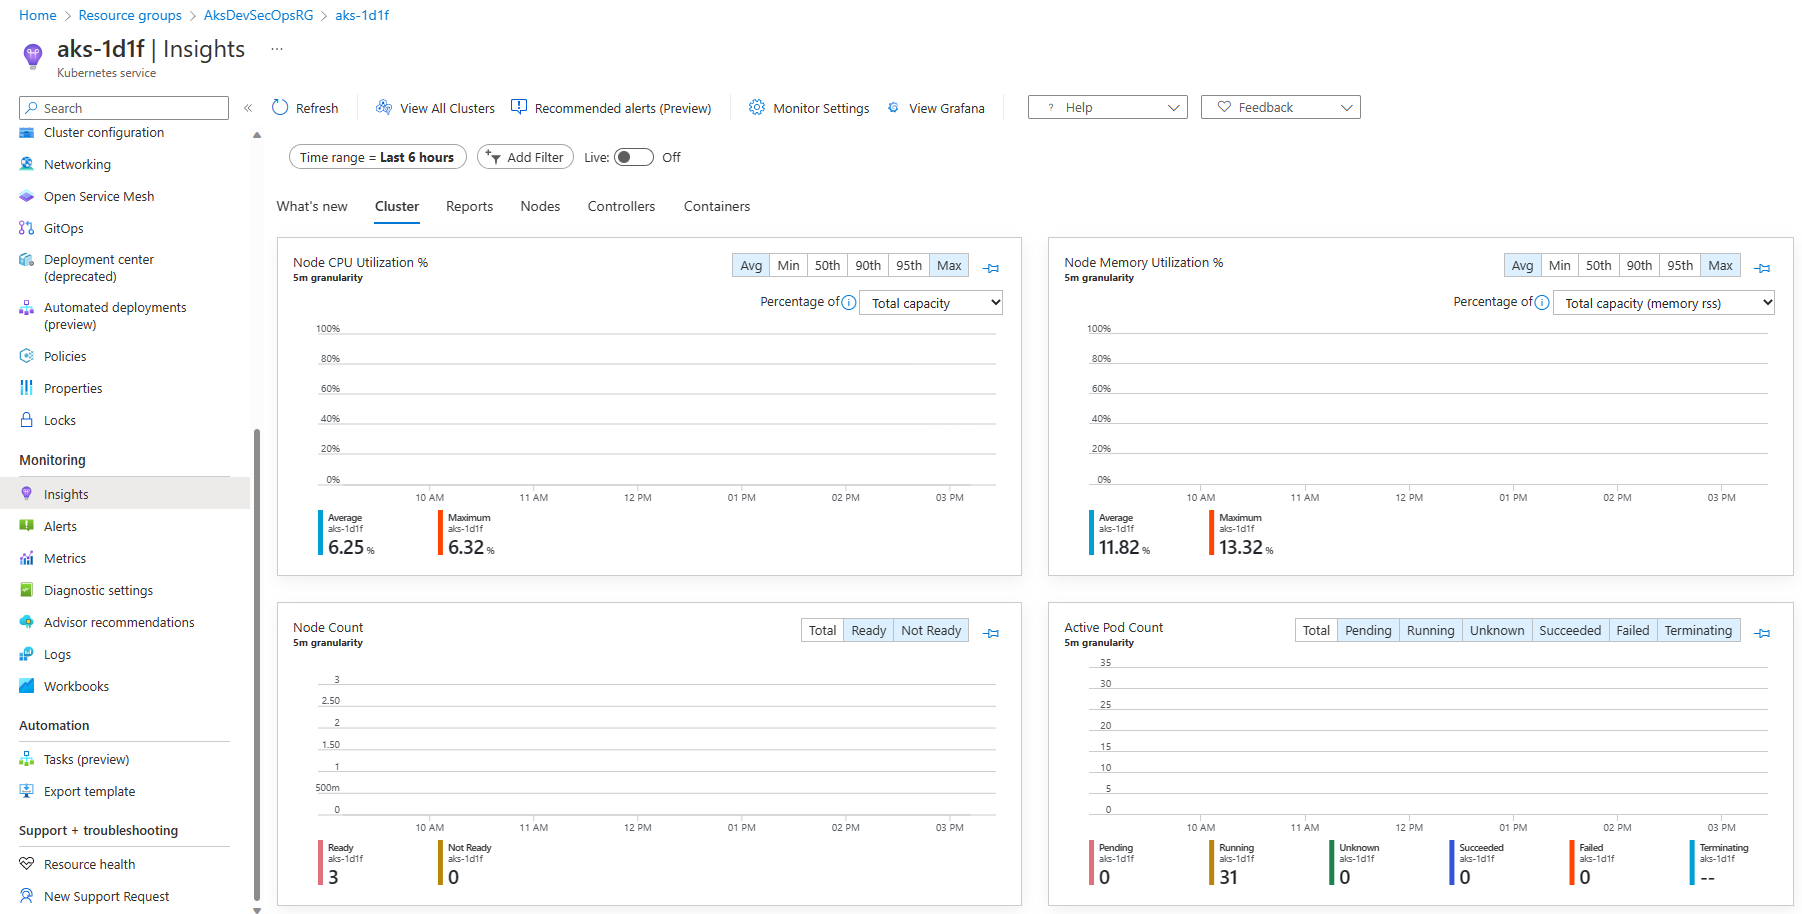
Aside from the Cluster view within the Insights tab, you will find lists that desscribe your cluster’s nodes, controllers and containers. You will also find a tab dedicated to reports. These data driven reports provide additional insight into your cluster nodes, resource utilization, networking, and billing.
Now, let’s take a moment and test Container Insights by applying some load to our cluster.
First, let’s create a namespace to hold our work.
kubectl create namespace containerinsightstest
kubectl config set-context --current --namespace containerinsightstest
Next, let’s run an interactive bash Pod on the cluster:
kubectl run test-shell --rm -i --tty --image ubuntu -- bash
Now, within the test-shell Pod, update, install and run stress:
apt update
apt install stress
stress -c 10
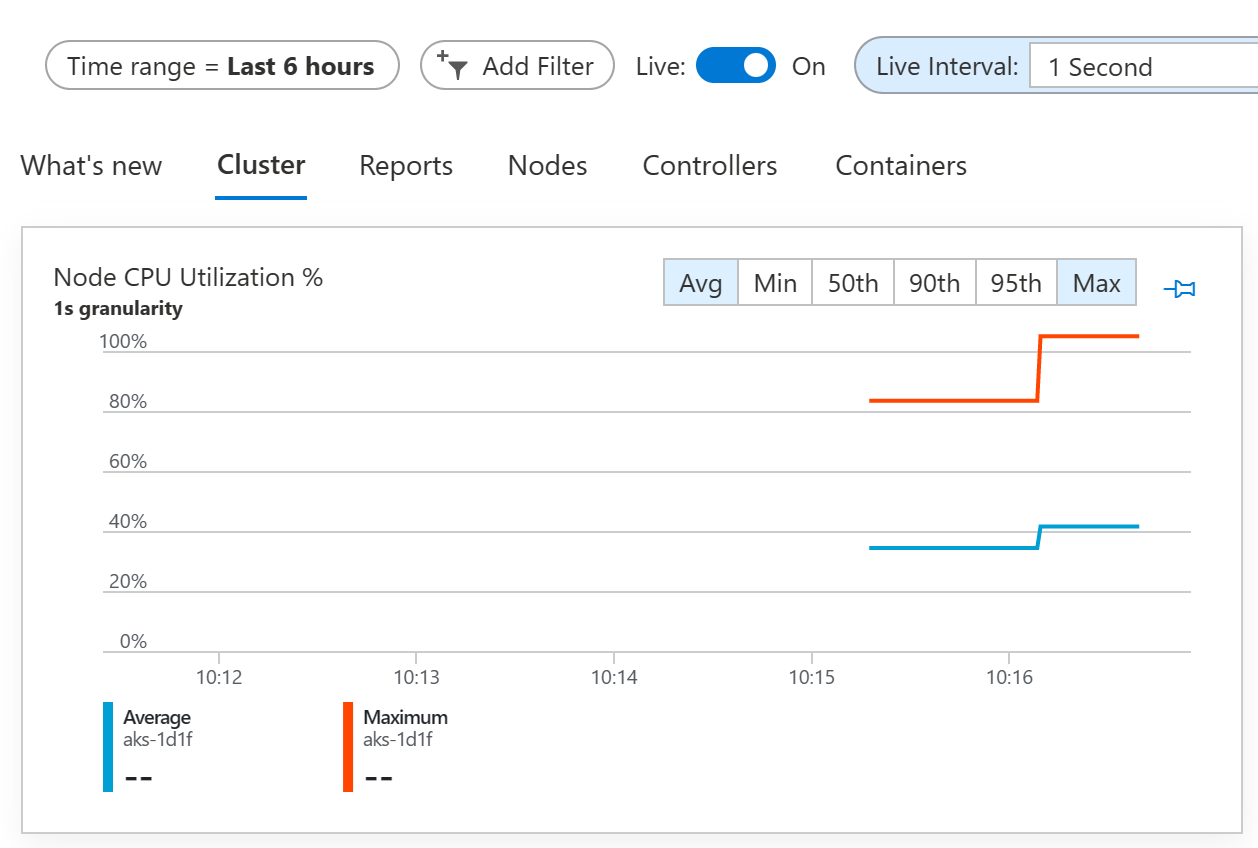
The above commands will generate a sustained CPU spike in the cluster. Return to Container Insights and view the Cluster tab. Turn on Live updates and you should see the Node CPU Utilization graph jump as a result of the stress command.
Note: it may take several minutes in order for the visualization to update and show the increased utilization of your cluster.
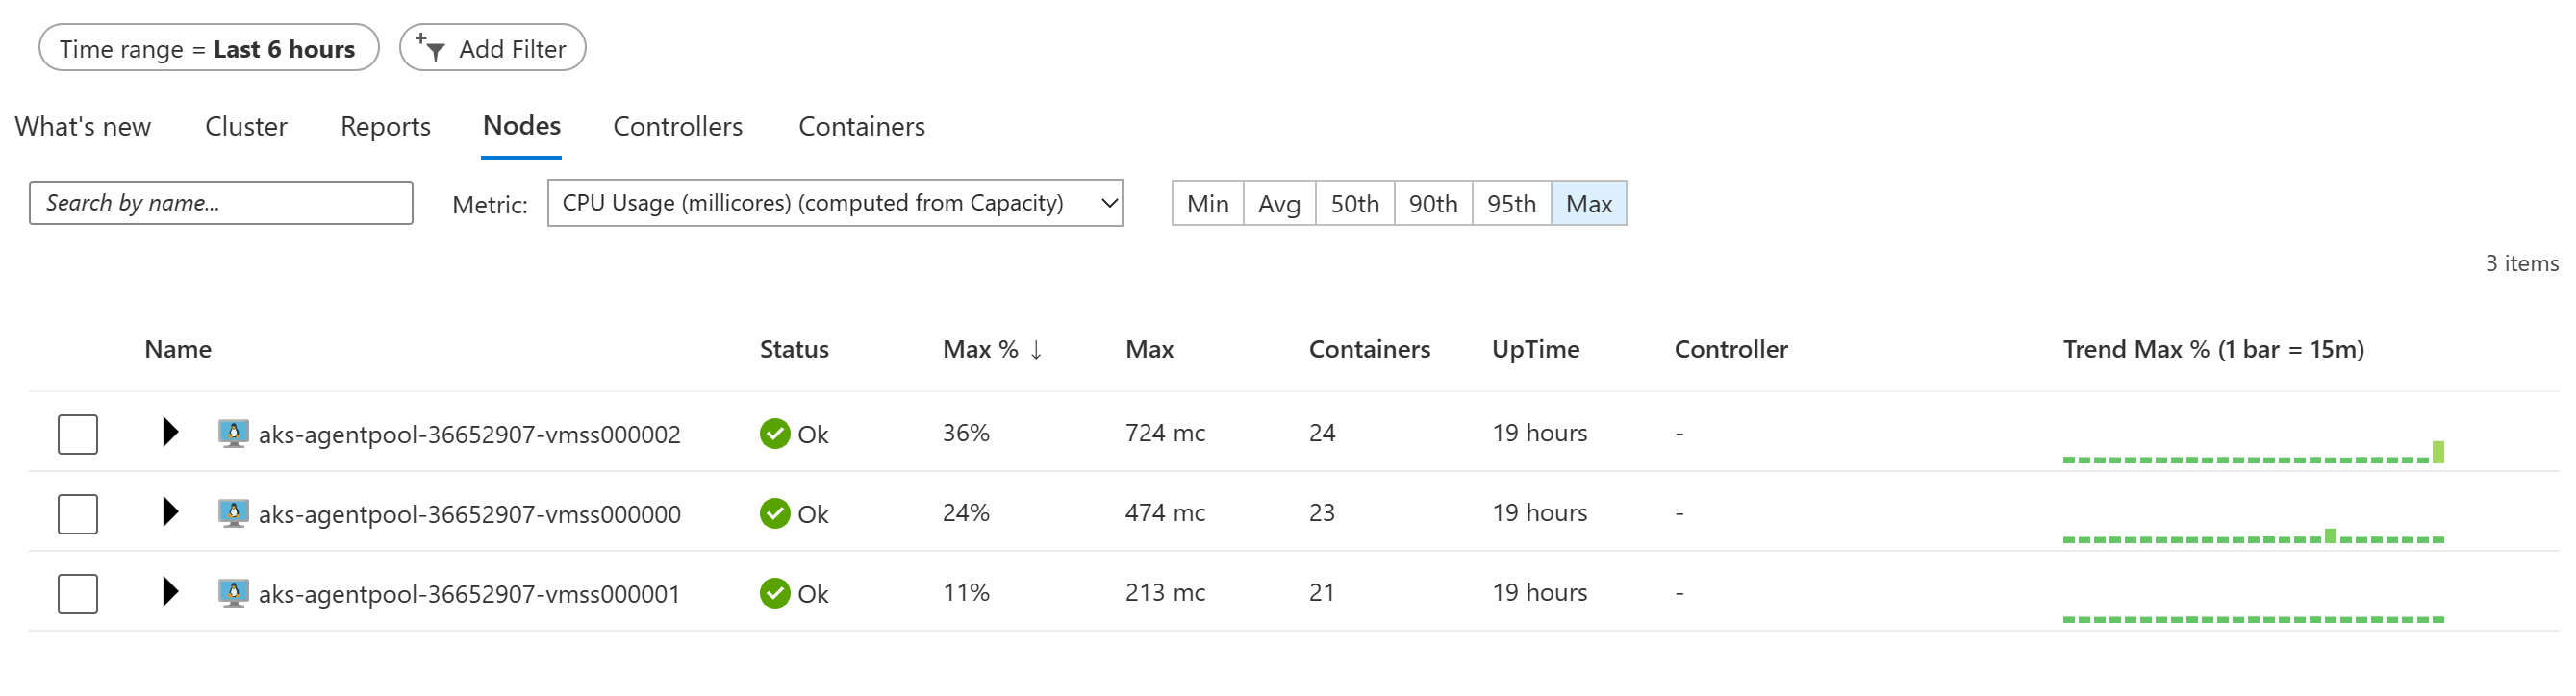
Next, change the view by clicking on the Nodes tab. Here, you will see a summary of what’s happening inside the cluster. Notice that one of your nodes (The one running stress) should be much more busy than the others.
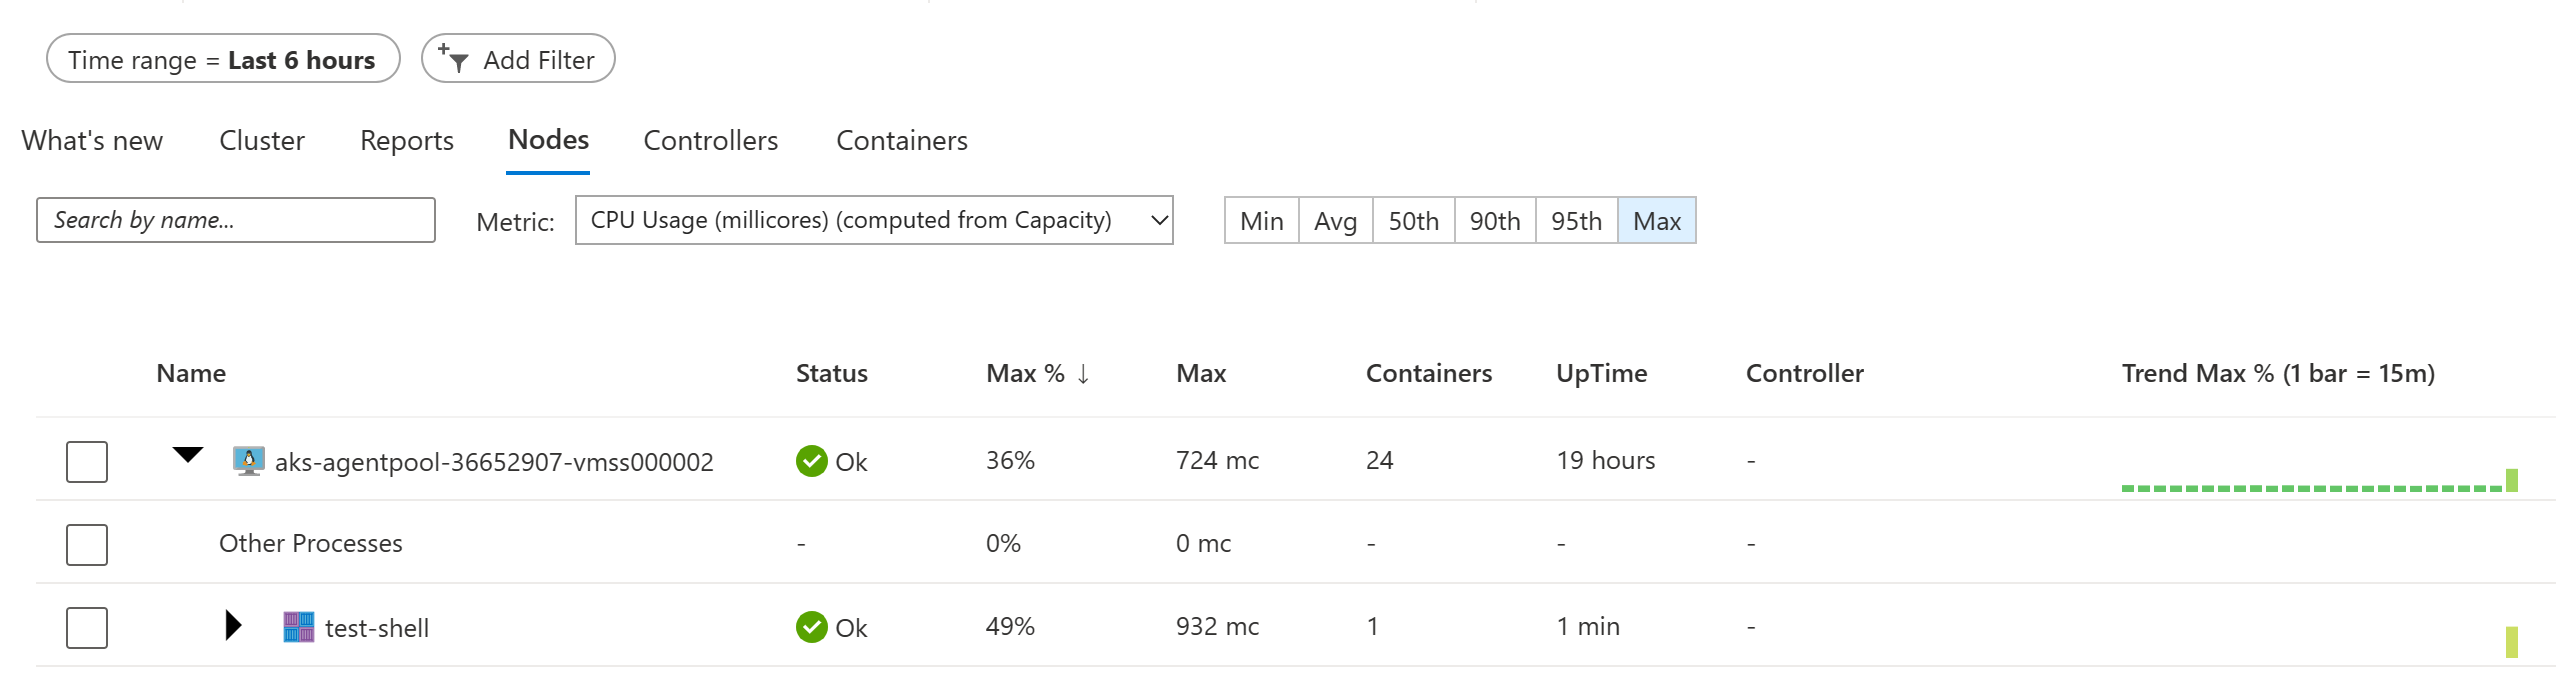
Find the node that appears to be the most busy in your cluster and expand its line item. Here, you will see a list of the processes running on that node. You should see our test-shell pod running stress at the top of this list.
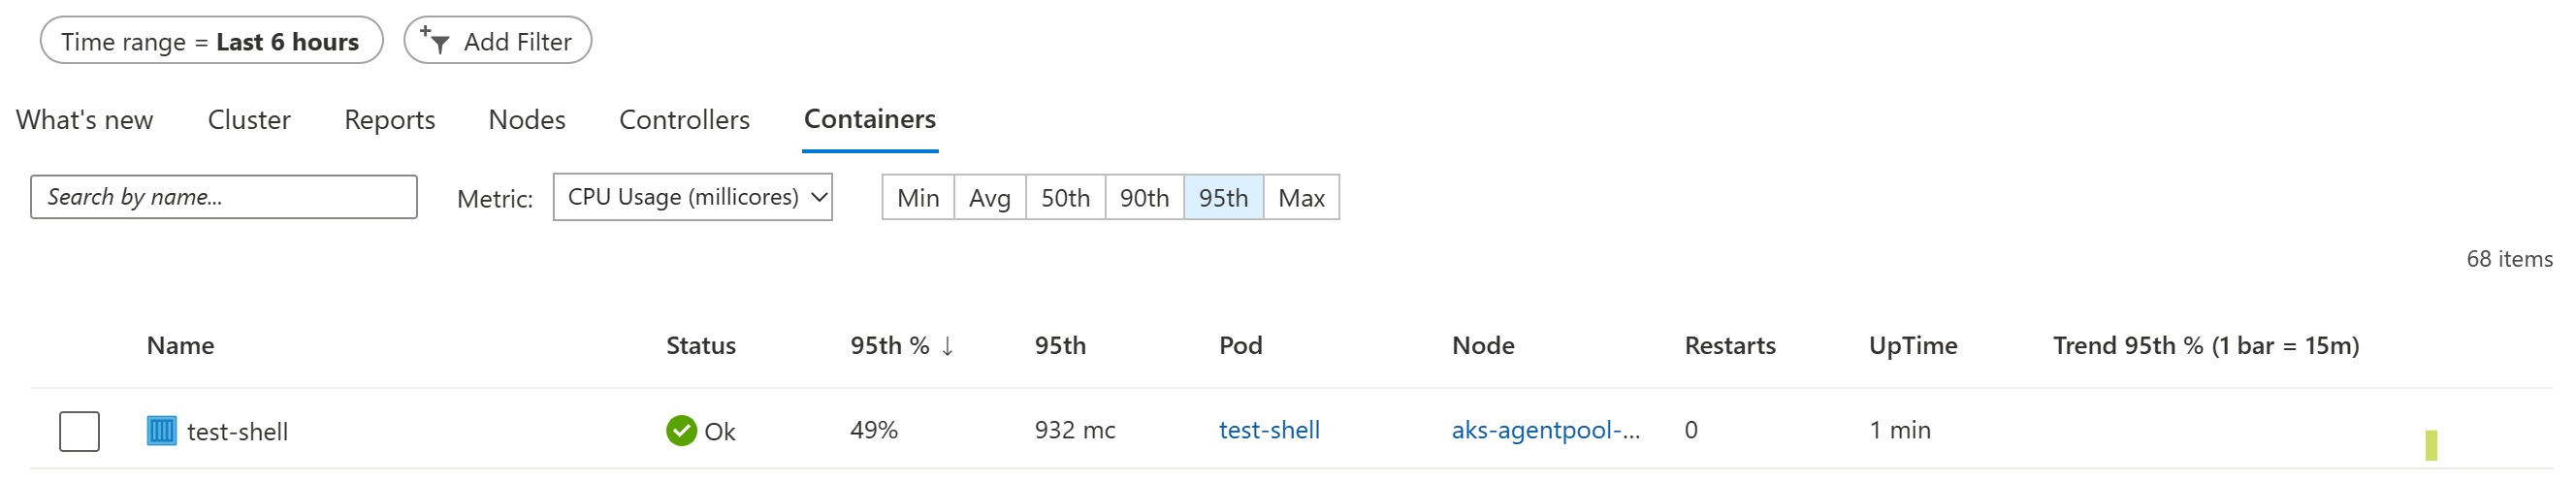
Next, change the view by clicking on the Containers tab. Here, you will be presented with a list of containers running on the cluster. Notice that our test-shell pod is at the top of the list.
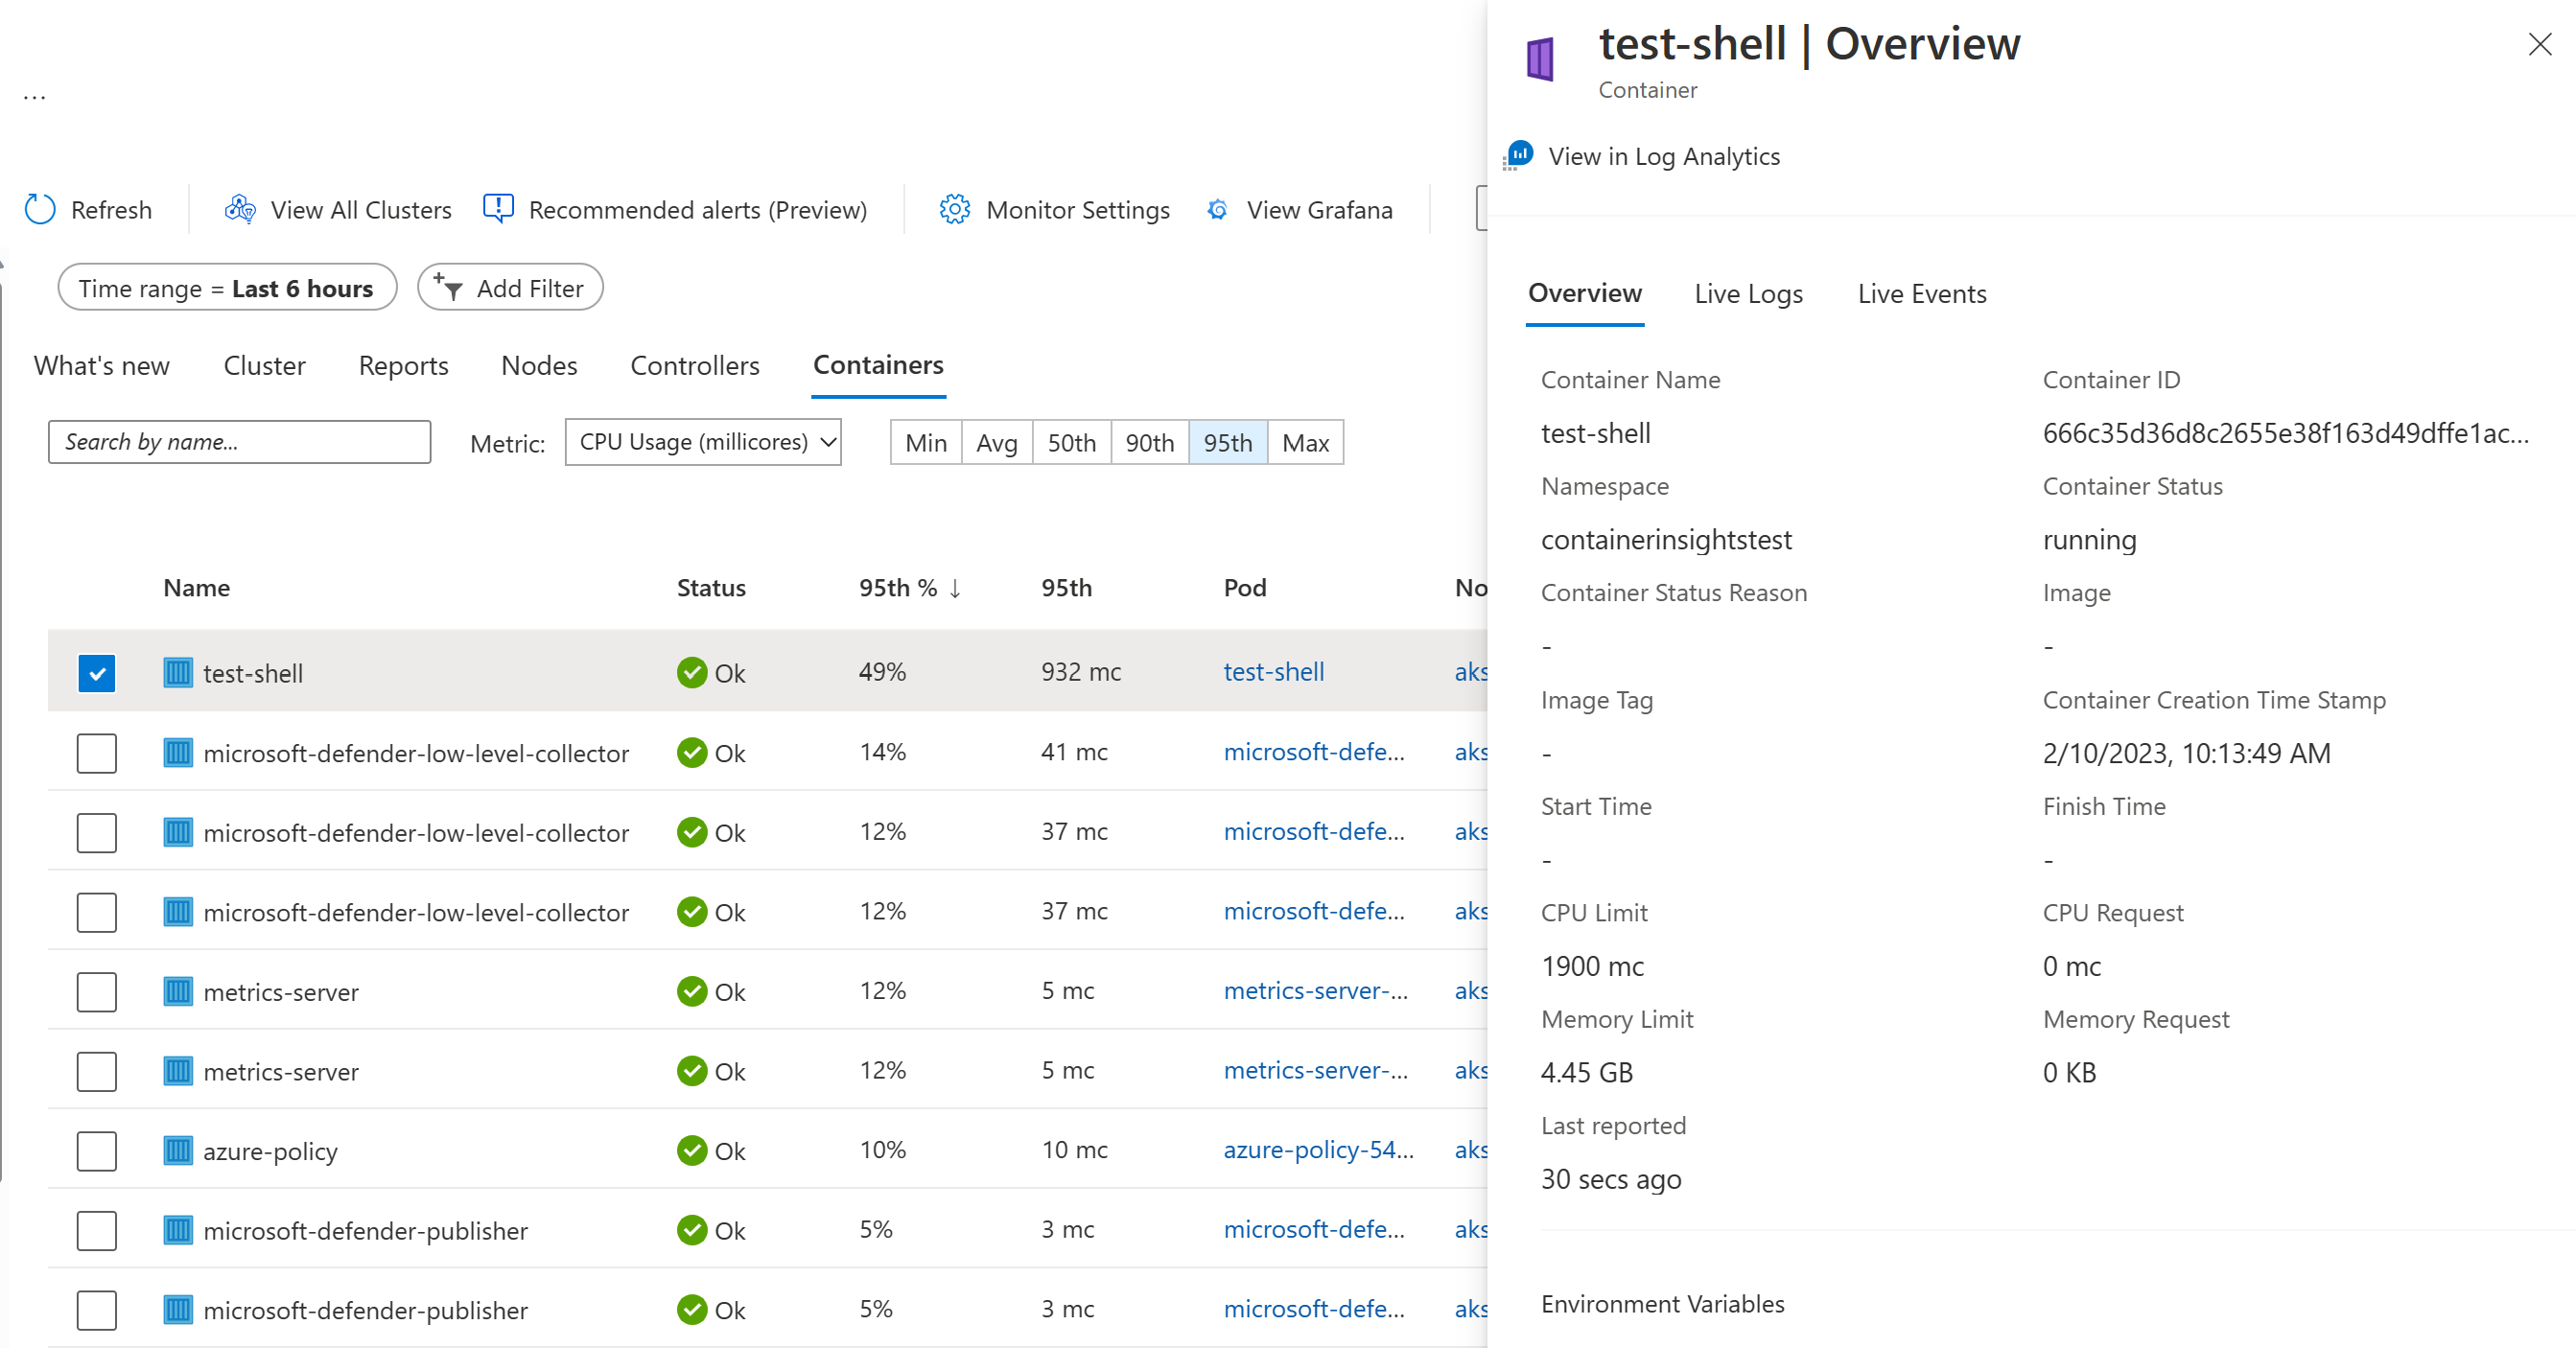
Select the test-shell container and you’ll get a description of the container.
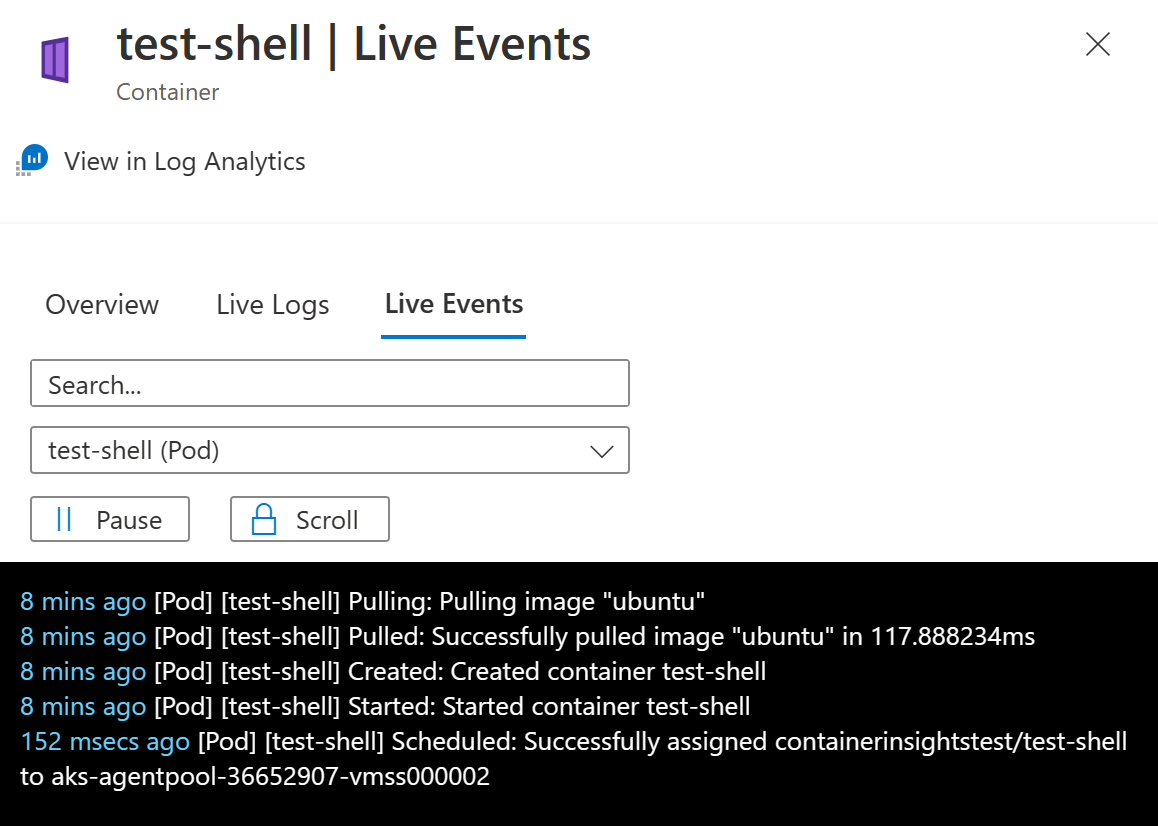
Here, you can also see a live stream of the container console and events.
Return to test-shell and type ctrl-c to terminate stress. Then, exit the pod.
exit
Now, let’s clean our cluster:
kubectl delete namespace containerinsightstest
kubectl config set-context --current --namespace default
Additional Diagnostics (Optional)
Container Insights provides excellent visibility within our Kubernetes Clusters. However, we can get even more visibility by streaming diagnostics data into the Azure Log Analytics workspace we just created. AKS offers you the ability to stream many types of diagnostic data, including log data from various sources as well as performance metrics.
Note: If you choose to implement Azure Sentinel as your centralized security monitoring solution, then this step will be done for you automatically when you add the Azure Kubernetes Service Data Connector to Sentinel. Sentinel will connect its associated Log Analytics Workspace to your cluster’s diagnostics.
Use the following CLI command to turn begin streaming select diagnostics data into Log Analytics
CLUSTERID=$(az aks show --resource-group $resourceGroupName --name $clusterName --query id -o tsv)
echo '['>diag.config
echo '{"category": "cluster-autoscaler", "enabled": true},'>>diag.config
echo '{"category": "guard", "enabled" :true},'>>diag.config
echo '{"category": "kube-apiserver", "enabled": true},'>>diag.config
echo '{"category": "kube-audit", "enabled": true},'>>diag.config
echo '{"category": "kube-audit-admin", "enabled": true},'>>diag.config
echo '{"category": "kube-controller-manager", "enabled": true},'>>diag.config
echo '{"category": "kube-scheduler", "enabled": true}'>>diag.config
echo ']'>>diag.config

az monitor diagnostic-settings create \
--name "diag01" \
--resource "$CLUSTERID" \
--workspace "$WORKSPACEID" \
--logs @diag.config

rm diag.config
Update Bicep Templates (Optional)
Now that we have enabled Container Insights, let’s go back and update our Bicep tempaltes in order to make sure our deployment process picks up the changes.
First, add the Log Analytics workspace to the template:
// Parameters...

@description('Log Analytics Workspace name')
param workspaceName string

// Log Analytics Workspace Definition
resource workspace 'Microsoft.OperationalInsights/workspaces@2022-10-01' = {
  name: workspaceName
  location: location
}

// Cluster Definition...
Next, adjust the AKS cluster and enable Container Insights:
// Inside Cluster Definition; add the following to properties

addonProfiles: {
    omsAgent: {
        enabled: true
        config: {
            logAnalyticsWorkspaceResourceID: workspace.id
        }
    }

    // ...
}
Finally, add in Diagnostics at the end of the template:
resource diag01 'Microsoft.Insights/diagnosticSettings@2021-05-01-preview' = {
    name: 'diag01'
    scope: aks
    properties: {
        logs: [{
            category: 'cluster-autoscaler'
            enabled: true
            retentionPolicy: {
                days: 0
                enabled: false
            }
        }, {
            category: 'guard'
            enabled: true
            retentionPolicy: {
                days: 0
                enabled: false
            }
        }, {
            category: 'kube-apiserver'
            enabled: true
            retentionPolicy: {
                days: 0
                enabled: false
            }
        },
        {
            category: 'kube-audit'
            enabled: true
            retentionPolicy: {
                days: 0
                enabled: false
            }
        }, {
            category: 'kube-audit-admin'
            enabled: true
            retentionPolicy: {
                days: 0
                enabled: false
            }
        }, {
            category: 'kube-controller-manager'
            enabled: true
            retentionPolicy: {
                days: 0
                enabled: false
            }
        }, {
            category: 'kube-scheduler'
            enabled: true
            retentionPolicy: {
                days: 0
                enabled: false
            }
        }]
        workspaceId: workspace.id
    }
}
Conclusion
This completes Lab 1 - Container Insights. If you would like, you may continue by completing Lab 2 - Azure Policy for Kubernetes, Lab 3 - Defender for Containers, or return to the Introduction.