Assignment 4 - Observability with Dapr using Zipkin
In this assignment you will look at how to access and view telemetry data being collected through Dapr within a distributed tracing system called Zipkin.
Step 1: Ensure Zipkin container is installed and running
When Dapr is initialized (dapr init) in self-hosted mode, several containers are deployed to your local Docker runtime. Run the following command to view all containers running locally on your machine. Ensure the Zipkin container is up and running and note the port it’s running on (Default is 9411)
docker ps
CONTAINER ID   IMAGE               COMMAND                  CREATED        STATUS                 PORTS                              NAMES
a29918435d42   redis               "docker-entrypoint.s…"   2 months ago   Up 2 hours             0.0.0.0:6379->6379/tcp             dapr_redis
3ba8c5264af1   openzipkin/zipkin   "start-zipkin"           2 months ago   Up 2 hours (healthy)   9410/tcp, 0.0.0.0:9411->9411/tcp   dapr_zipkin
f414fa5d89e6   daprio/dapr:1.6.1   "./placement"            2 months ago   Up 2 hours             0.0.0.0:6050->50005/tcp            dapr_placement
Step 2: Use Zipkin to inspect telemetry within a browser
In your browser of choice, open a new tab and navigate to the following url.
http://localhost:9411
The Zipkin web application should render where you can begin to search and view telemetry that has been logged through the Dapr observability building block.
Click on the Run Query button to initiate a search.
Depending on when you completed Assignment 3 and stopped the services included in that assignment, you’ll need to make sure the search filters are set correctly in order to have telemetry returned for inspection.
The default search criteria is set to all telemetry collected within the last 15 mins. If no telemetry is returned, increase the time filter within the settings section.
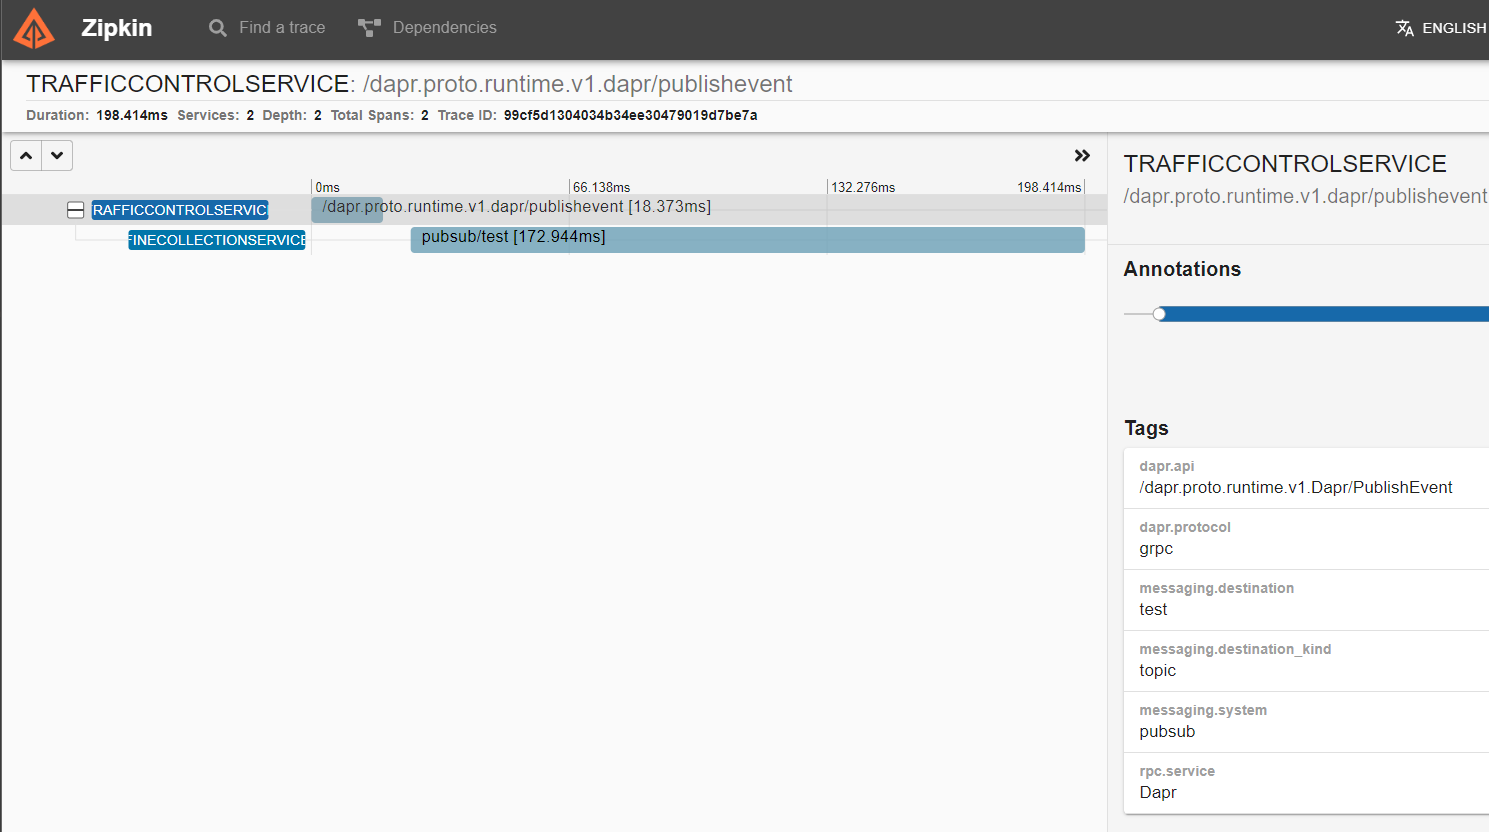
From the list of telemetry items, click the Show button to view an individual item and inspect the details of the trace.

< Assignment 3 - Pub/sub with Azure Services Assignment 5 - Deploy to Azure >