In this article, dive into how to harness AKS’ powerful features like auto-scaling and high availability to manage variable workloads and monitoring to maintain continuous service.
What We'll Cover:
- Deploying on Azure Kubernetes Service (AKS)
- Configuring AKS for dynamic application scaling
- Ensuring High Availability with Azure Load Balancer and AKS
Scaling Intelligent Apps on Azure Kubernetes Services (1)
In the first topic of this week, we explored how to use Azure Cognitive Services for Vision within Azure Kubernetes Service (AKS) to create an Intelligent App capable of analyzing images and extracting valuable data through optical character recognition (OCR). The week’s second article, focused on the advantages of Azure Cosmos DB, highlighting its multi-model database and ability to handle diverse data resulting from OCR analysis in our Intelligent App.
In this third topic, we’ll configure Azure Kubernetes Service (AKS) to manage varying workloads and smoothly scale our Intelligent App, ensuring it can handle intense and fluctuating workloads without compromising performance or availability.
Mastering Azure Kubernetes Services (AKS) for Intelligent App
At the core of the Azure ecosystem lies AKS. It plays a crucial role in optimizing application performance and efficient resource use. We can deploy, manage, and scale applications across different environments by precisely orchestrating containerized workloads.
AKS offers several robust features that help applications scale smoothly and stay available even during heavy demand, including the following:
- The cluster autoscaler adjusts the number of nodes in your cluster based on how much work you have. This way, it uses resources efficiently and keeps costs in check.
- The Azure Load Balancer is created automatically with AKS and acts like an intelligent traffic controller. It ensures incoming network traffic is distributed well across your cluster’s nodes, optimizing resource usage.
Together, these features give your applications a solid base to handle different workloads and keep running nonstop.
The following sections provide hands-on demonstrations of setting up, monitoring, and optimizing AKS to drive application efficiency and performance
Prerequisites
To follow this tutorial, ensure you have the following:
- Read through the first and second topics of this week
- Python 3.7 or later installed
- VS Code or another integrated development environment (IDE) for writing Python code
- The sample Python application from the second article of this series downloaded. Open the project before getting started.
- pip, the package manager for Python, installed
- A free Azure account. Sign up if you don’t have one yet.
- The Azure command-line interface (CLI)
Check out the complete project code for a preview of the final project.
Complete the Apps Cloud Skills Challenge to build on your AKS app dev skills.
To start with the basics for developing Kubernetes applications, explore #30DaysOfCloudNative.
Solution Architecture
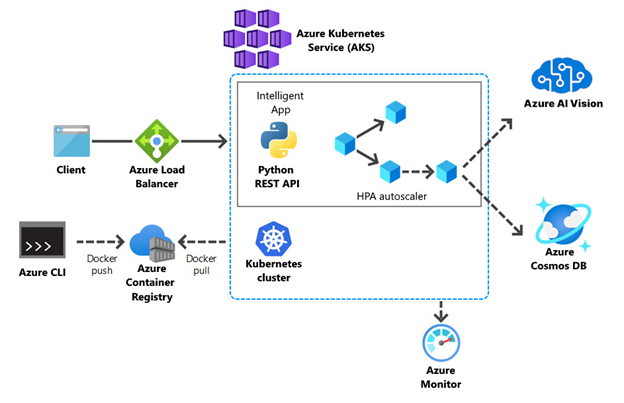
The image below shows the architecture of the solution we’re aiming for in this article.
Configuring AKS for Dynamic App Scaling
The cluster autoscaler and Kubernetes Horizontal Pod Autoscaling (HPA) are essential in achieving dynamic app scaling within an AKS environment.
The cluster autoscaler ensures our cluster scales its resources intelligently based on workload demand. It optimizes cost-effectiveness by adding or removing nodes dynamically, thus efficiently managing resources.
The HPA complements this by automatically scaling individual Pods within the cluster, monitoring metrics like CPU usage or custom metrics and adjusting the number of running pods to match application demand.
To understand how these two concepts work seamlessly to provide a comprehensive scaling solution, let’s now get into the details of cluster autoscaler configuration. Later, we’ll discuss how to set up HPA in our AKS cluster.
Setting Up the Cluster Autoscaler in AKS
Setting up the cluster autoscaler in AKS involves a combination of Azure CLI and kubectl commands. Here’s a step-by-step guide to help you through the process, including initial setup, configuring minimum and maximum node counts per node pool, and monitoring the cluster autoscaler’s performance.
To follow along, ensure you’re logged in to your Azure account. To log in, run the following command in your terminal:
az login
In the first part of this series, we created an AKS cluster named aks-intelligent-app. The picture below shows that AKS creates a single node pool named nodepool1 by default. We can access the AKS cluster nodes and visualize the default nodepool1 by clicking the Node pools menu in the Settings section:
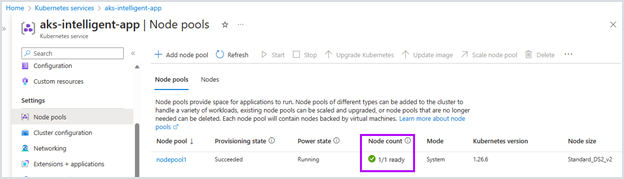
In the image above, “Node count: 1/1 ready” indicates that we have one virtual machine (node) allocated in the node pool nodepool1 within our AKS cluster. That node is currently healthy and operational, meaning it’s ready to accept and execute workloads.
In the context of an AKS cluster, a node pool is a set of virtual machines with similar configurations and capacities. These node pools are distinct virtual machine (VM) groups forming the cluster’s computing resources. Node pools allow for workload segregation and resource allocation optimization, as we can tailor each pool to handle specific tasks or workloads. This modular approach enhances flexibility and resource management within the AKS cluster.
Using kubectl, retrieve information on the current nodes by running the command below:
kubectl get nodes
This command above should retrieve results similar to those below:
| NAME | STATUS | ROLES | AGE | VERSION |
|---|---|---|---|---|
| aks-nodepool1-27122202-vmss000000 | Ready | agent | 59m | v1.26.6 |
Let’s say we want our app to support more than one node. In this case, we have two options: customize nodepool1 or add more node pools as needed. In this guide, we’ll review how to update the existing nodepool1 node pool to support multiple nodes.
Run the following command in your terminal to update the existing node pool:
az aks update --resource-group computer-vision --name aks-intelligent-app --enable-cluster-autoscaler --min-count 2 --max-count 3
This change ensures the node pool will always have at least two nodes available and can scale up to a maximum of three nodes, depending on the workload demand. This approach helps manage resource allocation based on varying needs within the AKS cluster.
Now, run the kubectl get nodes command again to retrieve the new node count:
kubectl get nodes
Your results should appear similar to those below:
| NAME | STATUS | ROLES | AGE | VERSION |
|---|---|---|---|---|
| aks-nodepool1-27122202-vmss000000 | Ready | agent | 2d5h | v1.26.6 |
| aks-nodepool1-27122202-vmss000001 | Ready | agent | 2d54 | v1.26.6 |
Refresh the Node pools page of your aks-intelligent-app AKS cluster in the Azure Portal:

The “Node count: 2/2 ready” above indicates that you now have two nodes allocated, both in a healthy and operational state.
To view more information about the node in your cluster, select the Nodes tab on the Node pools page:
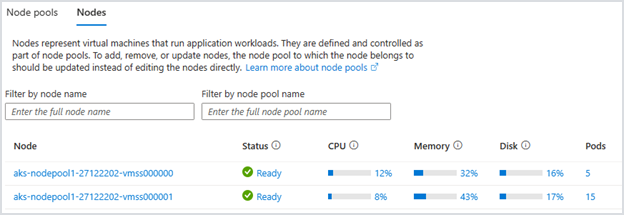
Here, the CPU, memory, disks, and Pods information provide a comprehensive view of the cluster’s resource utilization and workload distribution.
How the Cluster Autoscaler Dynamically Scales Resources
The cluster autoscaler is pivotal in maintaining the optimal performance and cost-effectiveness of Intelligent Apps within cloud environments.
The cluster autoscaler in AKS continuously monitors the cluster’s resource use, including CPU and memory, and compares it to the resource requests and limits defined in the Pod specifications. When the autoscaler detects that additional resources are required to meet the workloads’ demands, it automatically provisions new nodes, expanding the cluster’s capacity. Conversely, when there’s a decrease in resource demands, the cluster autoscaler scales in by removing underused nodes, optimizing cost efficiency.
By dynamically scaling resources in response to fluctuations in workload demand, the autoscaler ensures they are efficiently allocated, preventing overprovisioning during periods of low activity and scaling up when demand peaks. This adaptive approach enhances the responsiveness of Intelligent Apps and mitigates unnecessary expenses by rightsizing the infrastructure.
Configuring the Horizontal Pod Autoscaler
The Kubernetes HorizontalPodAutoscaler (HPA) is a powerful tool that ensures optimal application performance and resource use. It dynamically adjusts the number of running pods in a Kubernetes deployment based on either CPU usage, memory usage or custom metrics defined by the user.
To configure it, we must first define the desired target for resource use. For instance, if using a CPU, we’d specify a target percentage of CPU usage per Pod. Once we set the target, the HPA constantly monitors the metrics and automatically scales the number of Pods to maintain the desired use level.
To demonstrate what HPA can do, let’s write a YAML file and configure it to work with our Intelligent App. Create a file named intelligent-app-hpa.yml in the Deployment folder with the following contents:
apiVersion: autoscaling/v1
kind: HorizontalPodAutoscaler
metadata:
  name: intelligent-app-hpa
spec:
  maxReplicas: 10
  minReplicas: 3
  scaleTargetRef:
    apiVersion: apps/v1
    kind: Deployment
    name: intelligent-app
  targetCPUUtilizationPercentage: 50
Note: You can also enable pod autoscaling but including the spec above in your pod definition yaml file.
The intelligent-app-hpa.yml file above defines an HPA resource in Kubernetes. It configures the autoscaler for the intelligent-app Deployment to automatically adjust the number of replicas (Pods) based on CPU usage. The HPA ensures the number of replicas ranges from a minimum of 3 to a maximum of 10, targeting a CPU use of 50 percent.
As the CPU usage changes, the HPA automatically scales the number of replicas to maintain the desired CPU use level. This process allows the intelligent-app Deployment to handle varying workloads efficiently while staying within specified resource boundaries.
To apply HPA, change the terminal to the deployment folder and run the kubectl command below:
cd Deployment
kubectl apply -f intelligent-app-hpa.yml
This command applies the configuration described in the intelligent-app-hpa.yml file to create an HPA resource within the Kubernetes cluster.
To review the created HPA resource in your terminal, run the following command:
kubectl get hpa
The terminal will display information about the HPA resources present in the Kubernetes cluster, providing details including target deployments, desired replicas, current replicas, and usage metrics for autoscaling:
| NAME | REFERENCE | TARGETS | MINPODS | MAXPODS | REPLICAS | AGE |
|---|---|---|---|---|---|---|
| intelligent-app-hpa | Deployment/intelligent-app | 1%/50% | 3 | 10 | 3 | 36s |
As we can see in the results, the HorizontalPodAutoscaler resource is linked to the intelligent-app Deployment. The “1%/50%” indicates that the current CPU use is 1 percent of the target use of 50 percent. The HPA maintains a minimum of 3 replicas (Pods) and can scale up to a maximum of 10 replicas. Currently, only three replicas are running.
Ensuring High Availability with Azure Load Balancer and AKS
We can configure and manage Azure Load Balancer, availability zones (AZs), and Pod disruption budgets to ensure high availability in our application. In this section, we cover these concepts in detail.
In the first article of this series, we learned we can run the kubectl get services command to list the services and their corresponding details, such as the Service name, cluster IP address, external IP, and ports.
The kubectl get services command offers a quick and comprehensive snapshot of the services deployed within your Kubernetes cluster, providing key details such as service names, cluster IPs, external IPs, ports, and associated endpoints. This information enables administrators and developers to monitor, troubleshoot, and manage the connectivity and accessibility of services.
Run this command in your terminal:
kubectl get services
You should receive an output similar to the following:
| NAME | TYPE | CLUSTER-IP | EXTERNAL-IP | PORT(S) | AGE |
|---|---|---|---|---|---|
| intelligent-app-service | LoadBalancer | 10.0.77.60 | 20.121.76.153 | 80:30936/TCP | 47s |
| kubernetes | ClusterIP | 10.0.0.1 | <none> | 443/TCP | 14m |
In this output, we can see a Kubernetes Service named intelligent-app-service with a type of LoadBalancer, reachable from the cluster through the IP 10.0.77.60. It’s accessible via 20.121.76.153 on port 80, mapped to port 30936.
The Azure Load Balancer continuously monitors the health and responsiveness of each Pod or node and actively distributes incoming requests to maintain a balanced load across pods. It ensures even traffic distribution among the Pods, preventing any one Pod or node from becoming overwhelmed and promoting optimal resource use.
The Load Balancer’s ability to intelligently route requests to healthy Pods, combined with the service’s configuration for health probes and backend pool setup, promotes the high availability and responsiveness of the application.
These features allow it to adapt seamlessly to varying workloads and potential node failures while delivering a reliable user experience.
Availability Zones in AKS
Azure AZs are crucial in enhancing the resilience and availability of applications within AKS. Deploying AKS clusters across multiple AZs involves distributing cluster resources across physically isolated data centers. This approach ensures that if one zone experiences an outage, perhaps due to a natural disaster in that region, the application can continue operating from another.
In the first article, we created an AKS cluster. Now, we can use the kubectl command and grep to check the AZs for nodes in this AKS cluster. Run this command in your terminal:
kubectl get nodes -o custom-columns="NAME:.metadata.name,AVAILABILITY_ZONE:.metadata.labels.topology\.kubernetes\.io/zone"
You should receive results similar to those below:
| NAME | AVAILABILITY_ZONE |
|---|---|
| aks-nodepool1-57155478-vmss000001 | 0 |
The output shows that the node aks-nodepool1-57155478-vmss000001 is in availability zone 0. This information helps us understand how Kubernetes distributes the nodes in the cluster across AZs—vital for achieving high availability and fault tolerance in our Kubernetes-based applications.
Notably, after we create our AKS cluster, we cannot directly modify it to enable or disable AZs. To create a cluster that works across AZs 1, 2, and 3, modify the az aks create command as follows:
az aks create --resource-group computer-vision --name aks-intelligent-app --node-count 1 --generate-ssh-keys --zones 1 2 3
Note: We can discover the AZs in Azure for a specific region using the Azure CLI. Open your command-line terminal and run the following command to list the available AZs for a specific Azure region:
az vm list-skus --location <region-name> --output table
Replace <region-name> with the name of the Azure region you want to check. For example, if you want to check AZs for the East US region:
az vm list-skus --location eastus --output table
Maintaining Service During Voluntary Disruptions Using Disruption Budgets
In AKS, Pod disruption budgets (PDBs) are critical in maintaining service availability during updates or planned disruptions. PDBs set guidelines for how many Pods can be unavailable simultaneously, preventing excessive downtime by ensuring that only a controlled number of Pods are taken offline at any given time. This design lets us maintain service during voluntary disruptions.
Here’s a step-by-step guide on creating and managing PDBs where we define a minimum available or maximum unavailable resource count.
To create a PDB, you will define a YAML configuration file that specifies the desired criteria for your budget. First, create a file named pdb-config.yml in the Deployment folder with the following contents:
apiVersion: policy/v1
kind: PodDisruptionBudget
metadata:
   name: intelligent-app
spec:
   minAvailable: 3
   selector:
    matchLabels:
      app: intelligent-app
Here, the minAvailable field specifies the minimum number of Pods that must remain available (not disrupted or terminated) during voluntary disruptions like maintenance or updates. Setting this field to 3 means that when disruptions occur, Kubernetes will ensure that at least three Pods of the specified application are running at all times.
Now, ensure you are in the Deployment folder and apply the PDB configuration using the kubectl apply command:
kubectl apply -f pdb-config.yml
To verify that you’ve successfully created the PDB, run the following command:
kubectl describe pdb intelligent-app
This command will give you the following results:
Name:           intelligent-app
Namespace:      default
Min available:  3
Selector:       app=intelligent-app
Status:
    Allowed disruptions:  0
    Current:              1
    Desired:              3
    Total:                1
Events:                   <none>
Now let’s analyze the output:
- Name and namespace—The PDB is named “intelligent-app” and belongs to the “default” namespace.
- Min available—The PDB specifies that at least three Pods must always be available. So, even during planned disruptions, there will always be at least three application Pods running.
- Selector—The PDB applies to Pods labeled
app=intelligent-app. - Status —
- Allowed disruptions—The value 0 means that the PDB doesn’t allow any disruptions or evictions of Pods that match its selector. In this example, it ensures that at least three healthy Pods are always available and no disruptions are permitted.
- Current—Shows the current number of available healthy replicas that match the PDB’s selector. In this case, it’s 1, meaning there is currently one healthy Pod.
- Desired—Indicates the desired number of replicas that should be available. It’s also set to 3, meaning the PDB wants to maintain three replicas.
- Total—The total number of replicas matching the PDB's selector. It’s 1, indicating that there is one replica.
- Events—The
<none>entry underEventsindicates no recent events or changes associated with this PDB.
By implementing these budgets, AKS ensures a gradual and controlled update process, minimizing service disruption and providing a reliable user experience. It’s a strategic approach to balance necessary updates with keeping the service responsive and available to users.
Configuring Azure Load Balancer in AKS for High Availability
To ensure that your applications can withstand failures and maintain continuous service availability, you must configure the Azure Load Balancer in AKS for high availability. You can take many measures to increase Azure Load Balancer’s availability in your AKS cluster.
To demonstrate, open your terminal and run the following command:
az aks update --resource-group computer-vision --name aks-intelligent-app --load-balancer-managed-outbound-ip-count 2
The Azure CLI command above updates the aks-intelligent-app AKS cluster, setting the managed outbound IP count for the cluster’s load balancer to 2. This command increases the number of managed outbound IPs associated with the cluster’s load balancer, which can be helpful where multiple outbound IP addresses are required for load balancing and network egress, improving the cluster’s networking capabilities and allowing for more flexible outbound traffic management.
To configure Azure Load Balancer in AKS for high availability, consider implementing the following additional measures:
- Use Azure AZs—Deploy your AKS cluster across multiple Azure AZs to ensure redundancy and fault tolerance.
- Configure health probes—Define health probes for your Azure Load Balancer to regularly check the health of backend pods or nodes.
- Load Balancer rules—Configure load balancing rules to distribute traffic efficiently.
- Backend pool scaling—Adjust the backend pool scaling based on traffic patter
- Network security rules—Implement network security groups (NSGs) to control inbound and outbound traffic to and from the Load Balancer.
- Azure monitoring and diagnostics—Set up monitoring and diagnostics to gain insights into the Load Balancer’s performance and traffic distribution.
- Backup and Recovery—Implement backup and disaster recovery strategies for your AKS cluster and Load Balancer configurations.
- Scaling and autoscaling—Use AKS horizontal Pod autoscaling for your applications to adjust the number of pods automatically based on resource usage.
You can explore this topic further on Microsoft Learn.
Exercise
- Complete this hands-on sample project code to scale and monitor your intelligent app on AKS
- Register for the Learn Live: Kubernetes Edition starting Oct 12 - a live SME guided walkthrough on a reference architecture to build intelligent apps with AKS and Azure Open AI
- Register for Ask the Expert: Azure Kubernetes Service session for live Q&A with the Product Engineering team on building intelligent serverless apps.
Next Steps
In the next blog, continue exploring monitoring Azure Kubernetes Service clusters and deep dive into real world uses cases for scaling and designing high availability in intelligent apps.