From metrics to answers: Grafana dashboards for Azure App Service
When your web application slows down, a chart is only the beginning. You need to understand what changed, where to investigate, and which diagnostic tools can help.
The Grafana dashboard experience for Azure App Service brings platform metrics and links to App Service diagnostics into a single starting point in the Azure portal. It gives you another way to explore your application’s health and take the next step when something needs attention.
Start with the application you already manage
Open your App Service web app in the Azure portal and select Monitoring > Dashboards with Grafana (Preview) from the navigation menu. In the gallery, open Azure | Insights | Web Apps - Platform Metrics.
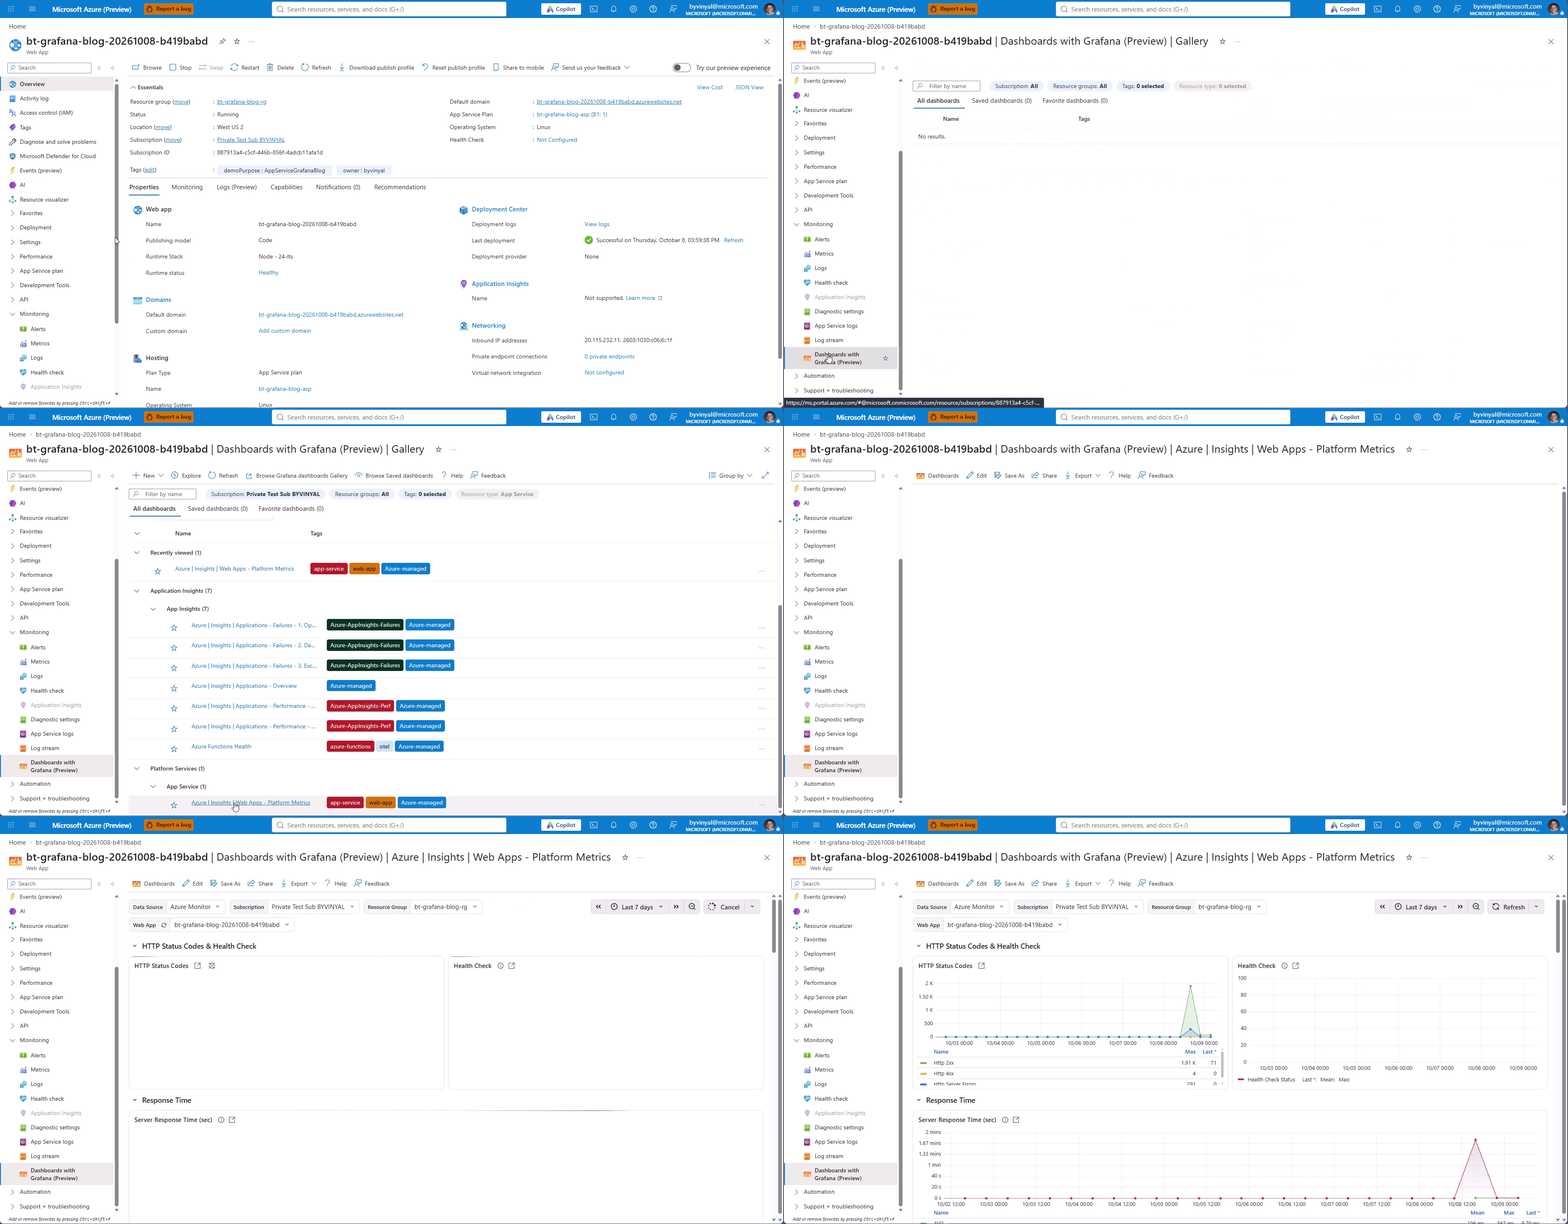
The dashboard brings together platform metrics for your app, helping you review its behavior without first assembling a dashboard from scratch. Whether you’re checking on an application after a deployment or investigating a reported issue, you can start with a shared view of its health.
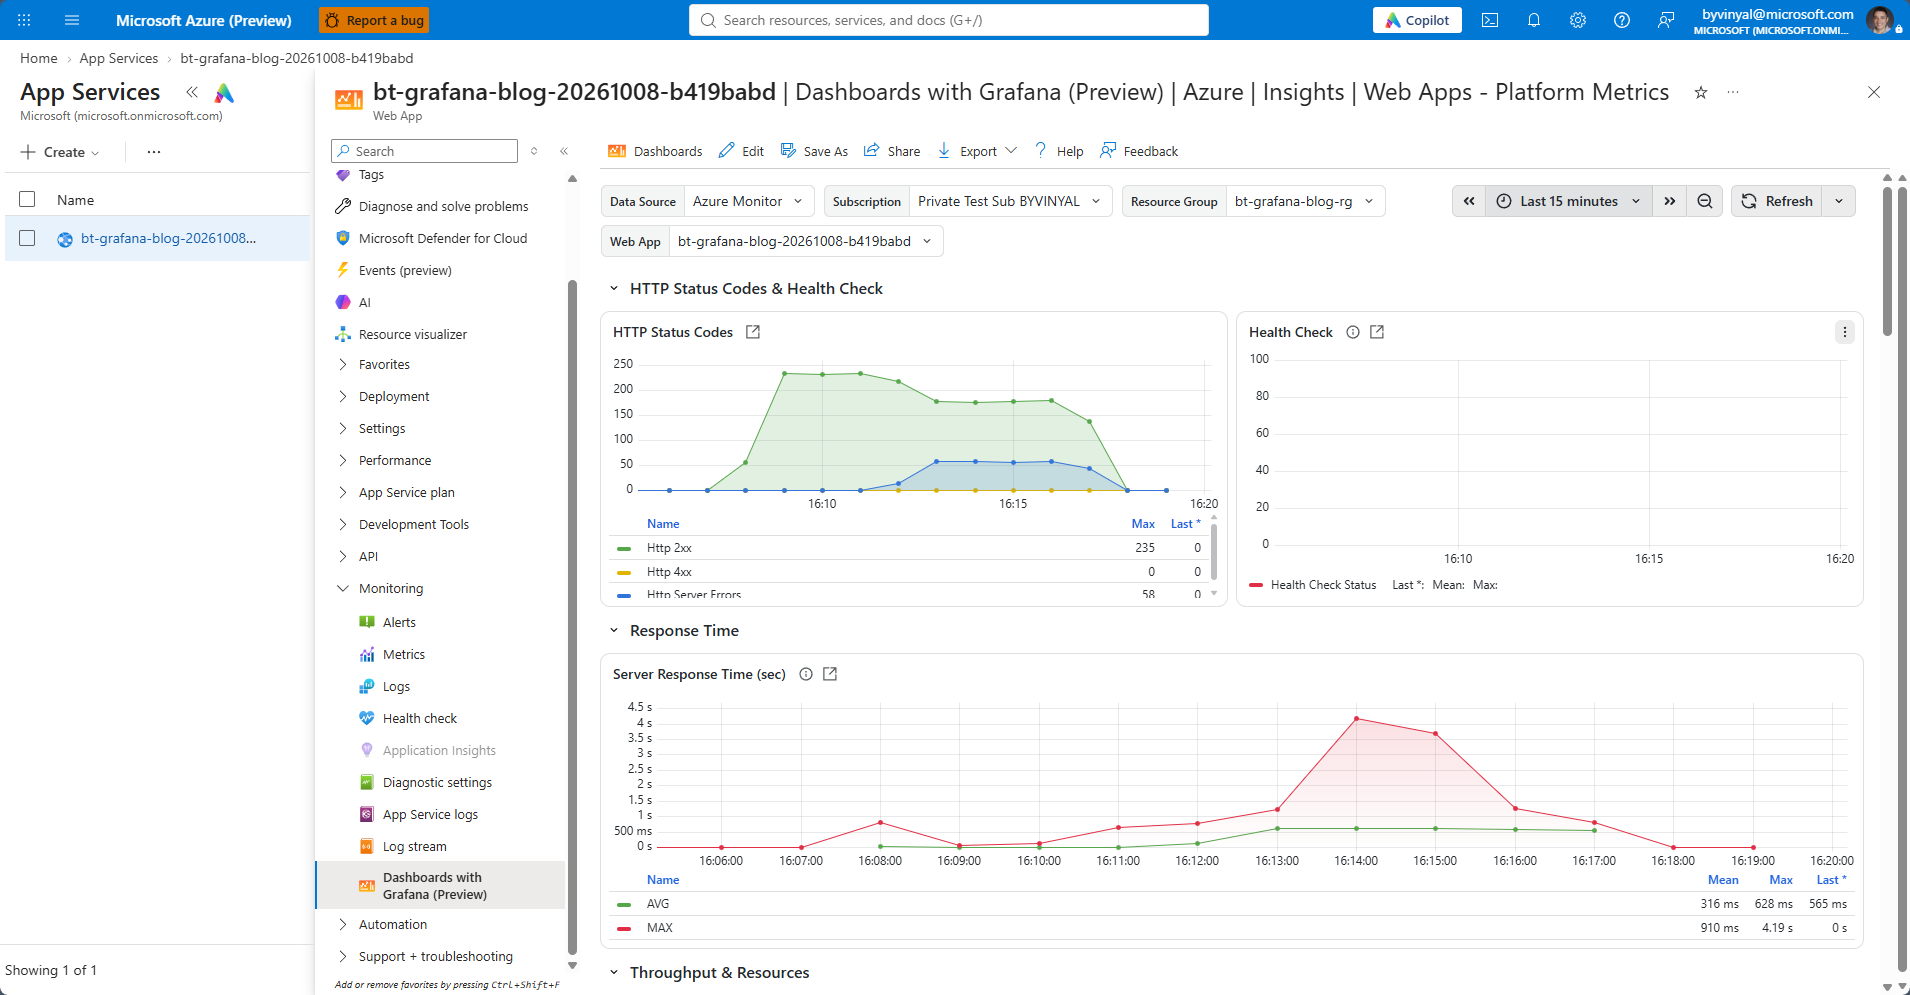
In this Linux demo, we generated healthy baseline traffic, followed by controlled slow responses and simulated HTTP 500 errors. The 15-minute view shows HTTP status codes and average and maximum server response times across the test. The empty Health Check panel reflects that App Service Health Check wasn’t configured for this demo; an application health endpoint alone doesn’t enable that feature.
Move from observation to investigation
Imagine a customer reports that your application feels slower than usual. Your first task is to understand whether the application’s metrics show a corresponding change.
Start with the dashboard to explore the affected period. When you identify something worth investigating, follow the diagnostic links to explore further using App Service’s diagnostic tools.
The dashboard includes operating-system-specific diagnostic links, helping you find relevant investigation paths for your application’s environment. The goal is straightforward: make it easier to move from “something looks different” to “here’s where I should look next.”
In our Linux example, the link beside Server Response Time (sec) is labeled Deep dive: app slowness detector. It opens Availability and Performance > Web App Slow, where you can explore the diagnostic results.
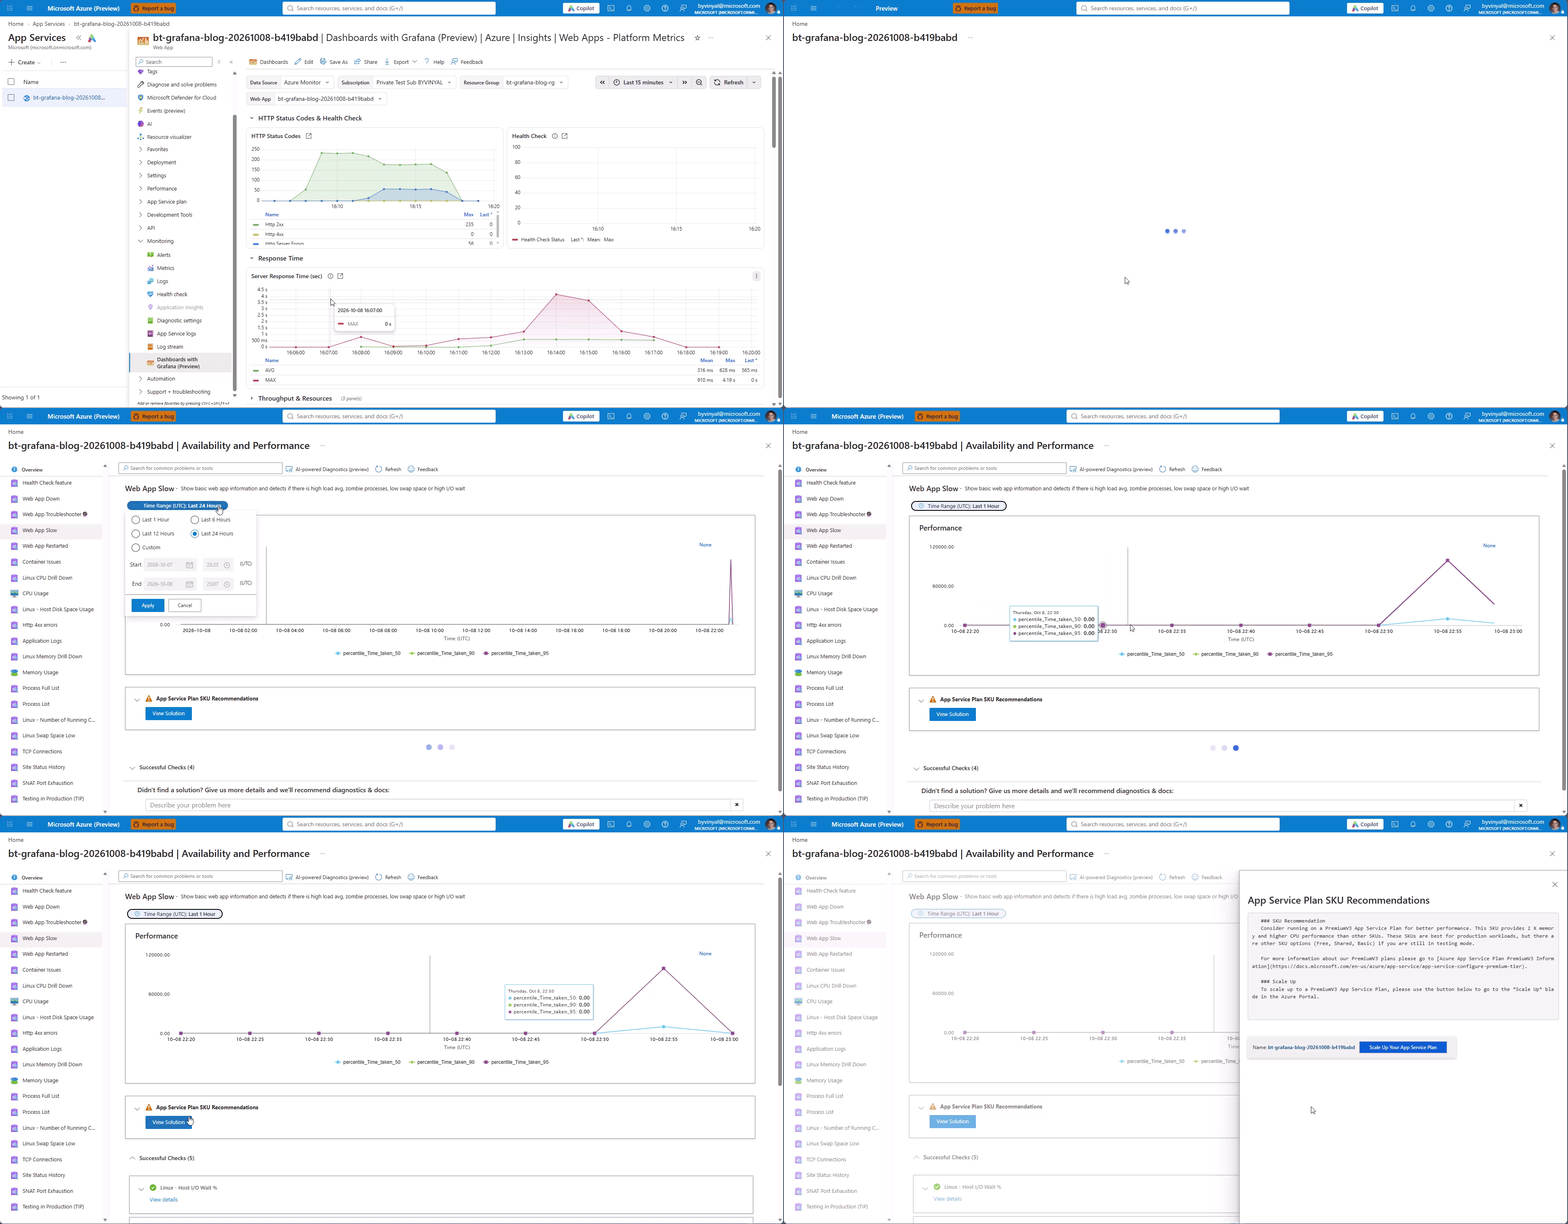
Check the time range again in the diagnostic view so it covers the period you’re investigating.
The dashboard is a starting point, not a replacement for application logs, tracing, or deeper troubleshooting. Use it alongside your existing monitoring tools to build a fuller picture. For more about the investigation tools, see the App Service diagnostics overview.
Work within your existing access permissions
The dashboard in the Azure portal queries data using your signed-in identity. Your existing Azure resource permissions govern access; the dashboard does not grant additional access to the underlying resources.
That distinction matters when teams collaborate on troubleshooting: each person needs the appropriate permissions to view the relevant data. Sharing a view of the dashboard does not bypass those permissions.
This follows the Azure Monitor dashboards with Grafana model, which uses the current user’s identity for data-source authentication. It is distinct from Azure Managed Grafana, a separate service with additional configuration options.
Try it with your next application health check
To get started:
- Open your App Service web app in the Azure portal.
- Select Monitoring > Dashboards with Grafana (Preview) and open the Web Apps platform metrics dashboard.
- Explore the platform metrics and use the diagnostic links when you need more context.
You don’t need to wait for an incident. Start with a healthy application to become familiar with its normal behavior, then use that context when you investigate a change.
