Metrics
Logging metrics#
Logging a metric to a run causes that metric to be stored in the run record in the experiment. Visualize and keep a history of all logged metrics.
log#
Log a single metric value to a run.
You can log the same metric multiple times within a run; the results will be displayed as a chart.
log_row#
Log a metric with multiple columns.
More logging options
These are probably the most common APIs used for logging metrics, but see here for a complete list, including logging lists, tables and images.
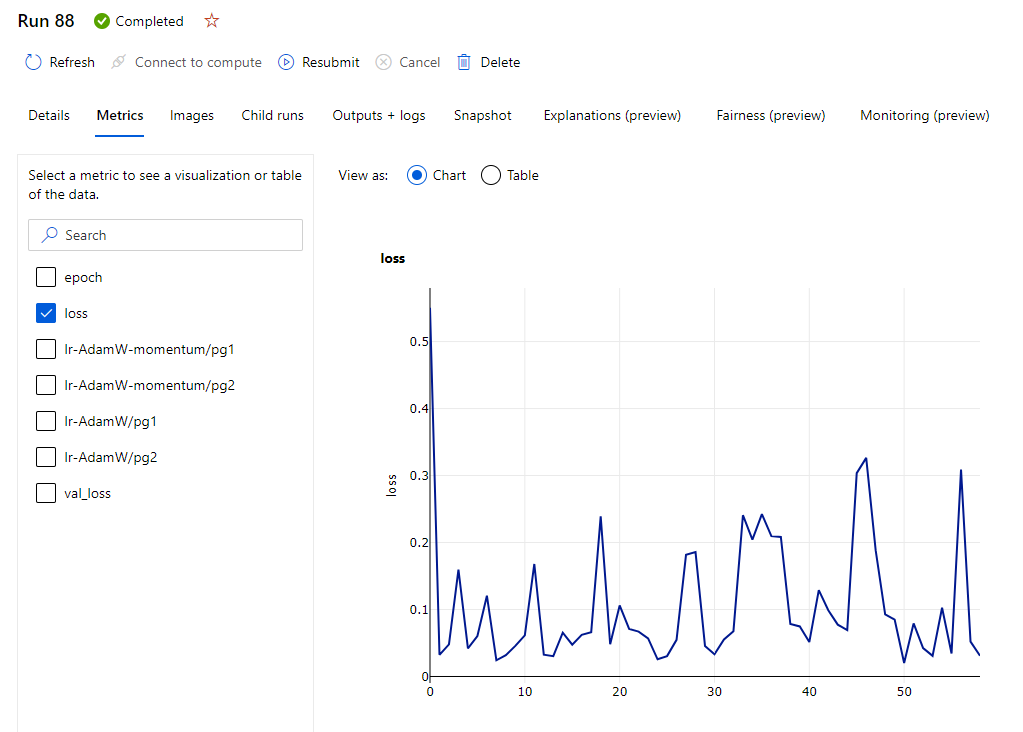
Viewing metrics#
Metrics will be automatically available in the Azure ML Studio. Locate your run, e.g., either by visiting ml.azure.com, or using the SDK:
Select the "Metrics" tab and select the metric(s) to view:
It is also possible to compare metrics between runs in a summary view from the experiments page itself. Select the "Experiments" tab, add custom charts and select the runs you want to compare!

Custom views
Curate your view by adding charts, selecting key runs, updating the columns in the table. You can then save this view, create more, and even share them with others!
Via the SDK#
Viewing metrics in a run (for more details on runs: Run)
To view all recorded values for a given metric my-metric in a
given experiment my-experiment:
Examples#
Logging with MLFlow#
Use MLFlow to log metrics in Azure ML.
Logging with PyTorch Lightning#
This examples:
- Includes Lightning's
TensorBoardLogger - Sets up Lightning's
MLFlowLoggerusing AzureMLRun.get_context()- Only adds this logger when used as part of an Azure ML run
Now include this logger in the lightning Trainer class: