
Enhancing Observability in Azure Kubernetes Service (AKS): What’s New?
Observability Enhancements in Azure Kubernetes Service (AKS)
At Azure Kubernetes Service (AKS), we deeply recognize how crucial observability is for running stable Kubernetes environments. Given our extensive reliance on Kubernetes internally, we’re continually innovating to ensure you have robust, clear, and actionable insights into your cluster health and performance. Observability—the ability to monitor, understand, and manage your systems effectively—is a foundational pillar for AKS product vision to enable our users to achieve more.
In this post, we’ll highlight several recent observability enhancements in AKS and Azure Monitor across three main dimensions: Improved monitoring capabilities, Reduce effort for best-in-class observability, and better reliability and performance.
Improved Monitoring Capabilities
1. Preview: AKS Control Plane Platform Metrics
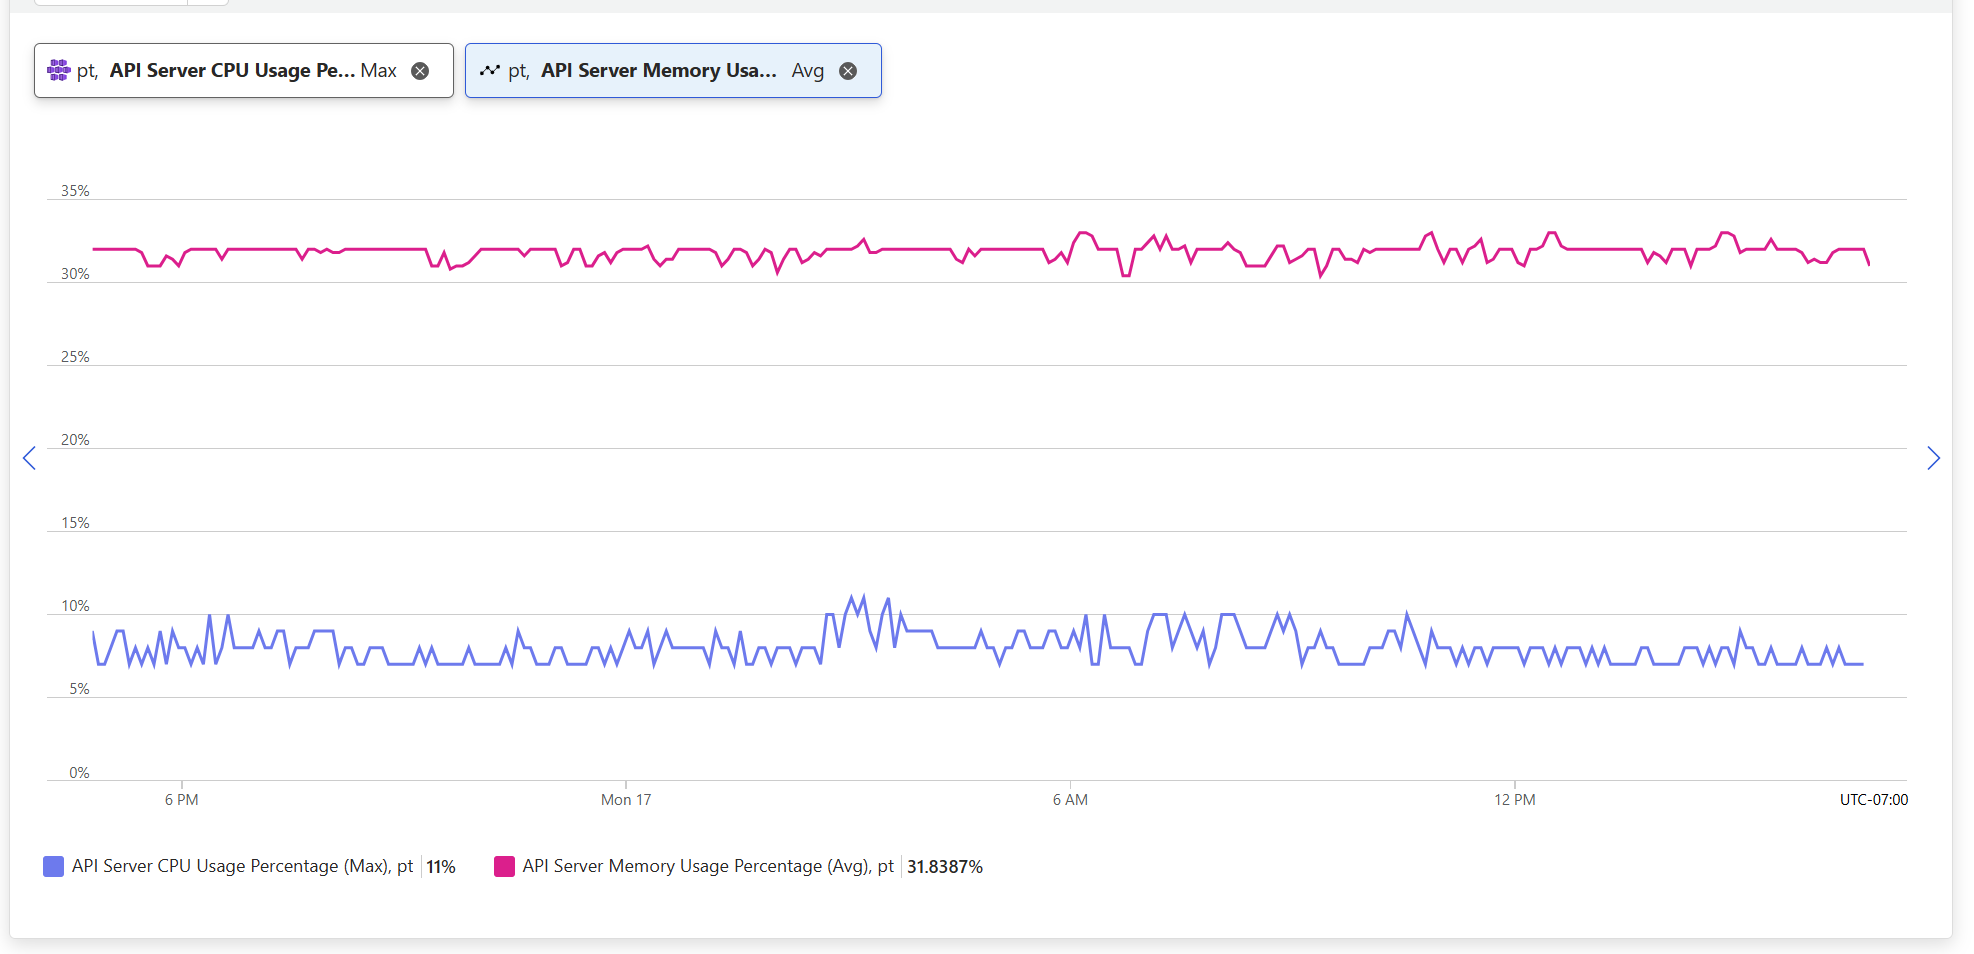
AKS provides a managed control plane experience from provisioning, patching, to managed upgrades. However, at high scale, monitoring the control plane of your AKS cluster for latency, rogue call patterns and limits is important for maintaining stability and performance. AKS already supported detailed control plane metrics through Azure Monitor managed service for Prometheus. Recently, we’ve introduced Azure Platform Metrics for AKS Control Plane Monitoring, these free metrics deliver key insights into the utilization of your AKS control plane and understand how close to the limits you are flying. You can now use the API server CPU/memory utilization metrics to monitor for sudden spikes (ex: 50% increase in memory utilization) and work with application owners to identify cause and potential bad kube-apiserver client behavior.
Key Benefits:
- Monitor important metrics such as kube-apiserver CPU and Memory utilization and etcd database utilization.
- Anticipate and plan for scaling needs by clearly understanding your cluster’s control plane usage and limits.
- Mitigate potential downtime risks through proactive alerting on Apiserver memory usage or etCD database usage.
How to Enable/Use:
- These platform metrics are available by default.
- To view these metrics, sign in to the Azure Portal and navigate directly to your AKS cluster.
- From the left navigation menu, select Monitoring, then click Metrics.
- Under the “Container Service” Namespace, chose metric eg: API server memory percentage
 —
—
2. Preview: Monitoring Azure Container Storage
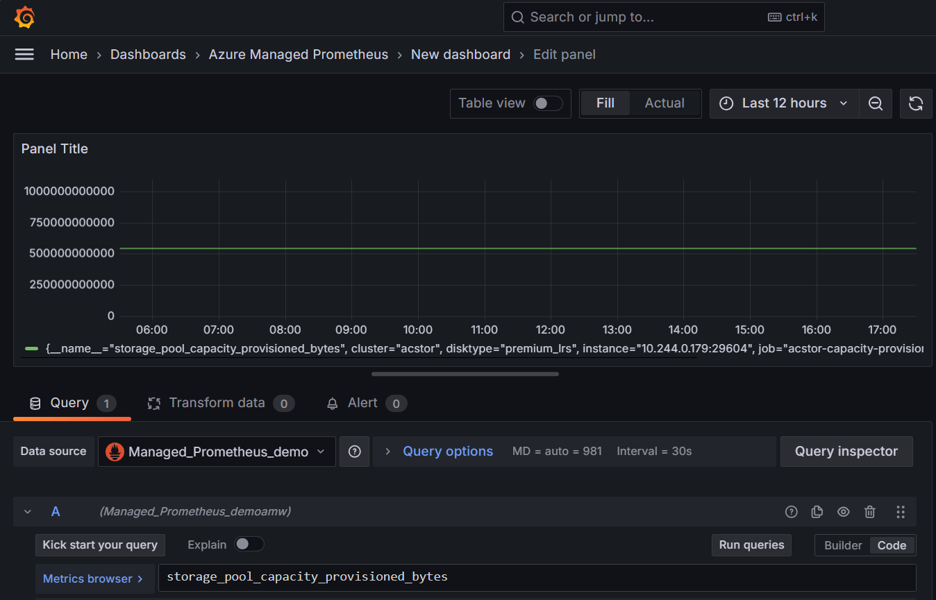
Reliable storage is essential for containerized applications, especially those requiring stateful interactions or persistent data management. To enhance the reliability and efficiency of container storage within AKS, we’ve recently introduced comprehensive Azure Container Storage Monitoring. This integration provides direct visibility into storage metrics, health statuses, and performance characteristics of Azure container storage pools and disks within Azure Monitor managed service for Prometheus. You can monitor the storage_pool_capacity_used_bytes metric to understand utilization and plan to provision additional storage capacity or for instance use disk_errors_total to help troubleshoot application failures caused due disk errors.
Key Benefits:
- Quickly pinpoint and address any performance bottlenecks or issues in your storage operations.
- Evaluate and optimize your storage usage by analyzing detailed consumption patterns through
storage_pool_capacity_used_bytesandstorage_pool_capacity_provisioned_bytes - Ensure consistently reliable and performant storage for all your critical workloads within AKS by alerting on disk read/write operations latency and
disk_errors_totalmetrics
How to Enable/Use:
- To start collecting Azure Container Storage metrics, enable Managed Prometheus on the AKS cluster.
- If your AKS cluster already has Managed Prometheus enabled, then installing Azure Container Storage on that cluster will automatically start collecting Azure Container Storage metrics.
3. GA: Monitor Node Auto-Repair using Kubernetes Events
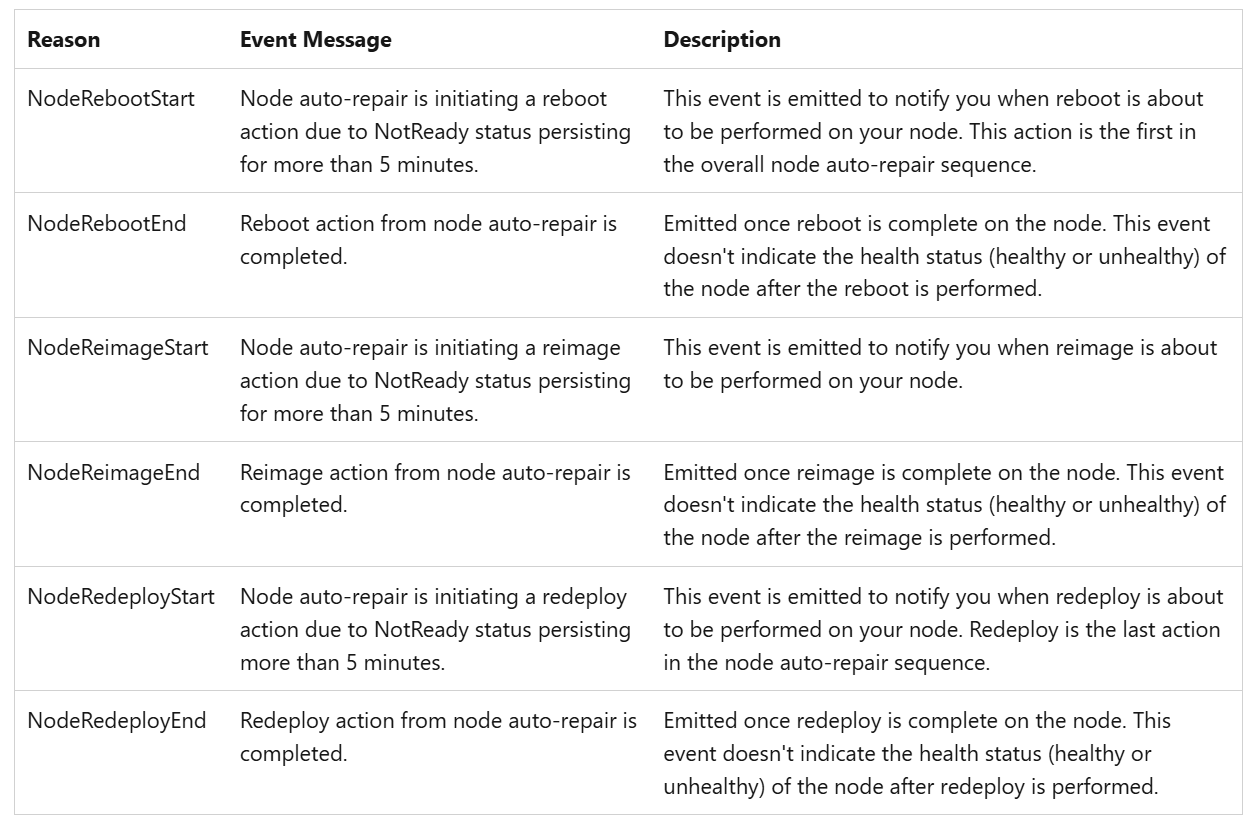
Node auto-repair in Azure Kubernetes Service (AKS) is an existing process that enhances reliability by automatically detecting and fixing unhealthy nodes. AKS now provides real-time Kubernetes events for node auto-repairs, significantly improving visibility and responsiveness. This allows you to monitor AKS remediation and node-repair actions on nodes, and follow their success/status to understand if user intervention is needed or to understand the cause (aks auto-repair) of sudden node reboots/re-image.
Key Benefits:
- Real-time visibility into the status of node repairs, allowing you to promptly understand when and why a node is being repaired.
- Quickly diagnose underlying issues affecting node health and mitigate impact on your workloads by tracking these specific events.
- Configure alerts on node auto-repair events to receive automatic notifications on node health issues without constant manual monitoring.
- Analyze trends in repair events to identify infrastructure health improvements, such as adjusting node types or optimizing workloads.
How to Enable/Use:
- No additional steps are required by users; these events are automatically enabled for all AKS clusters and persisted for 1 hour.
- To query and store Kubernetes events beyond 1 hour, enable the Container Insights add-on for deeper visibility into your cluster health.
Users can reproduce node failures through Azure Chaos Studios or Chaos Mesh and monitor the remediation actions taken through kubernetes events
kubectl get events --field-selector=source=aks-auto-repair --watch
Reduce effort for best-in-class observability
4. Preview: Application Insights Auto-Instrumentation for Kubernetes
Historically, implementing monitoring for applications involved manual instrumentation, a process that could be cumbersome and error-prone, causing delays in deployment cycles. To simplify this significantly, AKS now supports Application Insights Auto-Instrumentation. This feature eliminates the manual effort traditionally required, enabling effortless integration of monitoring solutions. Currently, we support auto-instrumentation for Java and NodeJS applications. Operators can enable auto-instrumentation at whole cluster/namespace level to enforce collection of basic application metrics or developers can enable at namespace/deployment level to reduce their operational overhead of instrumenting the application for metrics, traces etc.
Key Benefits:
- Automatically instrument applications, eliminating the need for developers to make manual adjustments or modifications.
- Easily distinguish between platform and application issues
- Ensure consistent and comprehensive monitoring across all applications deployed within your AKS environment.
- Rapidly detect, diagnose, and resolve application performance bottlenecks using detailed, actionable telemetry data in Azure Monitor Application Insights.
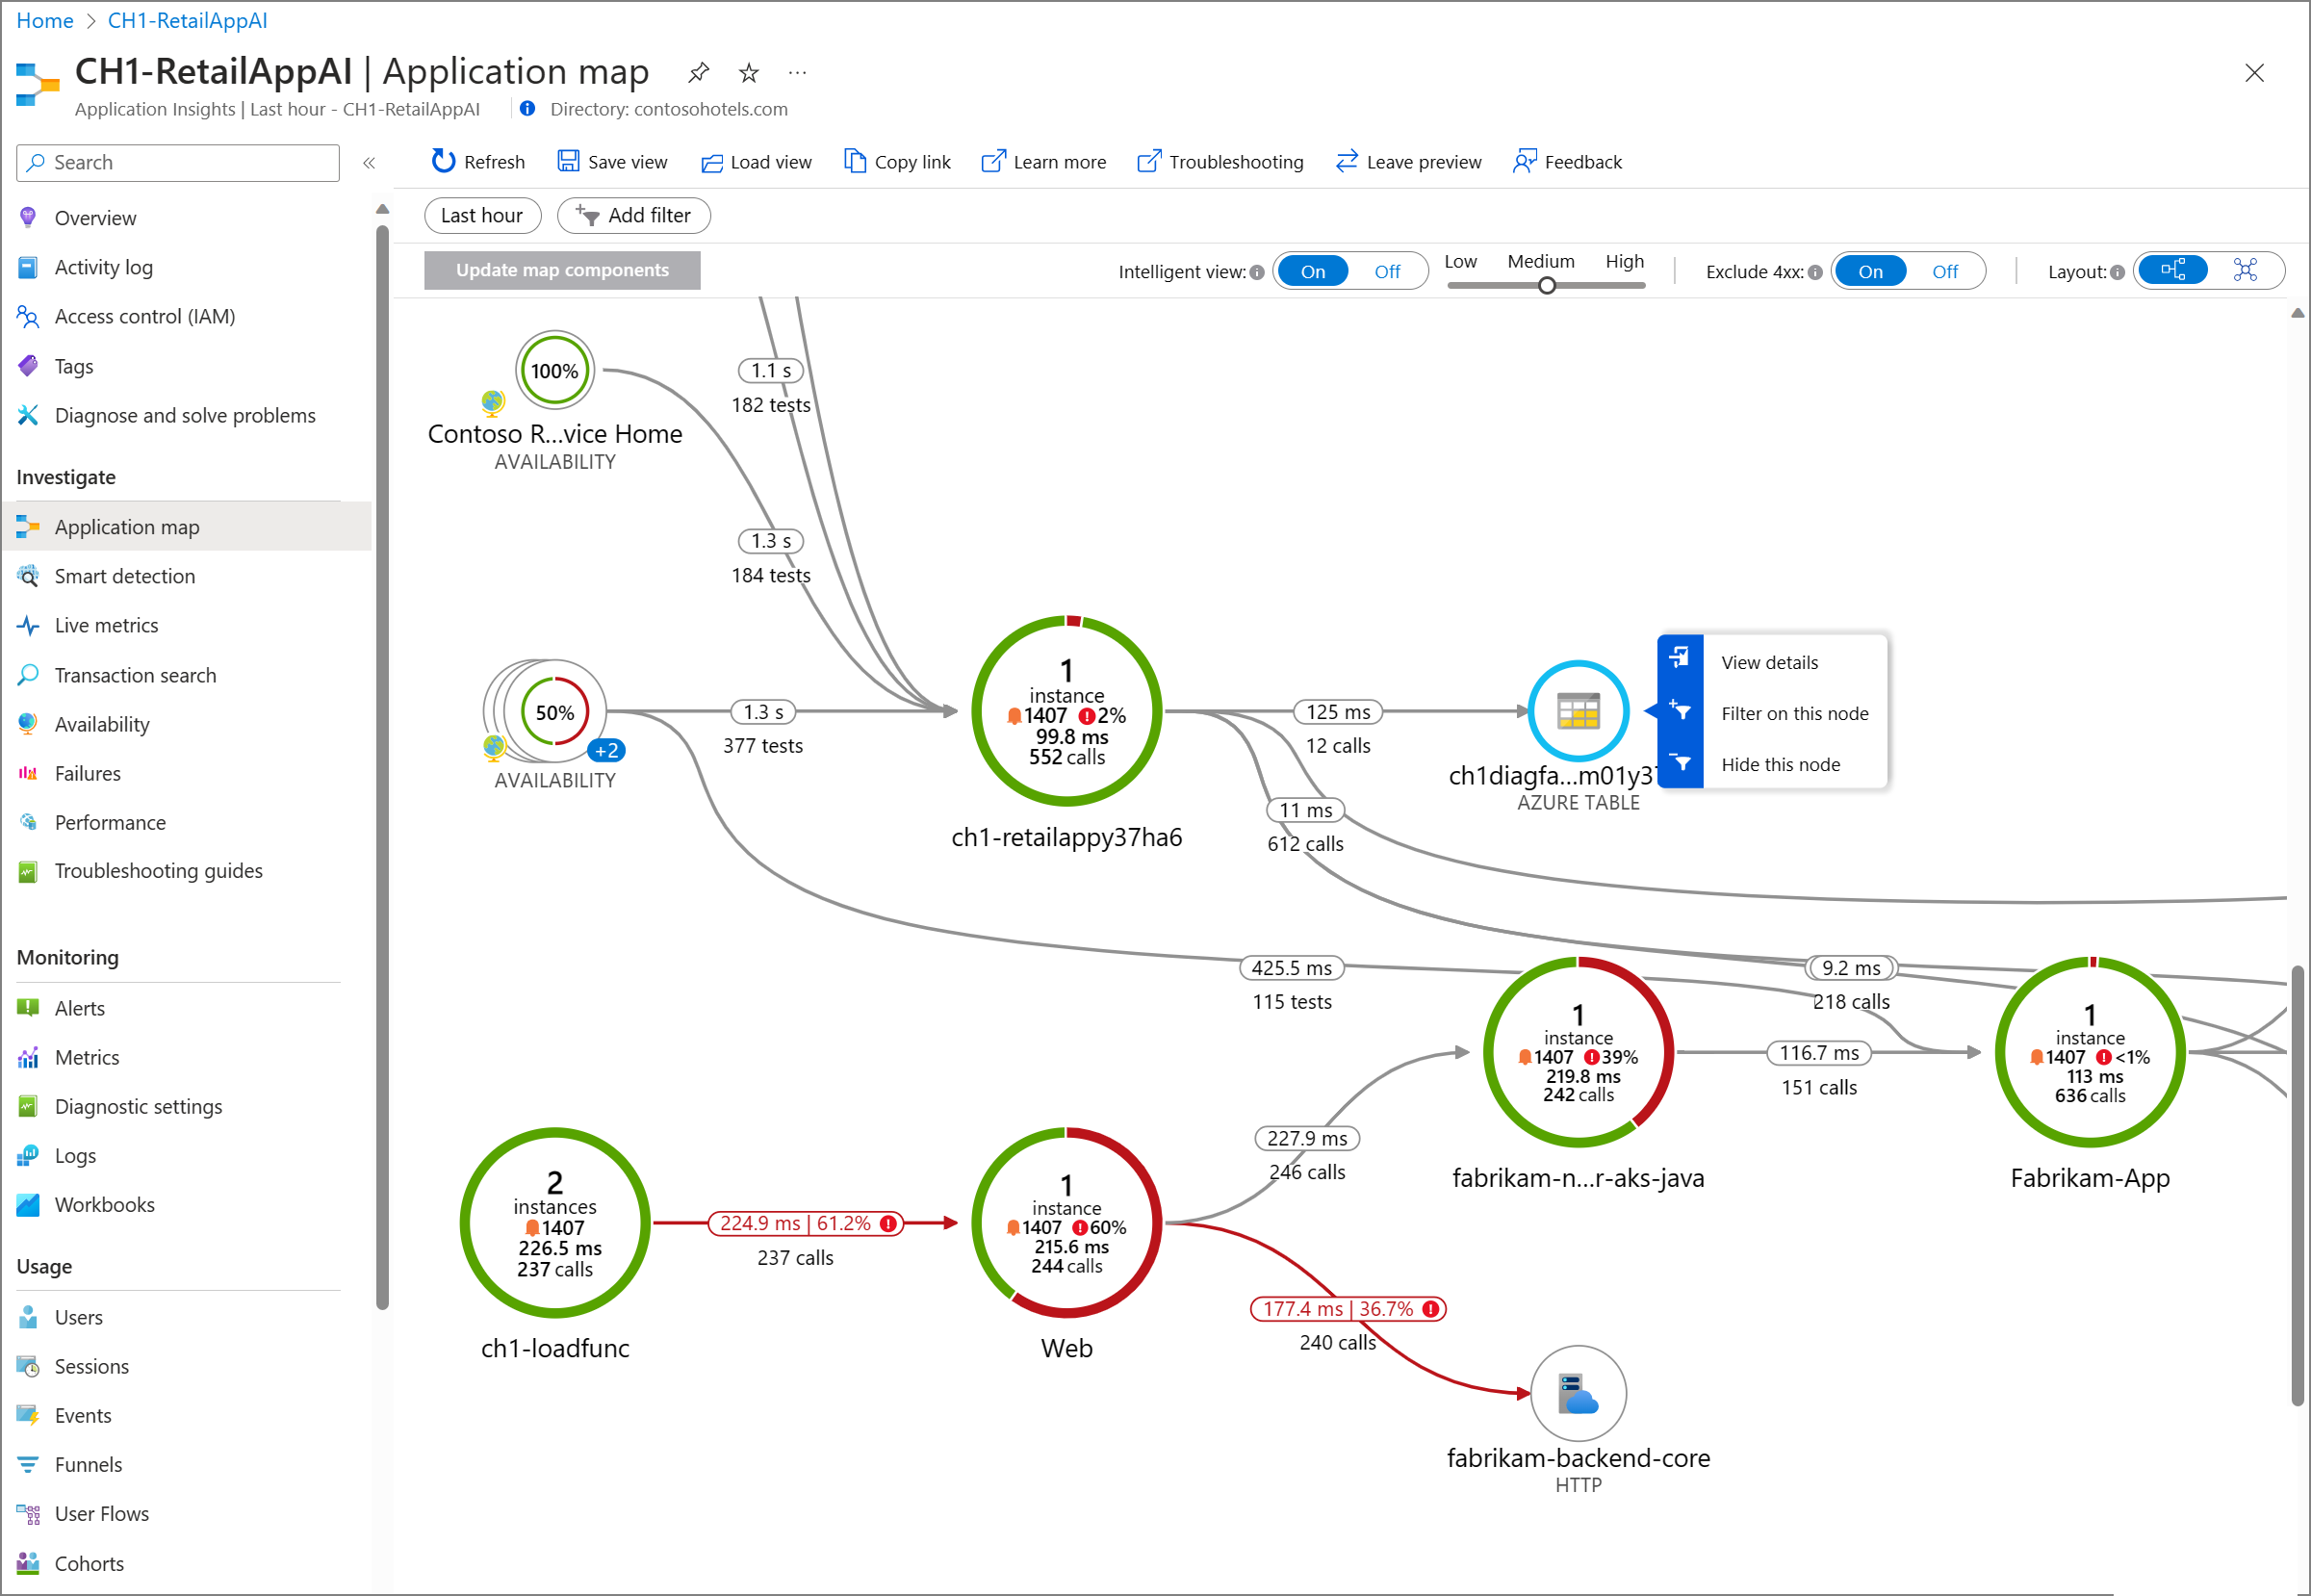
For example: Break down E2E latencies into individual containers/microservices response latencies through trace graphs or isolating high failure rate to individual service HTTP error rate spikes.
How to Enable/Use:
- Enable the Application Insights extension on your AKS cluster through the Azure CLI or Azure Portal.
# Register the feature flag for Azure Monitor App Monitoring in preview az feature register --namespace "Microsoft.ContainerService" --name "AzureMonitorAppMonitoringPreview" - Set up a Custom Resource in your Kubernetes namespace to configure auto-instrumentation parameters.
- Deploy or redeploy your applications; instrumentation will be automatically applied without any changes to your application code.
- See detailed steps for enabling here.
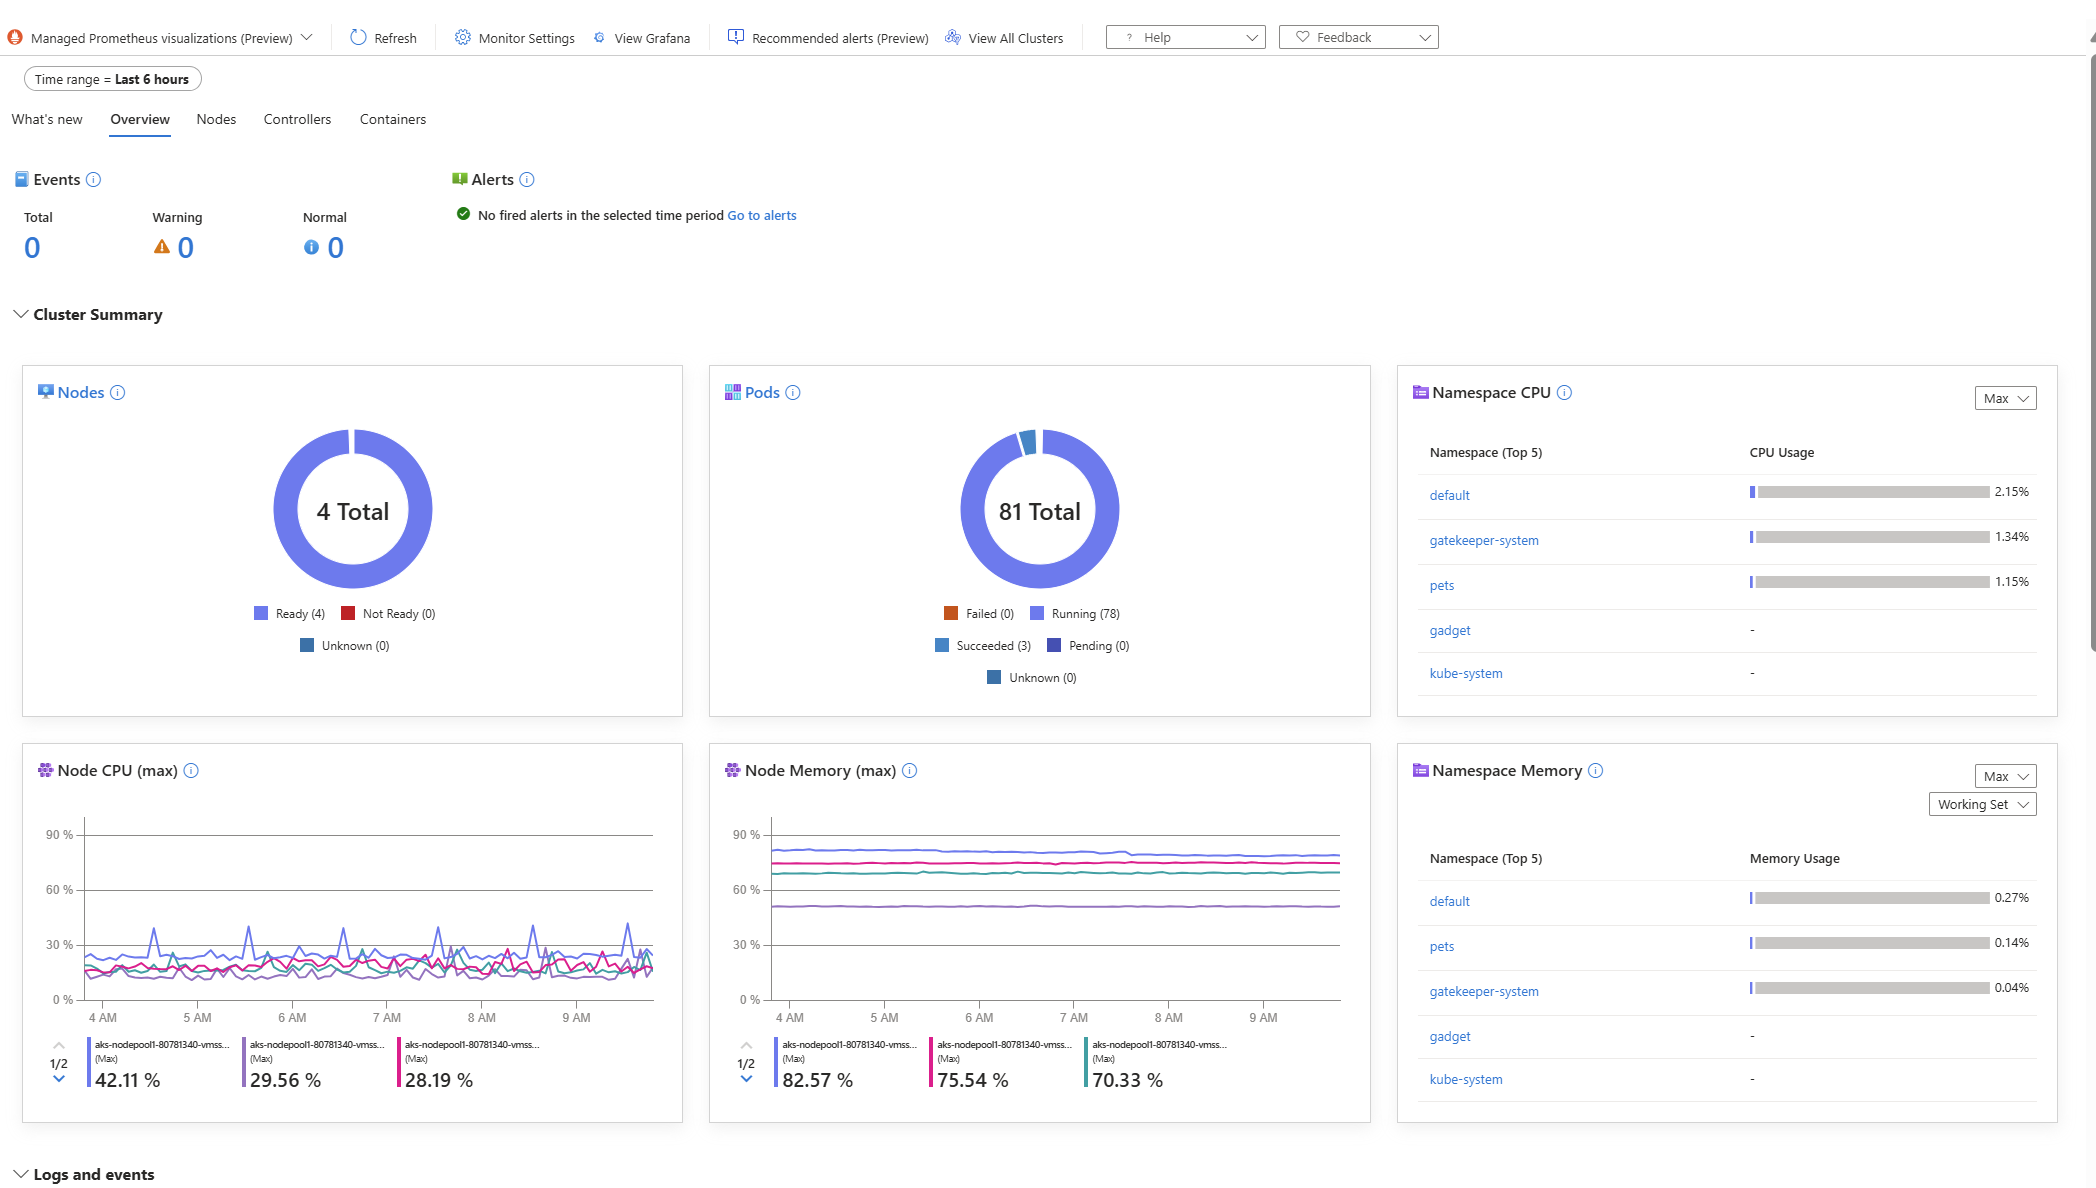
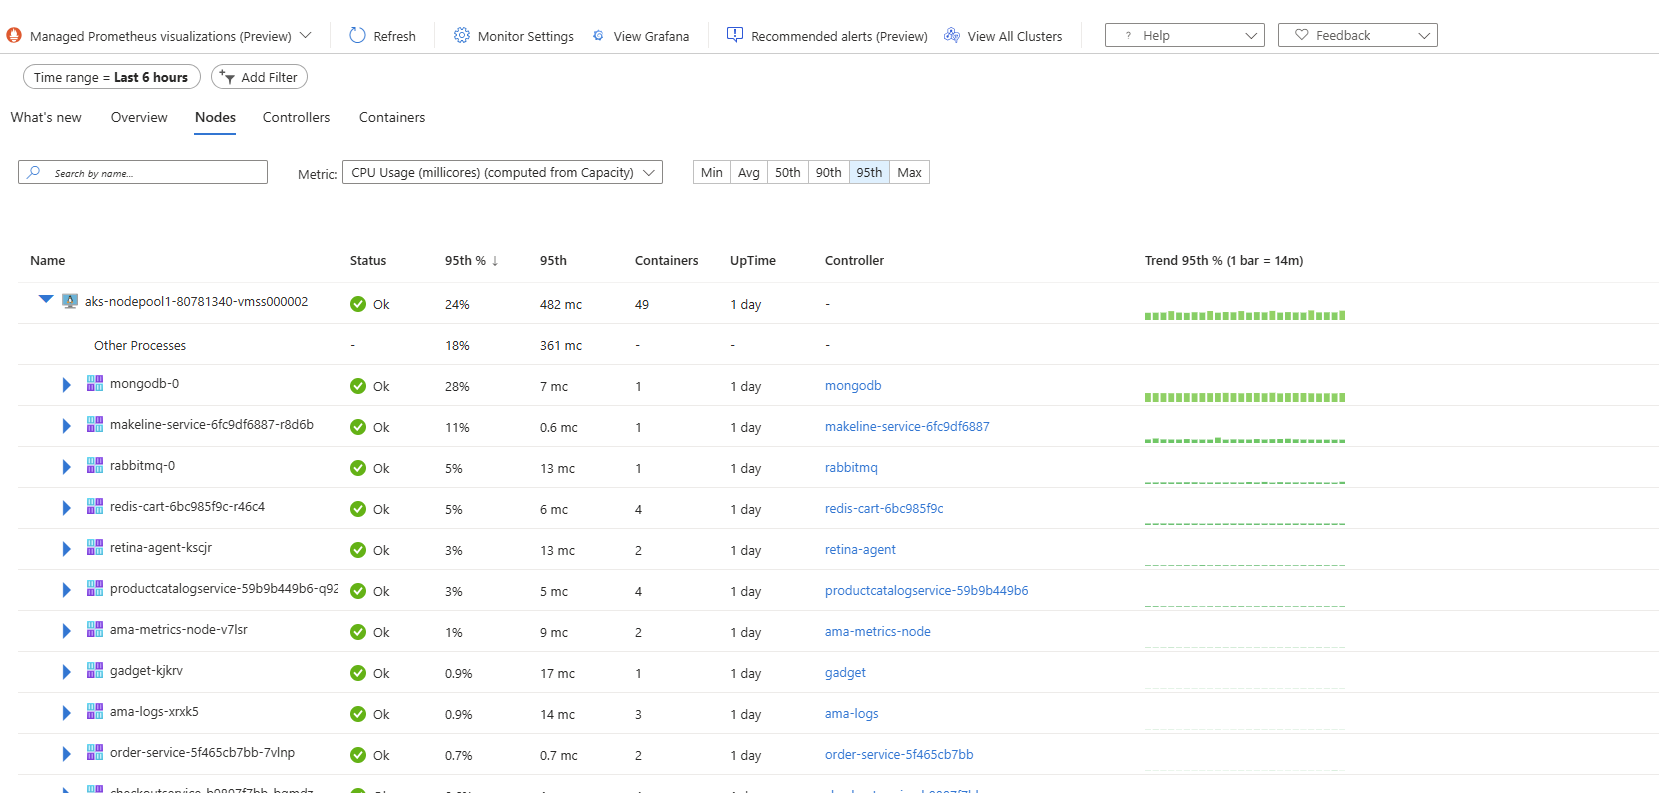
5. Preview: Unified AKS Monitoring Experience in Azure Portal
Managing Kubernetes effectively requires navigating multiple monitoring solutions, logs, metrics, and alerts, which can complicate the operational experience. To streamline this complexity, AKS recently launched the Unified AKS Monitoring Experience within the Azure portal in Preview. This feature integrates various monitoring capabilities into a single, coherent interface, significantly enhancing ease of use and enabling you to understand the health of resources, triage issues across the E2E stack and bring various datasources into a single view.
Key Benefits:
- Immediate access to essential health metrics and comprehensive insights across multiple data sources such Standard Load Balancer, Virtual Machine Scale Set, Networking etc attached to the AKS cluster.
- A cohesive interface to simultaneously view logs, alerts, metrics, and other critical monitoring data.
- Enhanced troubleshooting capabilities through correlated insights, enabling quicker identification and resolution of issues.
How to Enable/Use:
- Open your AKS cluster resource within the Azure Portal.
- Select Monitor from the sidebar navigation.
- Choose the Managed Prometheus Visualizations (Preview) option to begin exploring consolidated insights and metrics.
Better Reliability and Performance
6. Enhanced Metrics Reliability and Performance
To ensure reliable and efficient observability, AKS heavily utilizes Prometheus under the hood. Recently, we’ve implemented several key optimizations to improve Prometheus performance, significantly reducing the occurrence of memory-related issues such as OOMKills at large scale. This helps with reliable platform metric collection and remediation actions such as node auto-repair, which depend on metric availability.
Key Benefits:
- Greater stability and reliability of Prometheus monitoring components, leading to lower instances of OOMKills.
- Enhanced resource utilization, resulting in smoother cluster operations.
- Default limits on cardinality for scraped metrics.
How to Enable/Use:
- These improvements are enabled by default for all AKS clusters, and no user actions are needed.
7. GA: Azure Monitor Managed Prometheus Horizontal Pod Autoscaling (HPA)
The Azure Monitor Managed service for Prometheus now supports Horizontal Pod Autoscaling (HPA) for the ama-metrics replica set pod. . This feature ensures that pods responsible for scraping Prometheus metrics automatically scales based on memory utilization, significantly improving reliability and optimizing the resource footprint on user’s nodes.
Key Benefits:
- Automatic scaling of
ama-metricspods to efficiently handle metrics scraping workloads. - Configurable replica counts (between 2 and 12 replicas), enabling you to tailor scaling behaviors to your workload needs.
- Prevention of OOMKills and resource waste through dynamic scaling.
How to Enable/Use:
- This feature is enabled by default with Azure Monitor Managed Prometheus.
- You can customize the replica count settings directly through your AKS cluster settings. See more here.
Looking Ahead
At Azure, we’re deeply committed to continuously enhancing AKS observability, reliability, and operational ease. These recent advancements underscore our ongoing dedication to ensuring your Kubernetes environments are stable, scalable, and straightforward to manage. Stay tuned as we continue to innovate, ensuring AKS remains the premier solution for running Kubernetes workloads at scale.
We would love to hear from you on what we can do better. Please share your feedback by creating feature requests/bug reports on our GitHub Project.