Auto-Healing and Crash Monitoring integration with Azure Monitor
Auto-healing is a heavily used diagnostic feature of Azure App Service that allows end-users to configure a rich set of triggers that can be used to mitigate an app once it starts misbehaving. It not only allows you to mitigate the app from a bad situation but it also allows customers to capture diagnostic data that helps them debug the issues later.
Crash Monitoring and Proactive Crash Monitoring allow end-users to effectively diagnose and debug application crashes (process exits due to unhandled exceptions) easily.
One of the most asked features for both these features was the ability to view historical information about when these tools were triggered and what conditions cause them to trigger. Customers have also asked us to be able to view this information for a longer duration as by default the views available in Diagnose and Solve blade show you a maximum of 24 hours of information.
Announcing Auto-healing and Crash Monitoring integration with Azure Monitor
We are happy to announce the integration of App Services Auto-Healing and Crash Monitoring feature with Azure Monitor. With this integration, you can identify when an app was recycled, the number of times it was recycled and due to what condition. You can also identify application code that leads to a crash for your app. Azure Monitor integration allows you to configure alerts and actions to be taken when any of these events are triggered. You can choose for how long you want this data to be retained and use Log Analytics to query this data and setup alerts as per your requirement.
Integrating Auto-Healing and Crash Monitoring with Azure Monitor
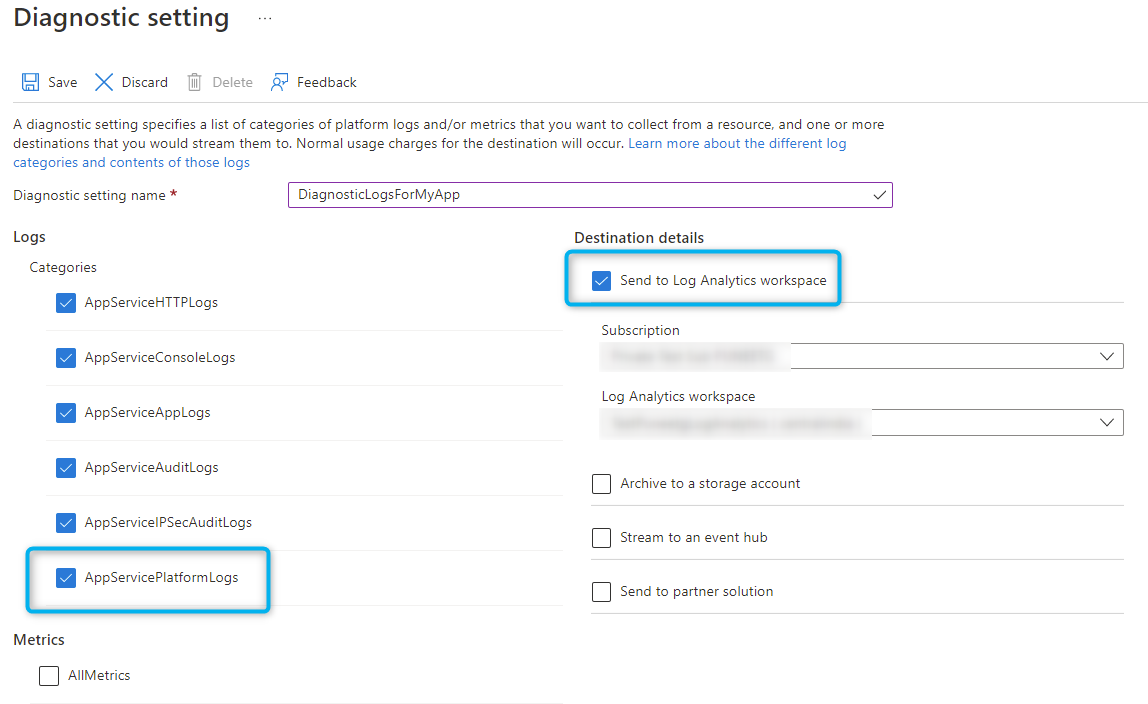
- To integrate Azure Monitor with these diagnostic tools, navigate to Diagnostic Settings for your App in the Azure Portal and click on Add Diagnostic Setting.
- Give a descriptive setting name and make sure AppServicePlatformLogs category is selected
- Choose the destination per your choice. In the below example, I choosing to send the data to a Log Analytics workspace and I chose an existing Log Analytics workspace in my subscription.
And that’s it !!!
Viewing Auto-Healing events in Log Analytics
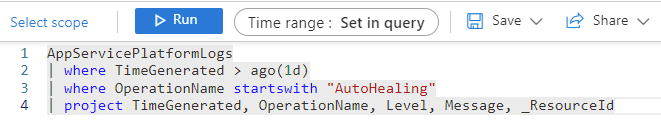
Whenever Auto-Healing takes action based on the configured triggers, the events can be viewed in AppServicePlatformLogs table in log analytics workspace. To view the data, just click on Logs for your App and run a query like below
AppServicePlatformLogs
| where TimeGenerated > ago(1d)
| where OperationName startswith "AutoHealing"
| project TimeGenerated, OperationName, Level, Message, _ResourceId

The Message column helps identifying the action invoked and the trigger. For e.g. in the above event, we see this
Worker Process successfully launched custom action ‘D:\home\data\DaaS\bin\DaasConsole.exe’ due to ‘Total Requests’ limit
The OperationName column will have one of the three values based on the action chosen in the Auto-Healing configuration.
- AutoHealingCustomAction
- AutoHealingRecycle
- AutoHealingLogEvent
Viewing Crash Monitoring events in Log Analytics
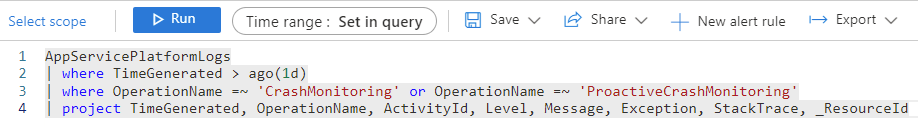
Whenever crash monitoring or proactive crash monitoring captures a memory dump or records a call-stack of the crashing thread, records will be generated in the AppServicePlatformLogs table in Log Analytics workspace. Information about the dump file and the time the dump file is copied to storage will also be logged. To view the data, just click on Logs for your App and use a query like below
AppServicePlatformLogs
| where TimeGenerated > ago(1d)
| where OperationName =~ 'CrashMonitoring' or OperationName =~ 'ProactiveCrashMonitoring'
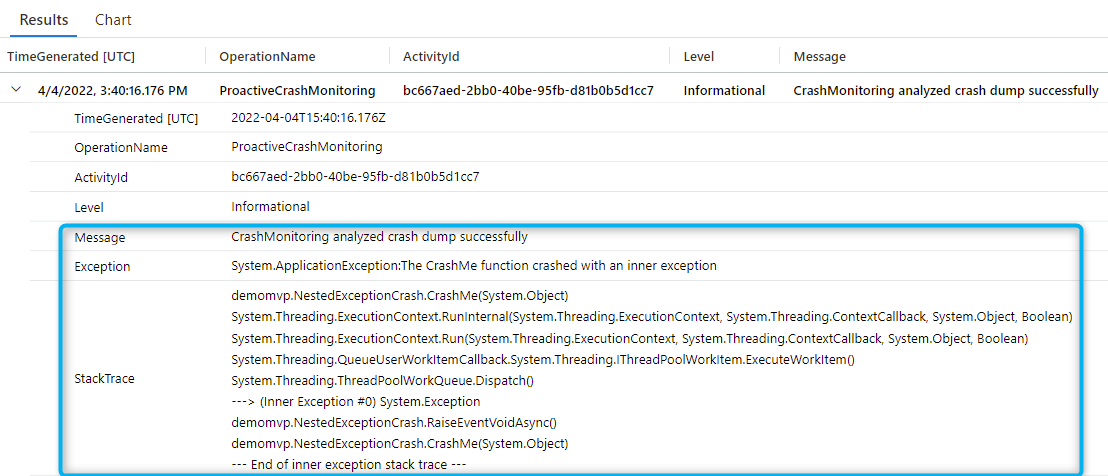
| project TimeGenerated, OperationName, ActivityId, Level, Message, Exception, StackTrace, _ResourceId
You may have to choose the ActivityId, Exception and StackTrace columns from the Columns side panel to see all the above information
Configuring alerts on these Events
To configure an alert, write the Log Analytics query as per your requirement and choose New Alert Rule from the ribbon and follow the rest of the configuration. For more information, refer to Create, view, and manage log alerts using Azure Monitor
We hope this helps in identifying auto-healing and crash monitoring invocations easily and set up alerts around these events which will help you effectively diagnose and troubleshoot your apps hosted on App Service.
Happy Debugging!