Observability
We recommend that you use Azure Monitor for observability when working with the starter kit. To observe the system, we make use of metrics and logs, but we do not support distributed tracing for the starter kit. However, you will get some limited tracing functionality between the Network Server and its dependencies, but only if you decide to use Azure Monitor.
Even if you decide to not use Azure Monitor, you can always access metrics in Prometheus format on the Network Server at the path /metrics, similarly to how you can access built-in metrics on IoT Edge. The Network Server will always expose logs via the standard output and standard error.
Integrating with Azure Monitor
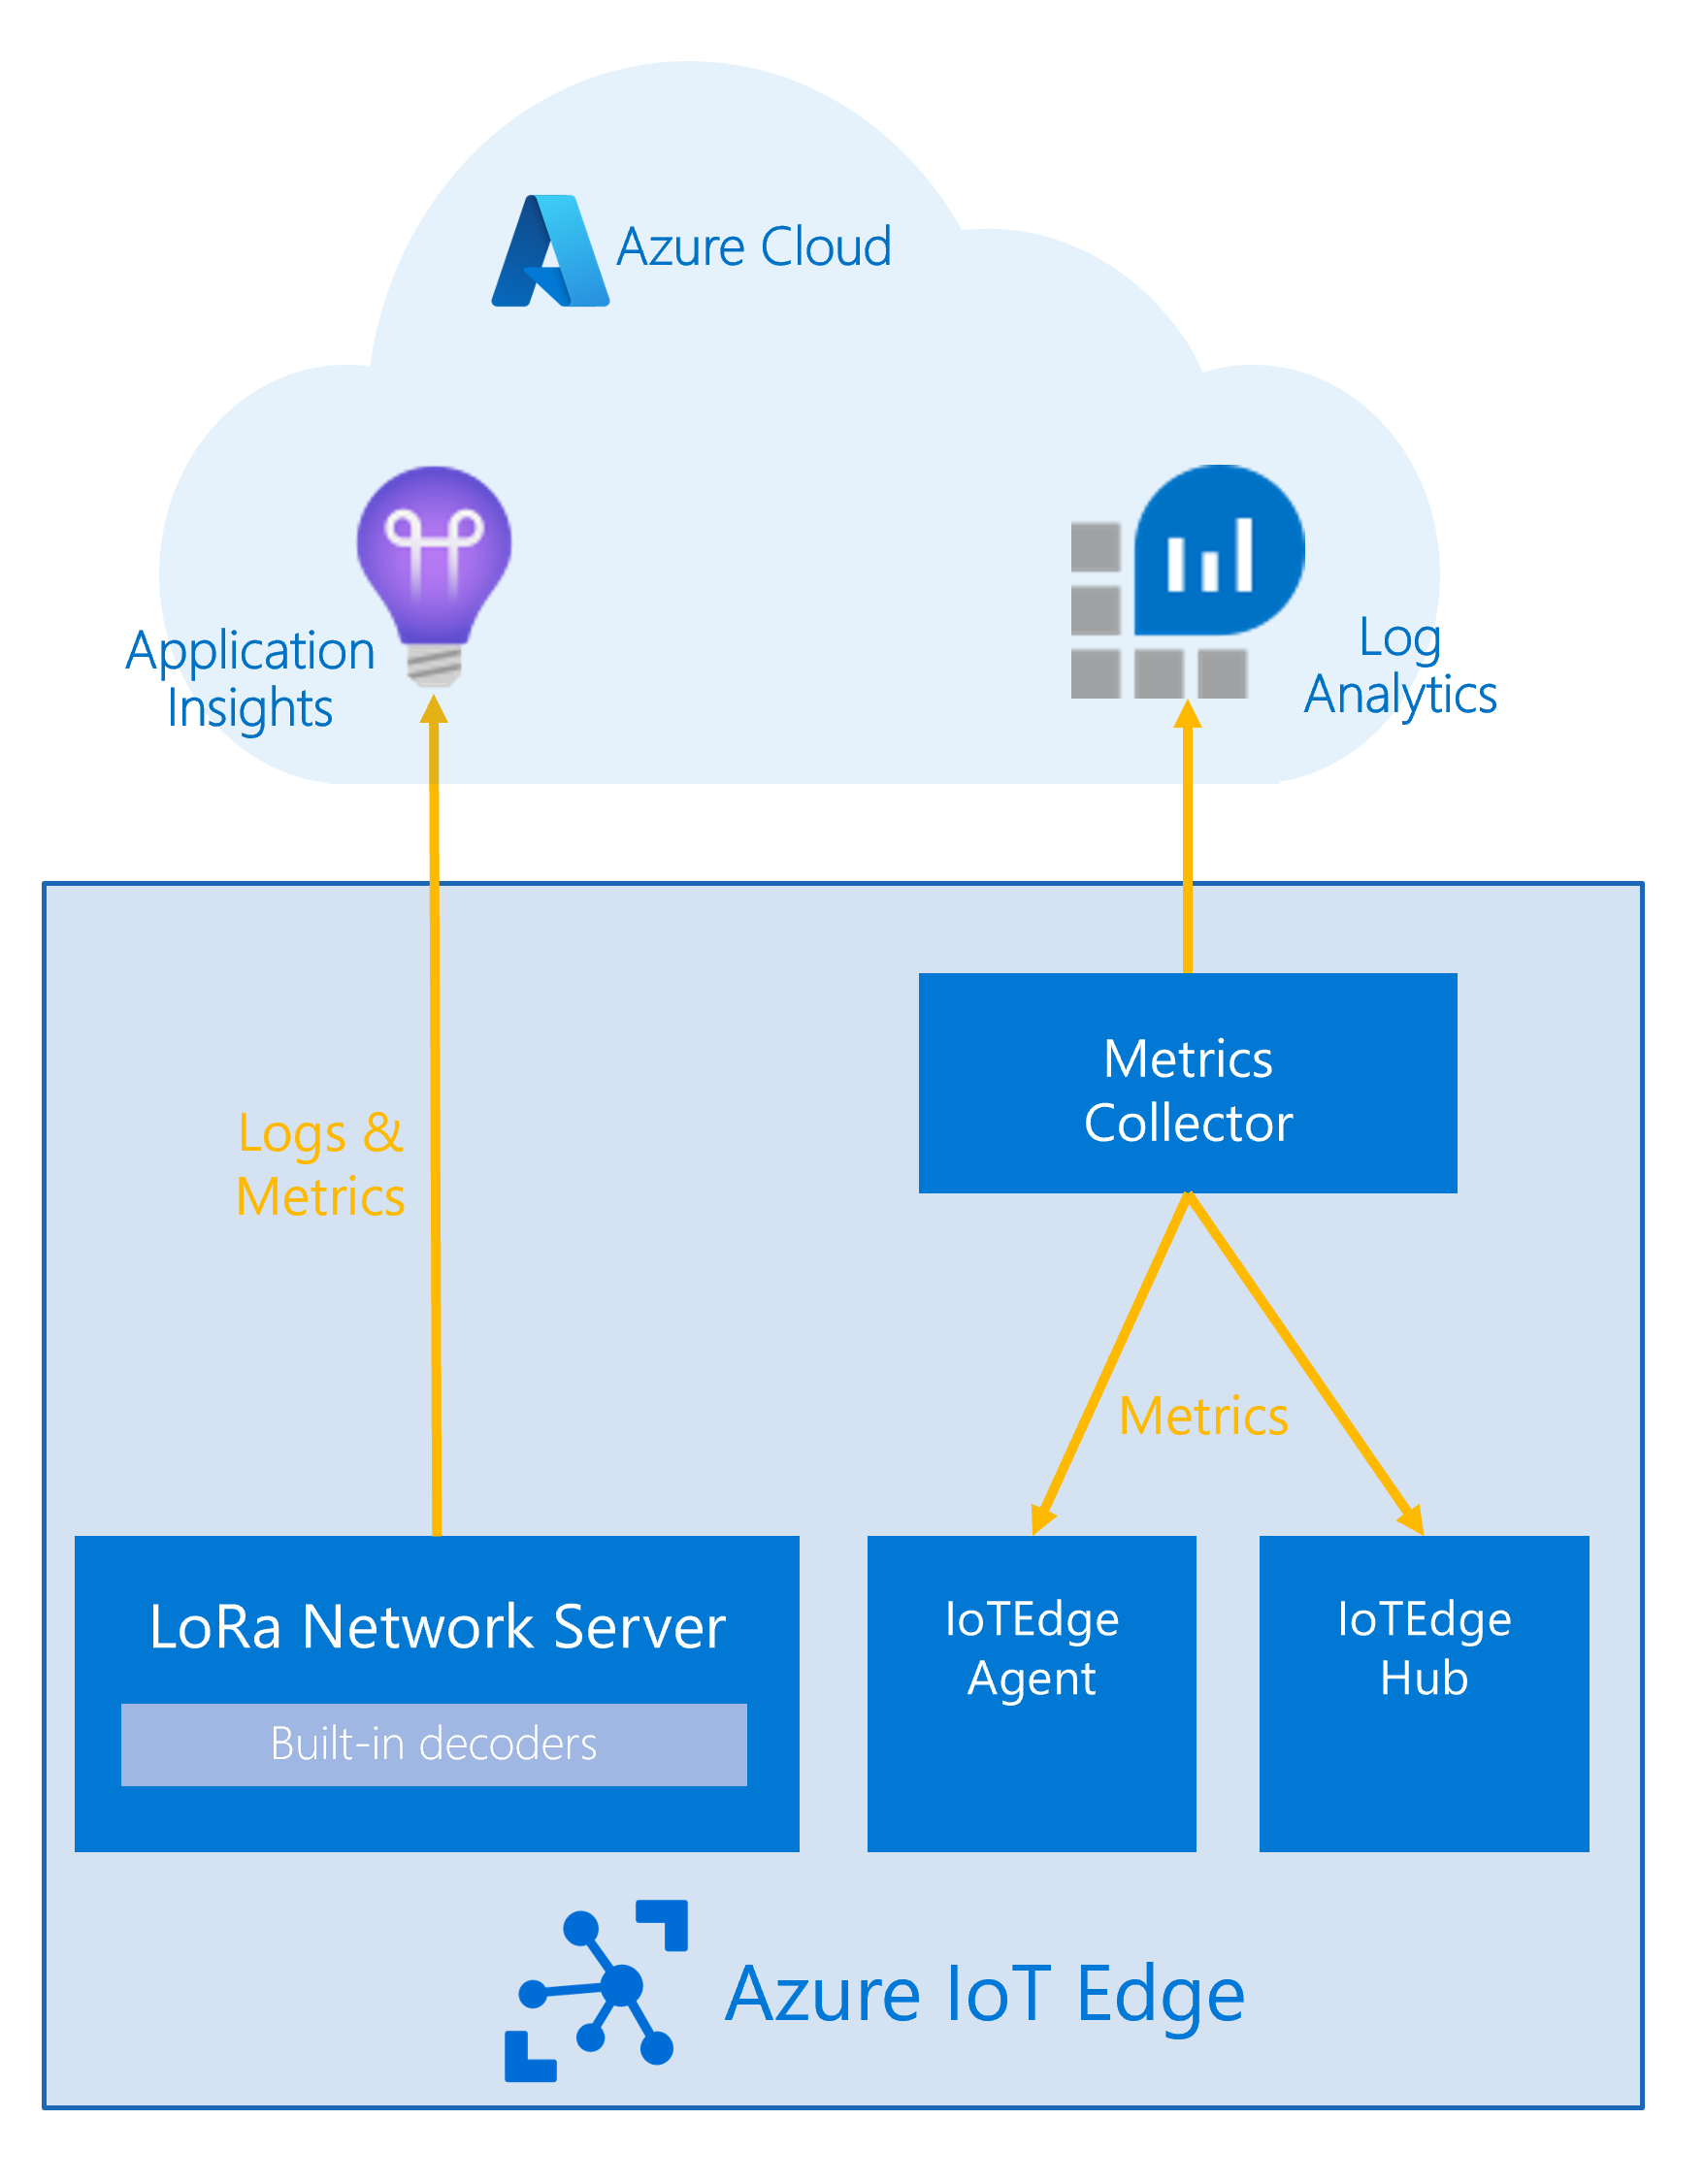
If you decide to use Azure Monitor, you will need to create an Application Insights instance and a Log Analytics workspace in your Azure subscription. Follow the steps in the Dev Guide to learn how to deploy the engine components. To enable observability using Azure Monitor, ensure that the following settings in your .env file (also described in the Dev Guide) are used for the IoT Edge deployment:
APPLICATIONINSIGHTS_CONNECTION_STRING={application_insights_connection_string}
IOT_HUB_RESOURCE_ID=/subscriptions/{subscription_id}/resourceGroups/{resource_group}/providers/Microsoft.Devices/IotHubs/{iot_hub_name}
LOG_ANALYTICS_WORKSPACE_ID={log_analytics_workspace_id}
LOG_ANALYTICS_SHARED_KEY={log_analytics_shared_key}
Generate a deployment manifest from deployment_observability.layered.template.json and deploy it to the edge devices for which you want to apply the observability. The template will set up the metrics collector module on the edge and connect it with your Log Analytics instance. The gateway will connect directly to your Application Insights instance, if you make sure to set the APPLICATIONINSIGHTS_CONNECTION_STRING before deploying the deployment.template.lbs.json solution. The Application Insights log level will always be the same as the console log level.
Integrating with the Elastic stack
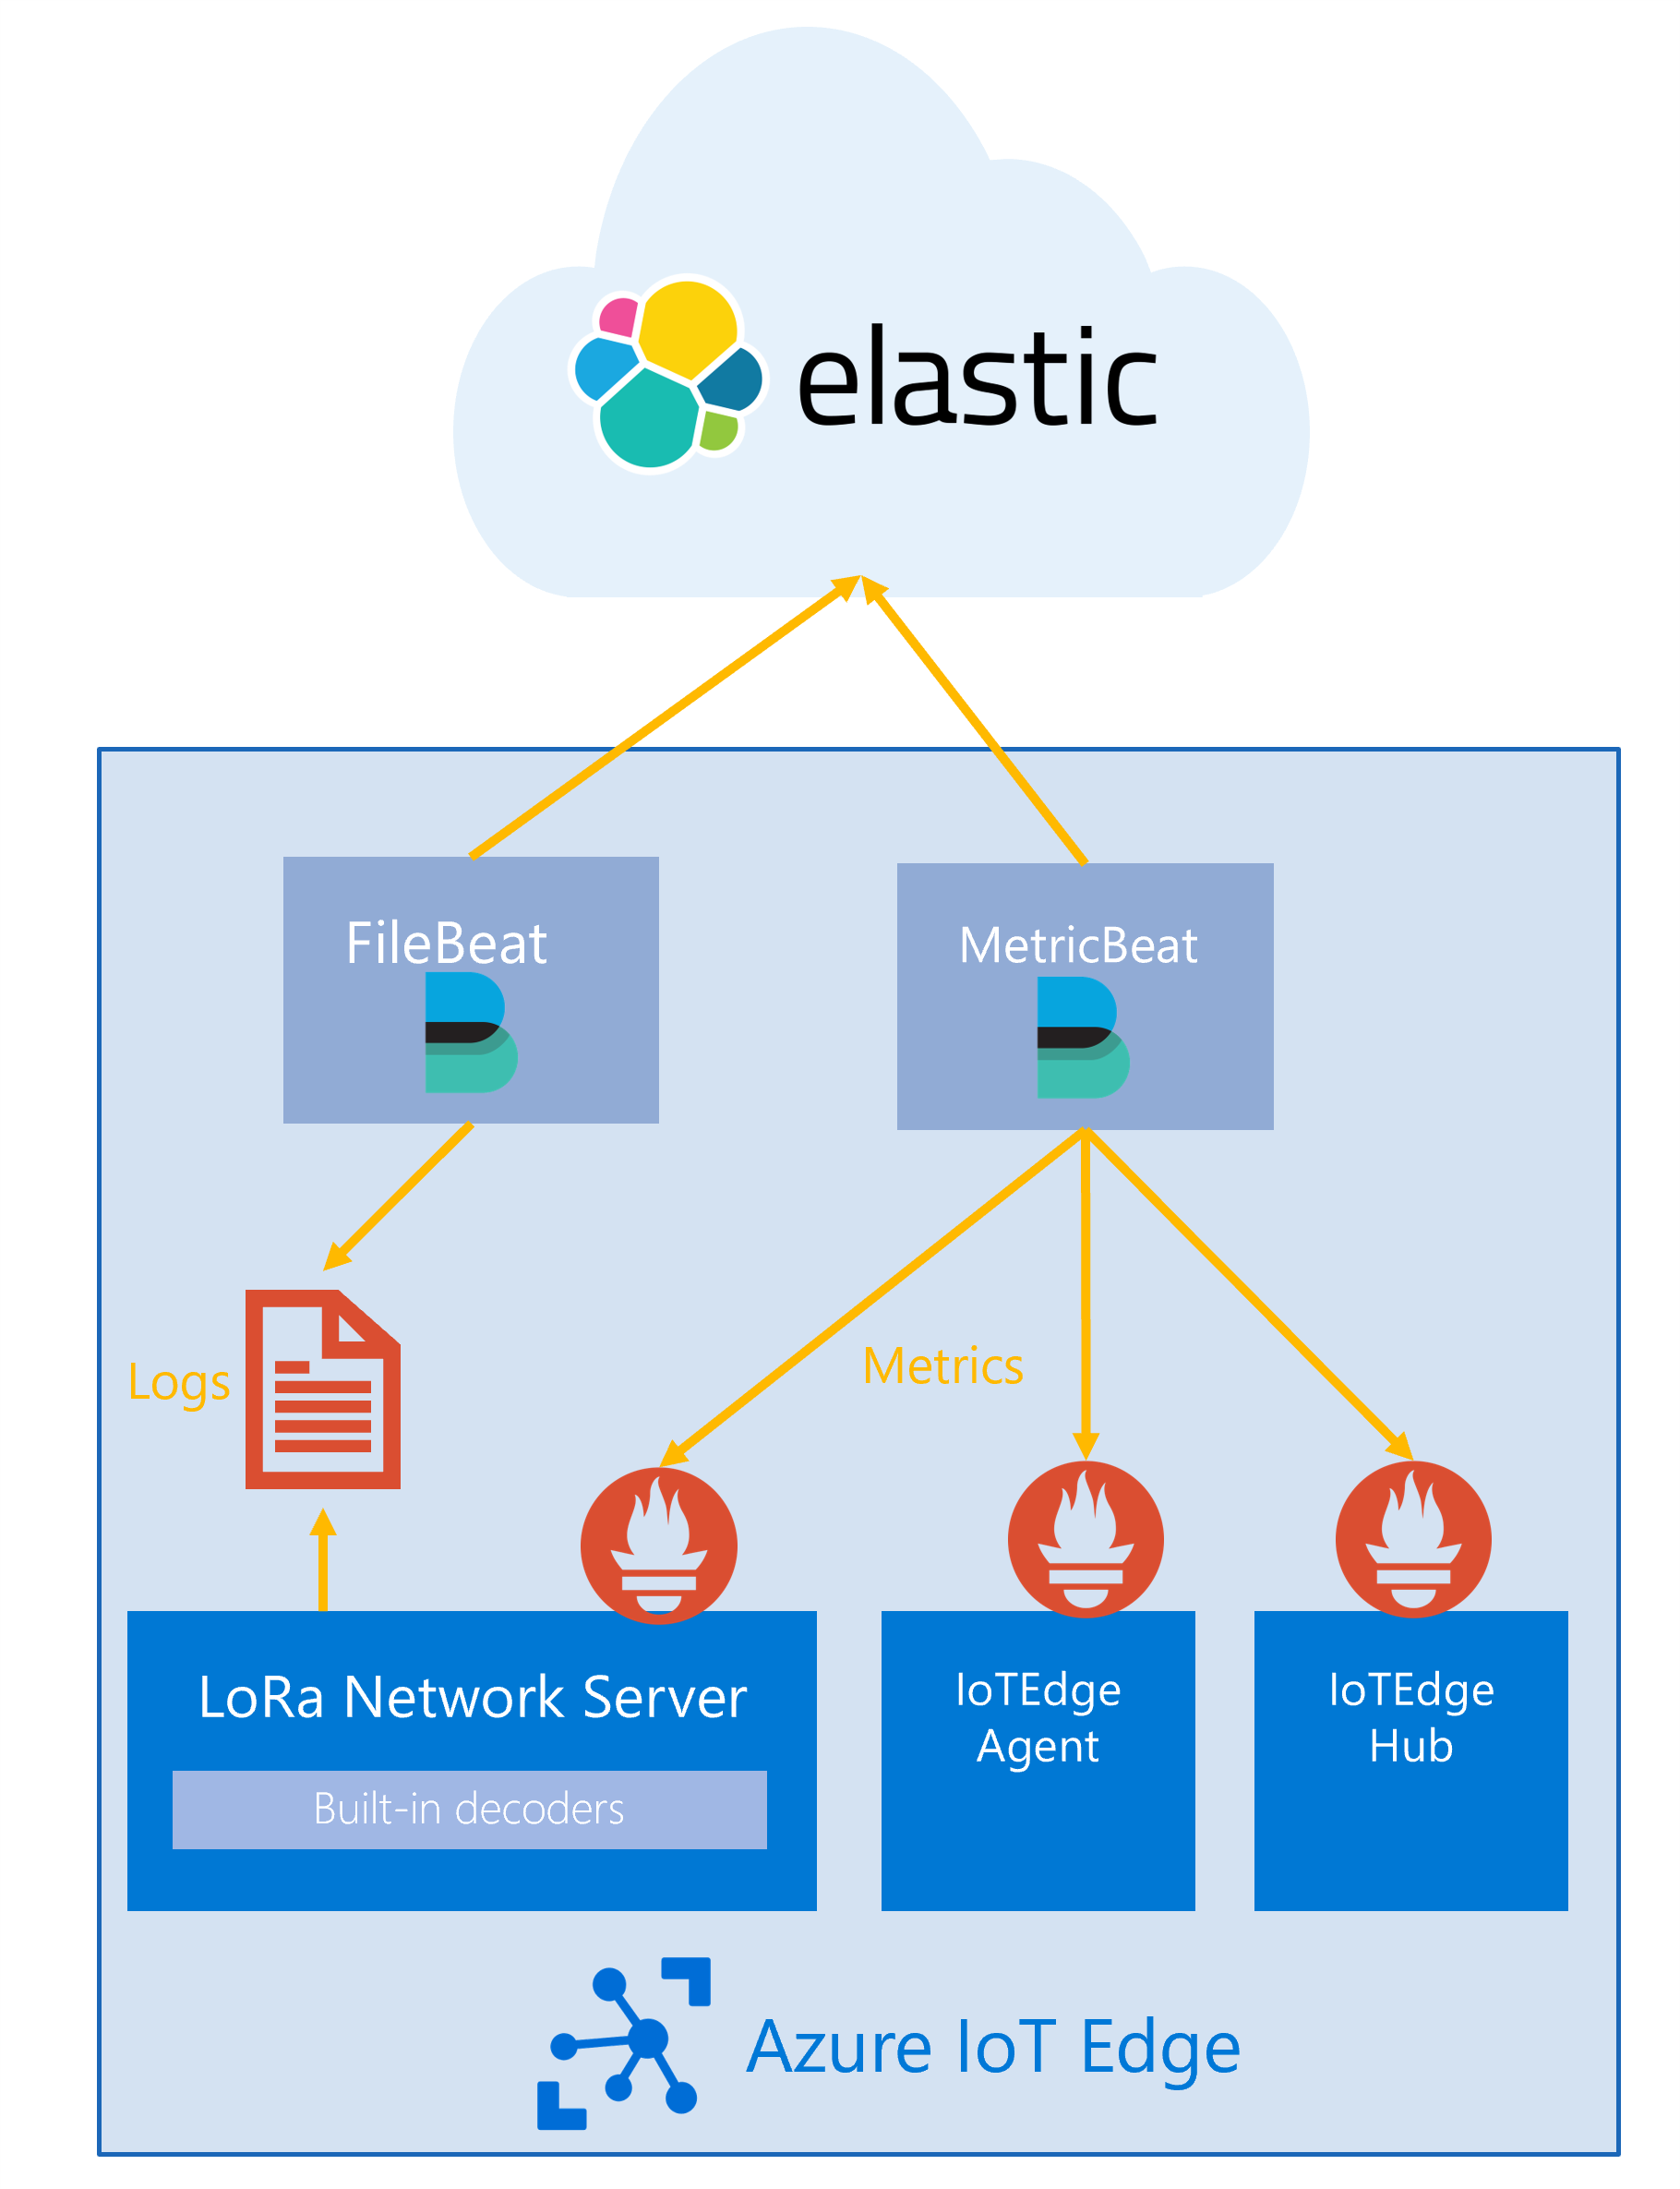
In this section we describe an example setup that may help you to get started if you decide to use the Elastic stack for the engine observability. We will assume that you have set up the Elastic stack already, and that you now want to integrate the engine components with ELK. If you do not have the Elastic stack set up yet, refer to Elastic's documentation and set it up before you continue with this example.
To integrate the starter kit into your ELK stack, we rely on Metricbeat to scrape metrics from the Prometheus endpoints of the IoT Edge modules (Network Server, Edge Hub and Edge Agent). Since Metricbeat requires access to the metric endpoints on IoT Edge, we will deploy it as an IoT Edge module, too.
Warning
To run Metricbeat on Docker you will need to make sure that you run IoT Edge on a supported OS/Architecture. At the time of writing, the Metricbeat Docker image does not work on ARM.
To ensure that the Metricbeat is aware of all metrics endpoints that it needs to scrape and the ELK backend for the export, we need to first configure it correctly. Typically, to configure Metricbeat on Docker, we rely on a configuration file, which we will call metricbeat.yml in the following. Before we discuss how to make this file available inside the Docker container, we discuss how we need to change metricbeat.yml to support IoT Edge metrics collection.
We rely on the Prometheus module to ship metrics from the Prometheus endpoints on the IoT Edge to the ELK stack. Make sure that you add the Prometheus module configuration to your metricbeat.yml. A basic configuration snippet might look like this:
...
metricbeat.modules:
- module: prometheus
  period: 10s
  metricsets: ["collector"]
  hosts: ["LoRaWanNetworkSrvModule:5000", "edgeHub:9600", "edgeAgent:9600"]
  metrics_path: /metrics
...
Note
If you configure the Network Server to use HTTPS, it will listen on port 5001 instead of 5000. If you use self-signed certificates for this, make sure that you configure the Prometheus module with your chain of trust.
Next, we need to make sure that the metricbeat.yml is available to the Metricbeat Docker container. You can either link module storage to device storage in IoT Edge to achieve this, in which case you have to take care of making metricbeat.yml available on the IoT Edge host system. Alternatively, you can deploy a custom image, containing a metricbeat.yml template, and then use environment variables in the configuration to set values that need to be configurable between deployments. Independent of which approach you choose, you should amend your IoT Edge deployment template with something similar to:
{
  "modulesContent": {
    "$edgeAgent": {
      "properties.desired": {
        "schemaVersion": "1.0",
        ...,
        "modules": {
          ...,
          "metricbeat": {
            "settings": {
              "image": "{IMAGE_PATH}",
              "createOptions": "{\"User\":\"root\",\"HostConfig\":{\"Privileged\":true},\"Binds\":[\"/var/run/docker.sock:/var/run/docker.sock:ro\",\"sys/fs/cgroup:/hostfs/sys/fs/cgroup:ro\",...]}"
            },
            "env": {
              "foo": {
                "value": "bar"
              }
            },
            "type": "docker",
            "version": "1.0",
            "imagePullPolicy": "on-create",
            "status": "running",
            "restartPolicy": "always"
          }
        }
      }
    },
    ...
  }
}
You can use environment variables, such as the foo=bar environment variable example, to replace environment variable references in your metricbeat.yml.
To ship logs to ELK, you can follow the same strategy using Filebeat instead of Metricbeat.
Created: 2022-01-04