Home | Deploy | User Guide | Tutorials | Administrator Guide | Application Integration | Support
Monitor Nodes
Node monitoring can be done thru the Monitoring / Azure CycleCloud menu which will open the Azure CycleCloud portal. From there you have a global view of all nodes being provisioned for the cluster, all organized in node arrays (aka slot_type for jobs), as defined in the queues section of the configuration file.
Nodes statuses are listed in the central pane. Nodes ready appears in green, provisioning in blue and deleting in red. Each node will have a status message with more details.
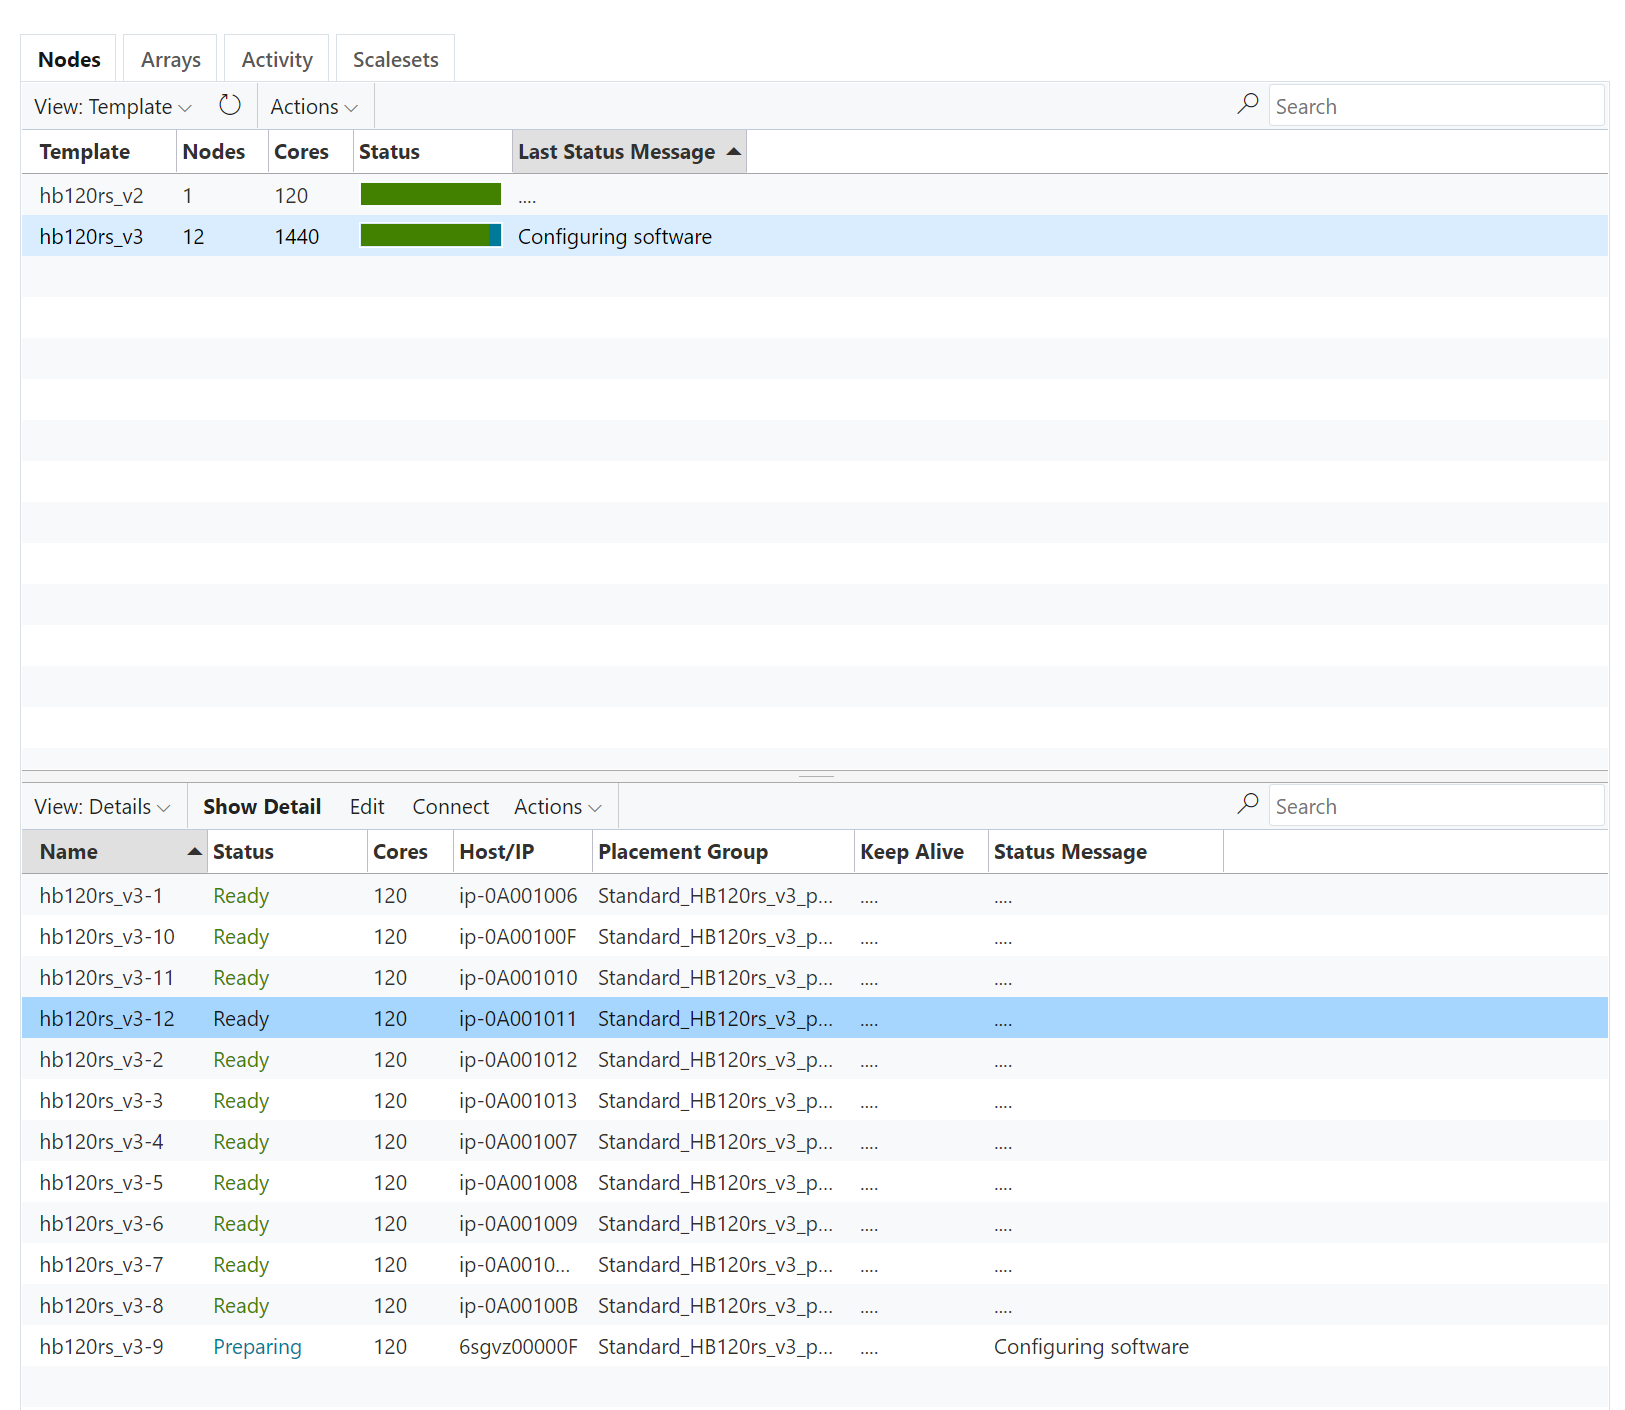
Note : There is an identified bug that shows ‘Failed to create node’ at the beginning of each node creation. This error can be avoided and the node creation process will continue
You can double click on one of the node to see more details.
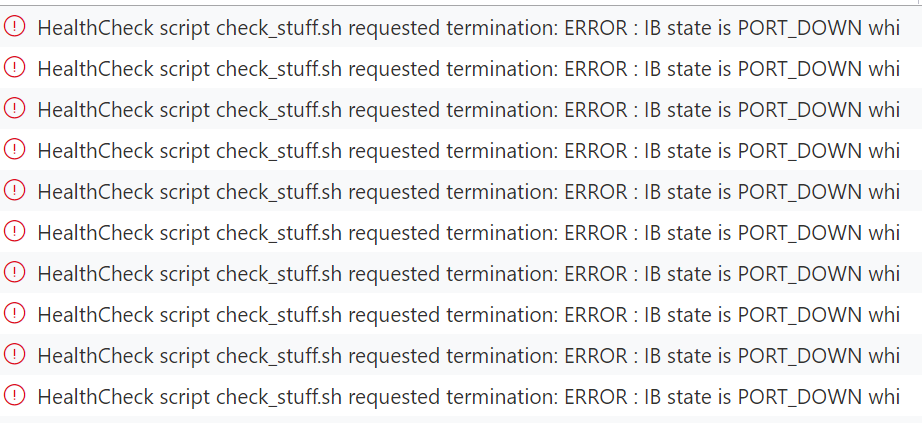
Automatic Health checks
Upon node starting a health check script is run which will validate the Infiniband device presence and status and for GPU nodes if the nvidia-smi command can be run. This health script can be customized and is present in the playbooks/roles/cyclecloud_pbs/cluster-init/files/check_stuff.sh file.
If a node reports a bad health, then Cycle will remove it from the set of allocated machines and a new one will be provisioned. An alert message will be logged in the message pane like below.