Azure Managed Grafana
Grafana, built by Grafana Labs, is an open-source platform for data visualization, monitoring, and analysis. It allows you to query, visualize, alert on, and understand your metrics no matter where they are stored. Azure Managed Grafana is a fully managed service built on top of the Grafana software that provides built-in support for Azure Monitor and Azure Data Explorer data sources. Azure Managed Grafana further provides user authentication and access control using Microsoft Entra identities and provides high availability, SLA guarantees and automatic software updates.
Listed below are some examples of Grafana dashboards that visualize alerts from Azure. These dashboards can be imported into your own Grafana instance.
You can also find information below on utilizing the Grafana tab found in the Services section of this site.
The Azure Monitor Team has built a library of dashboards that can be imported into your own instance of Grafana. Below are some examples from that library that help visualize alerting from Azure Monitor.
Azure Infrastructure Monitoring Dashboards
Displays traffic-light indicators showing the health of your Azure infrastructure resources based on key performance indicators and thresholds defined for each infrastructure resource type. This is a collection of dashboards linked together via dashboard links for easy navigation between views.

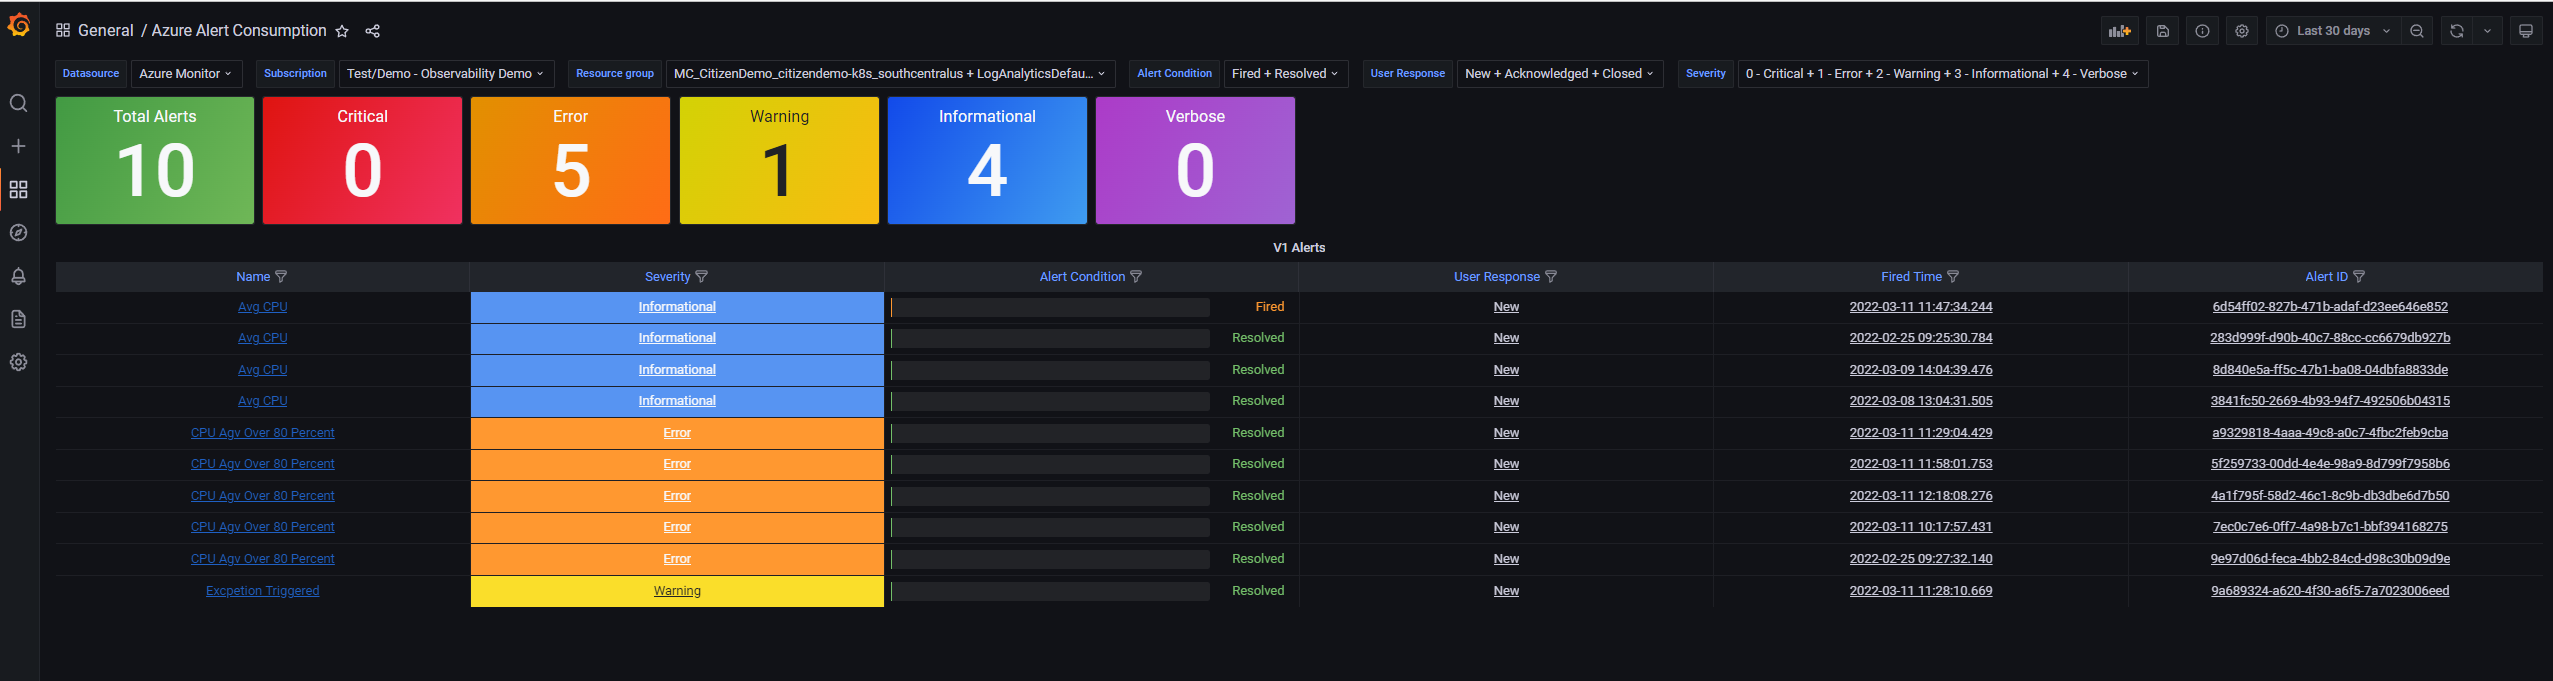
A summary of all alerts for the subscription and other filters selected.
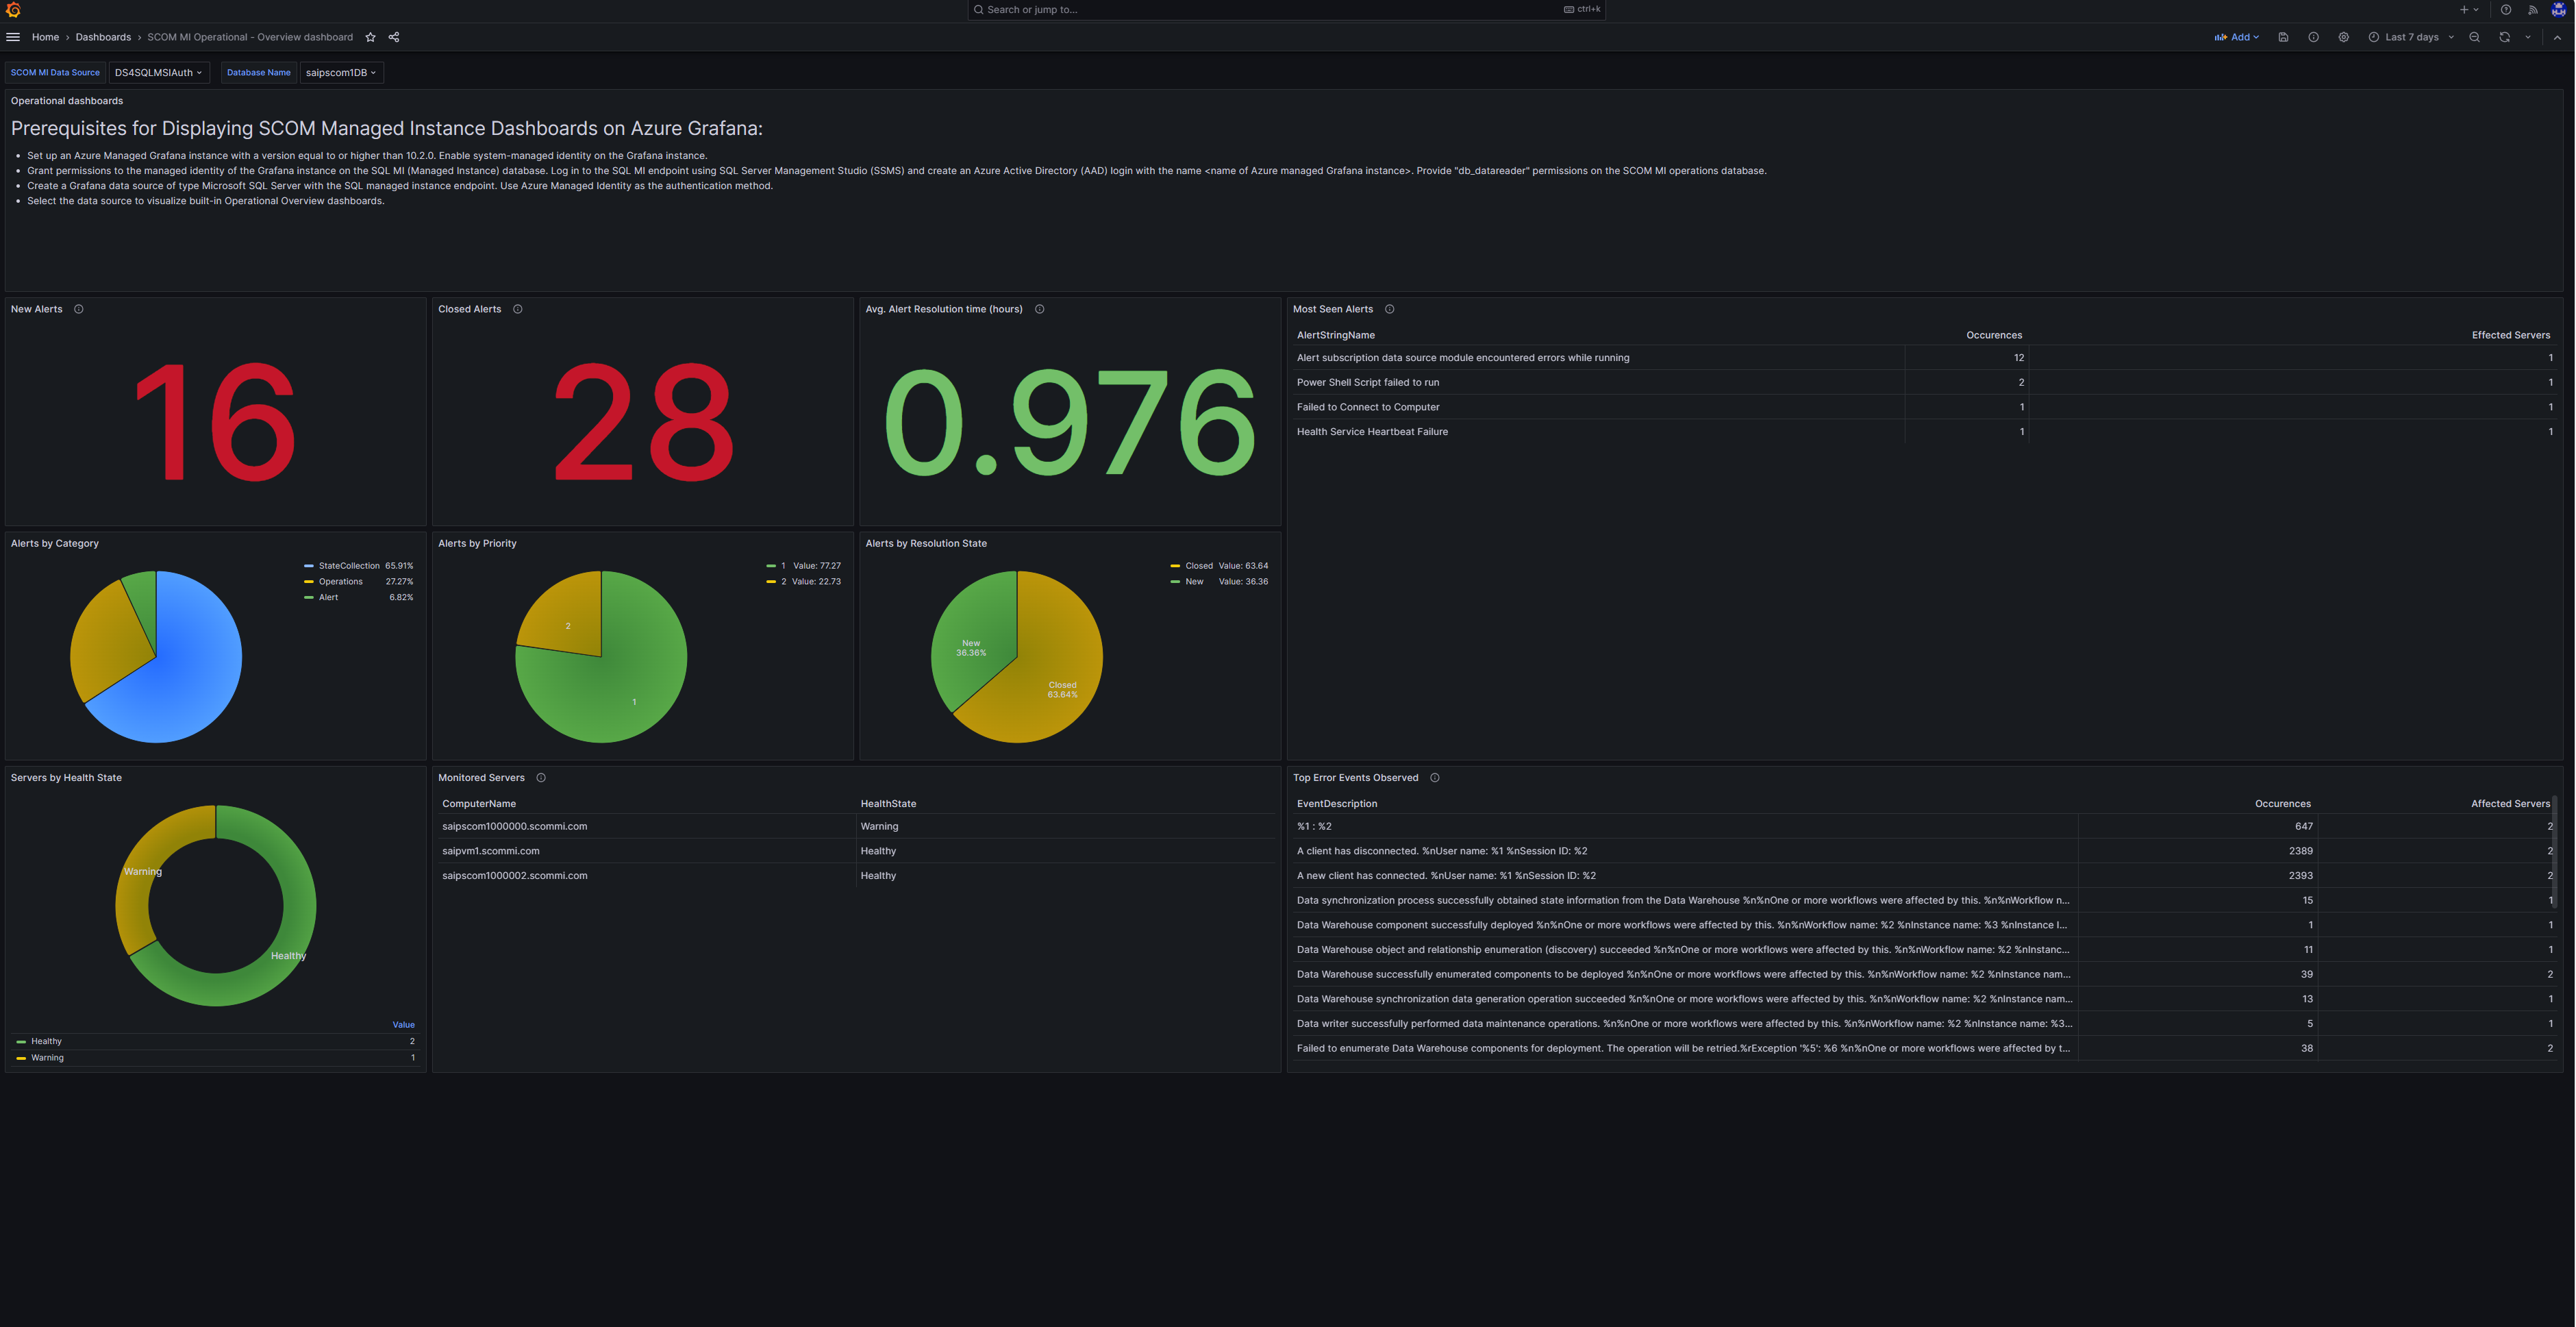
SCOM Managed Instance Operational Dashboard
Operational dashboard for summary of alerts, heath, and performance of monitored resources connected to SCOM managed instance.
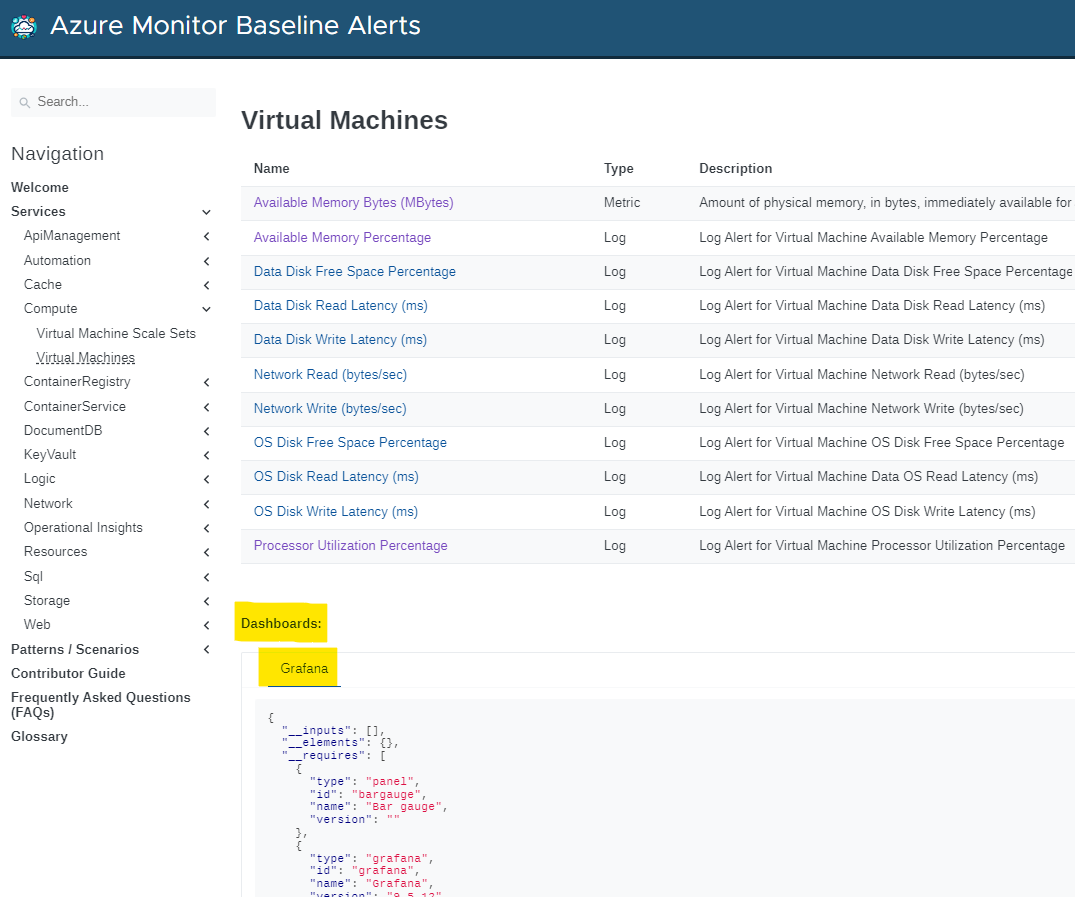
In the Services section of this site where guidance is provided for each individual Azure service, you can find a “Grafana” tab which can be used to import a dashboard that contains a visualization for each alert threshold. As an example, if you go to the services/Compute/virtualMachines page, you will find a “Dashboard” section with a “Grafana” tab. Copy the JSON and use it to import a new dashboard in Grafana. See yellow highlight in screenshot below: