TauGrid visual curriculum
Twenty-three diagrams from evaluation through contribution
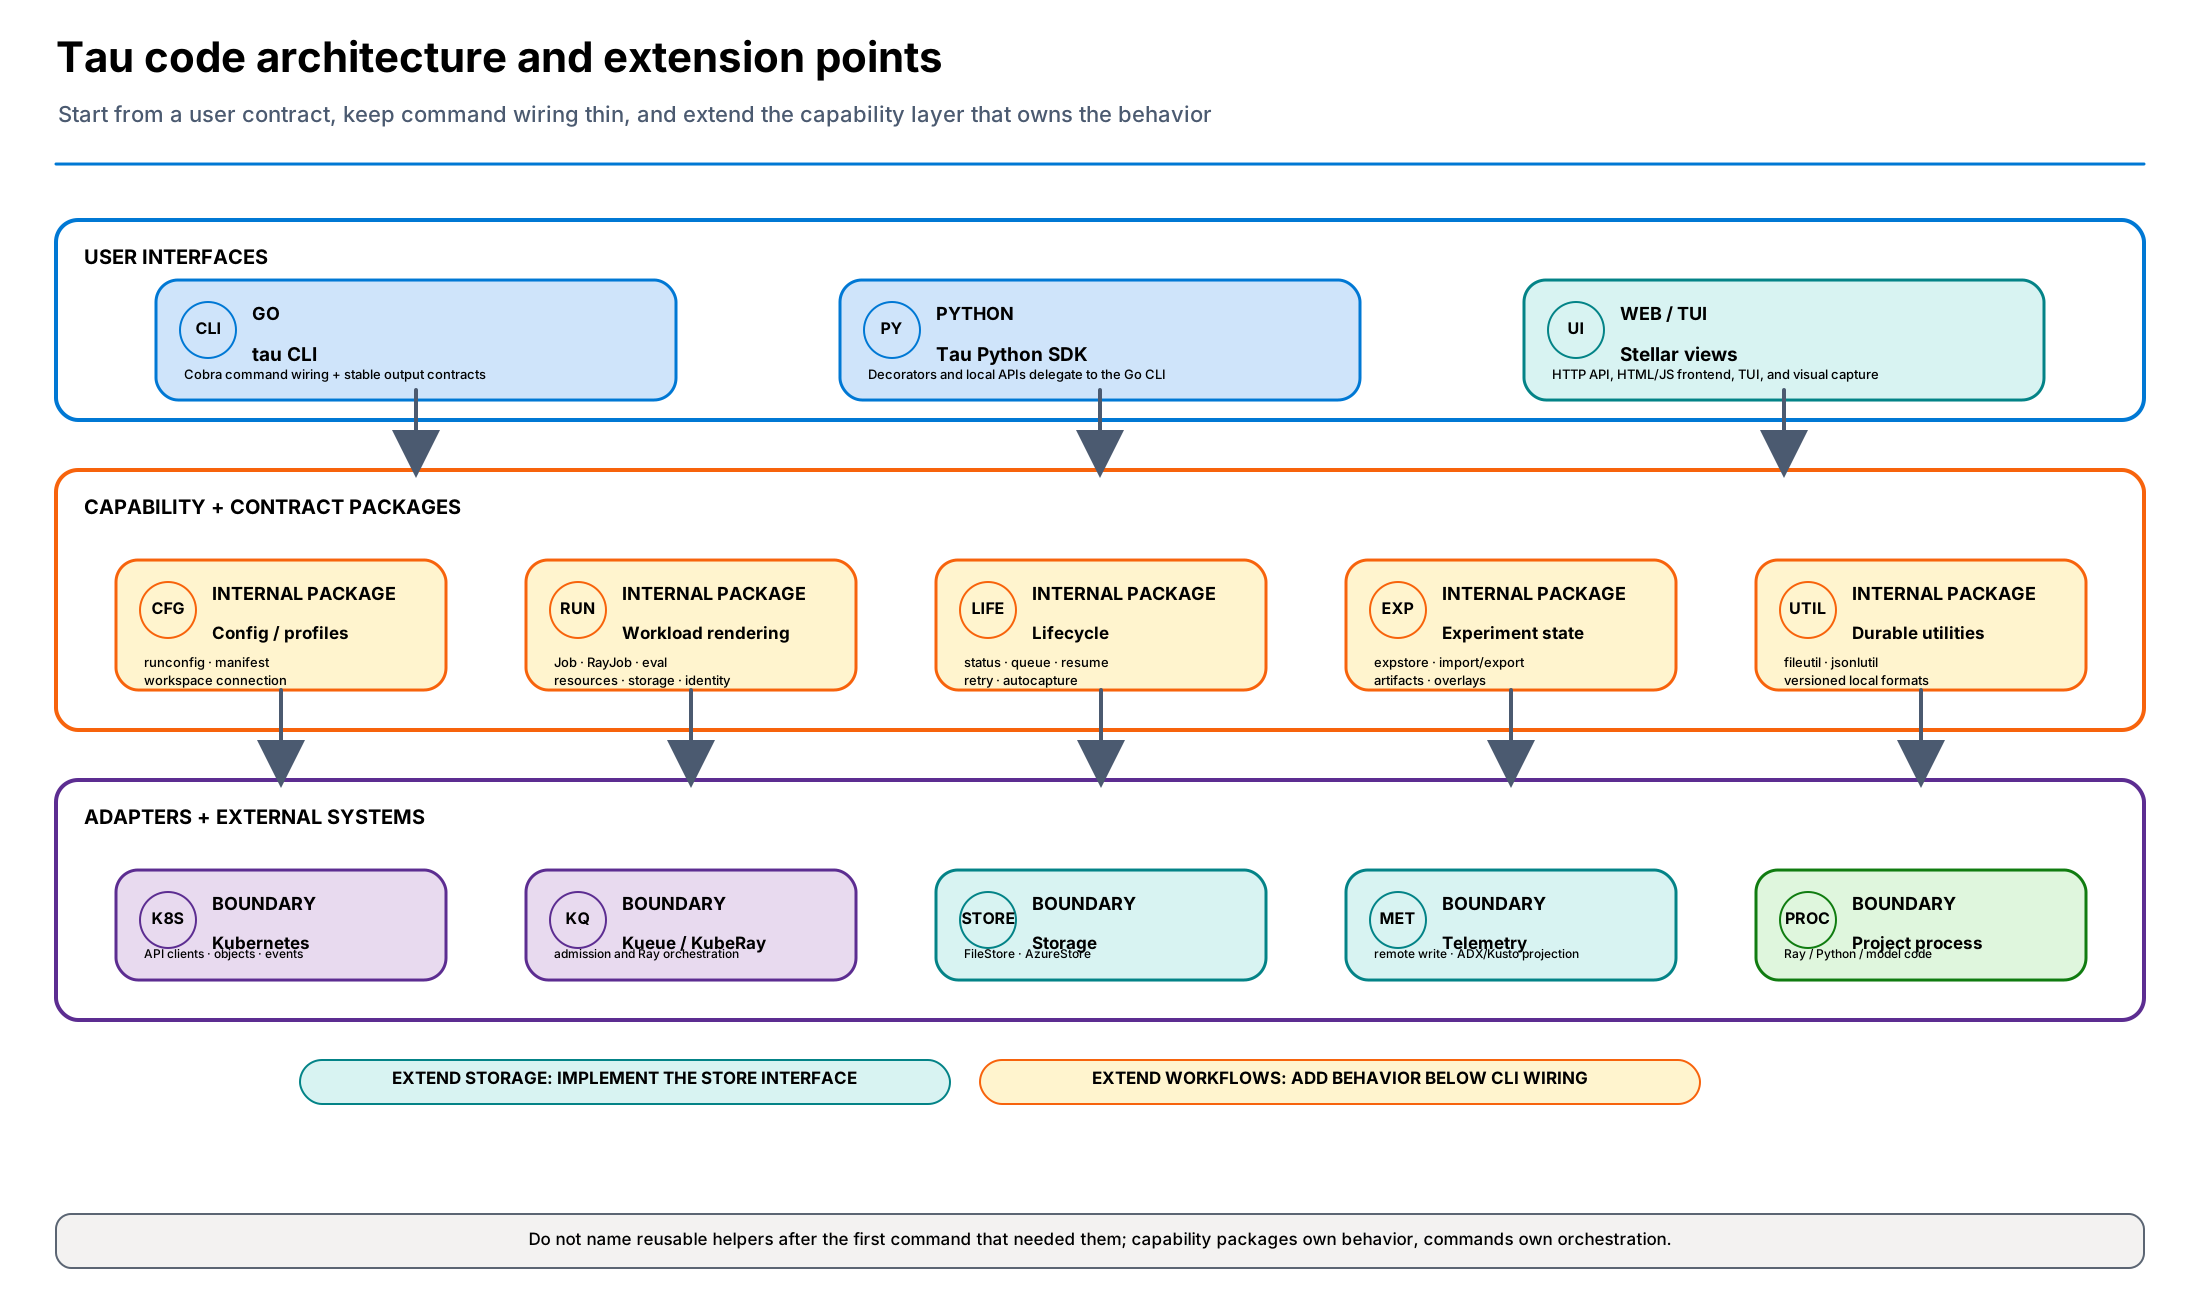
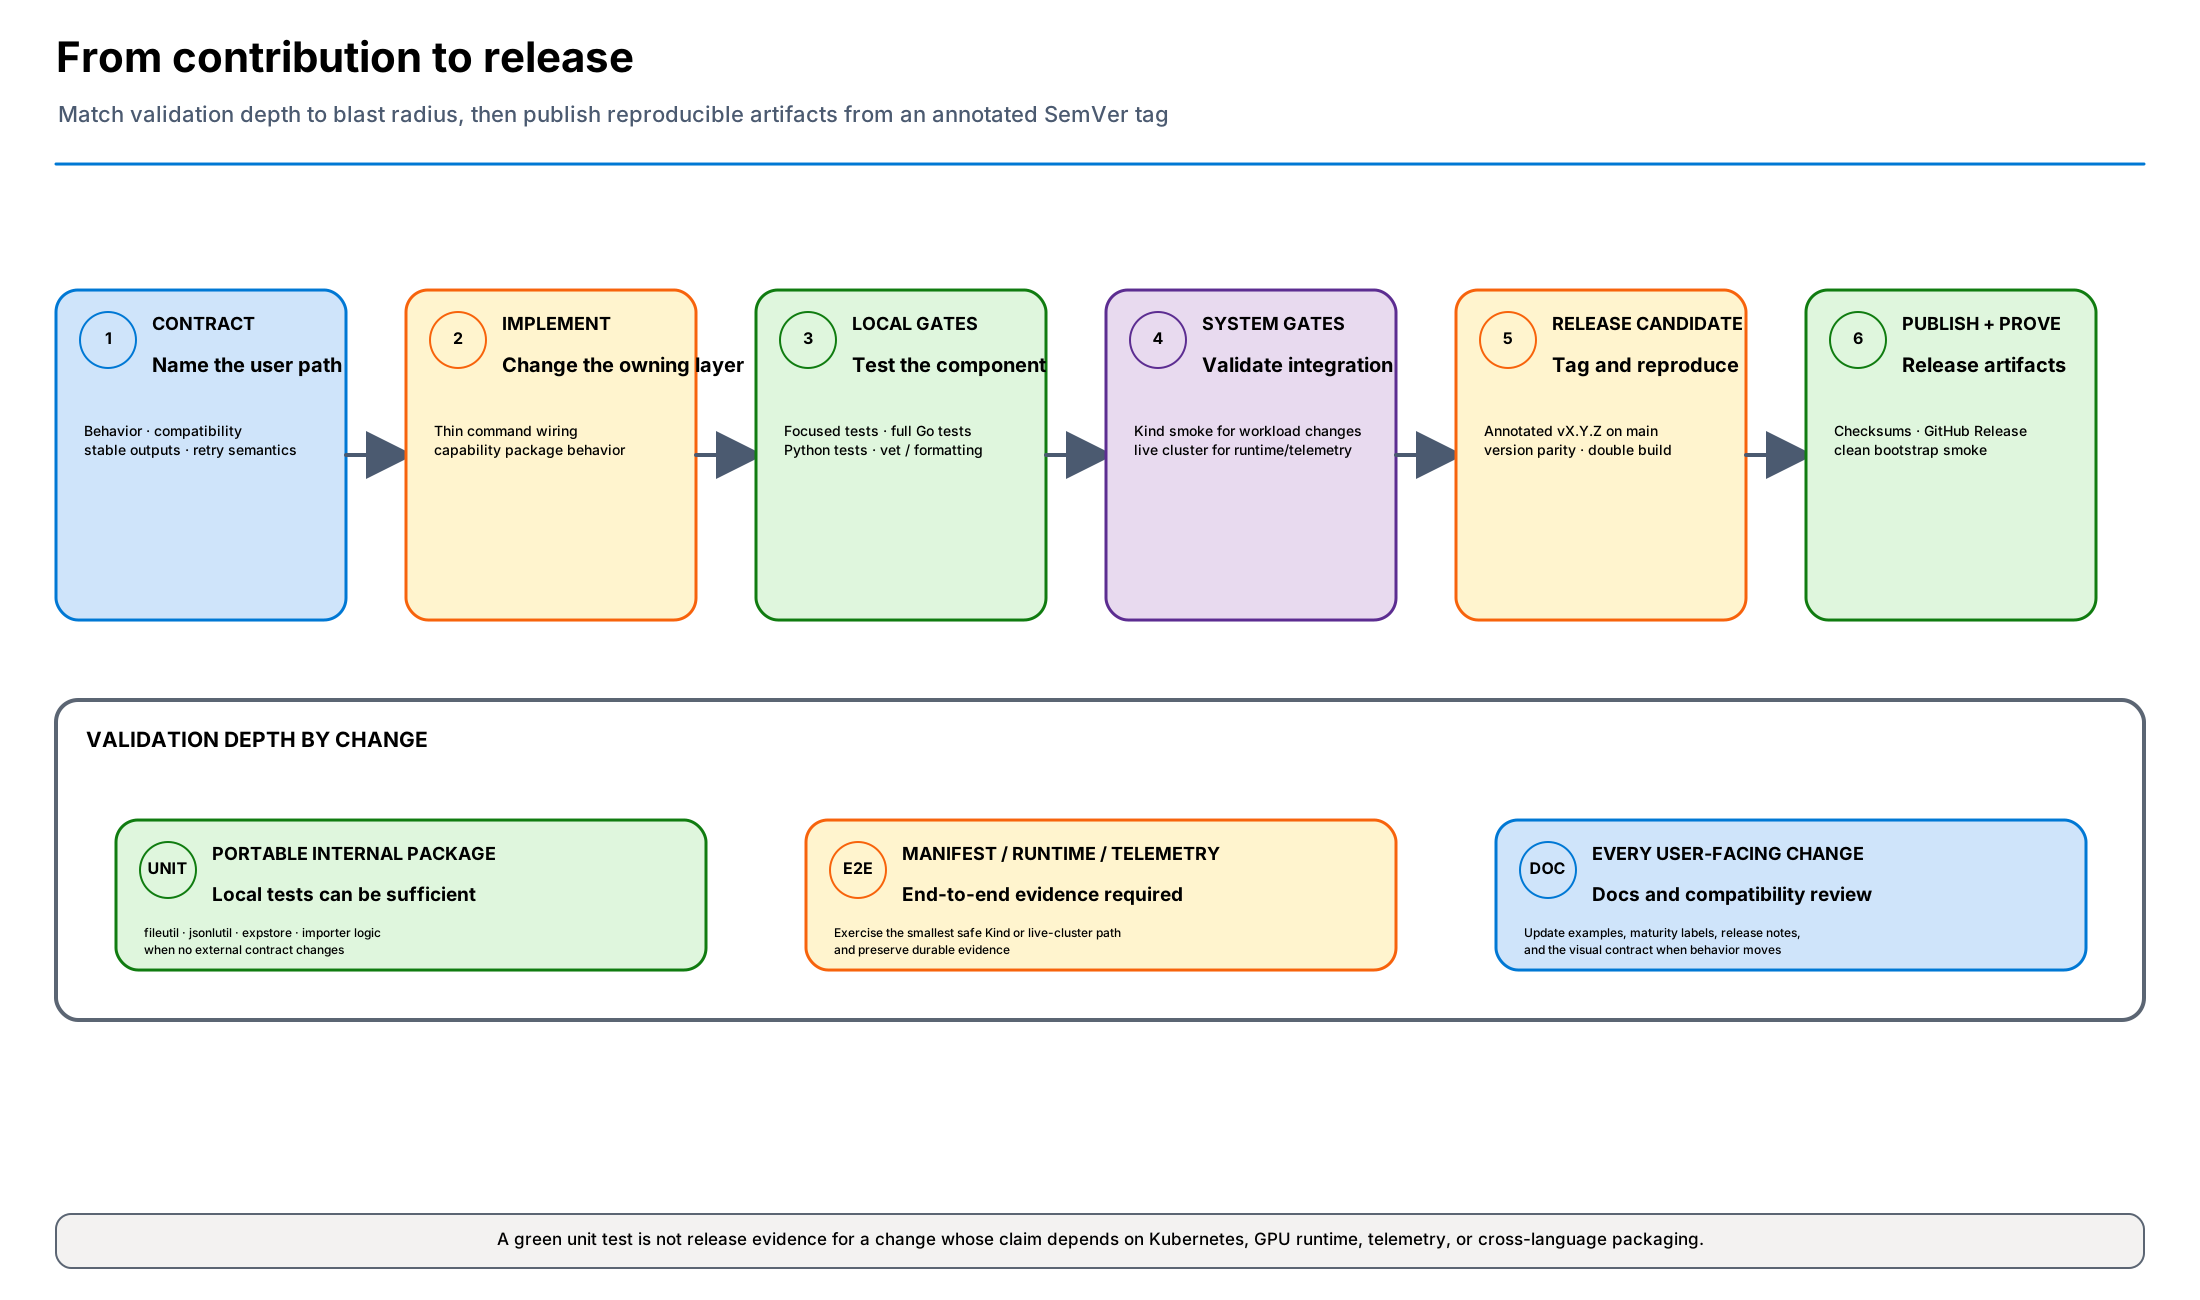
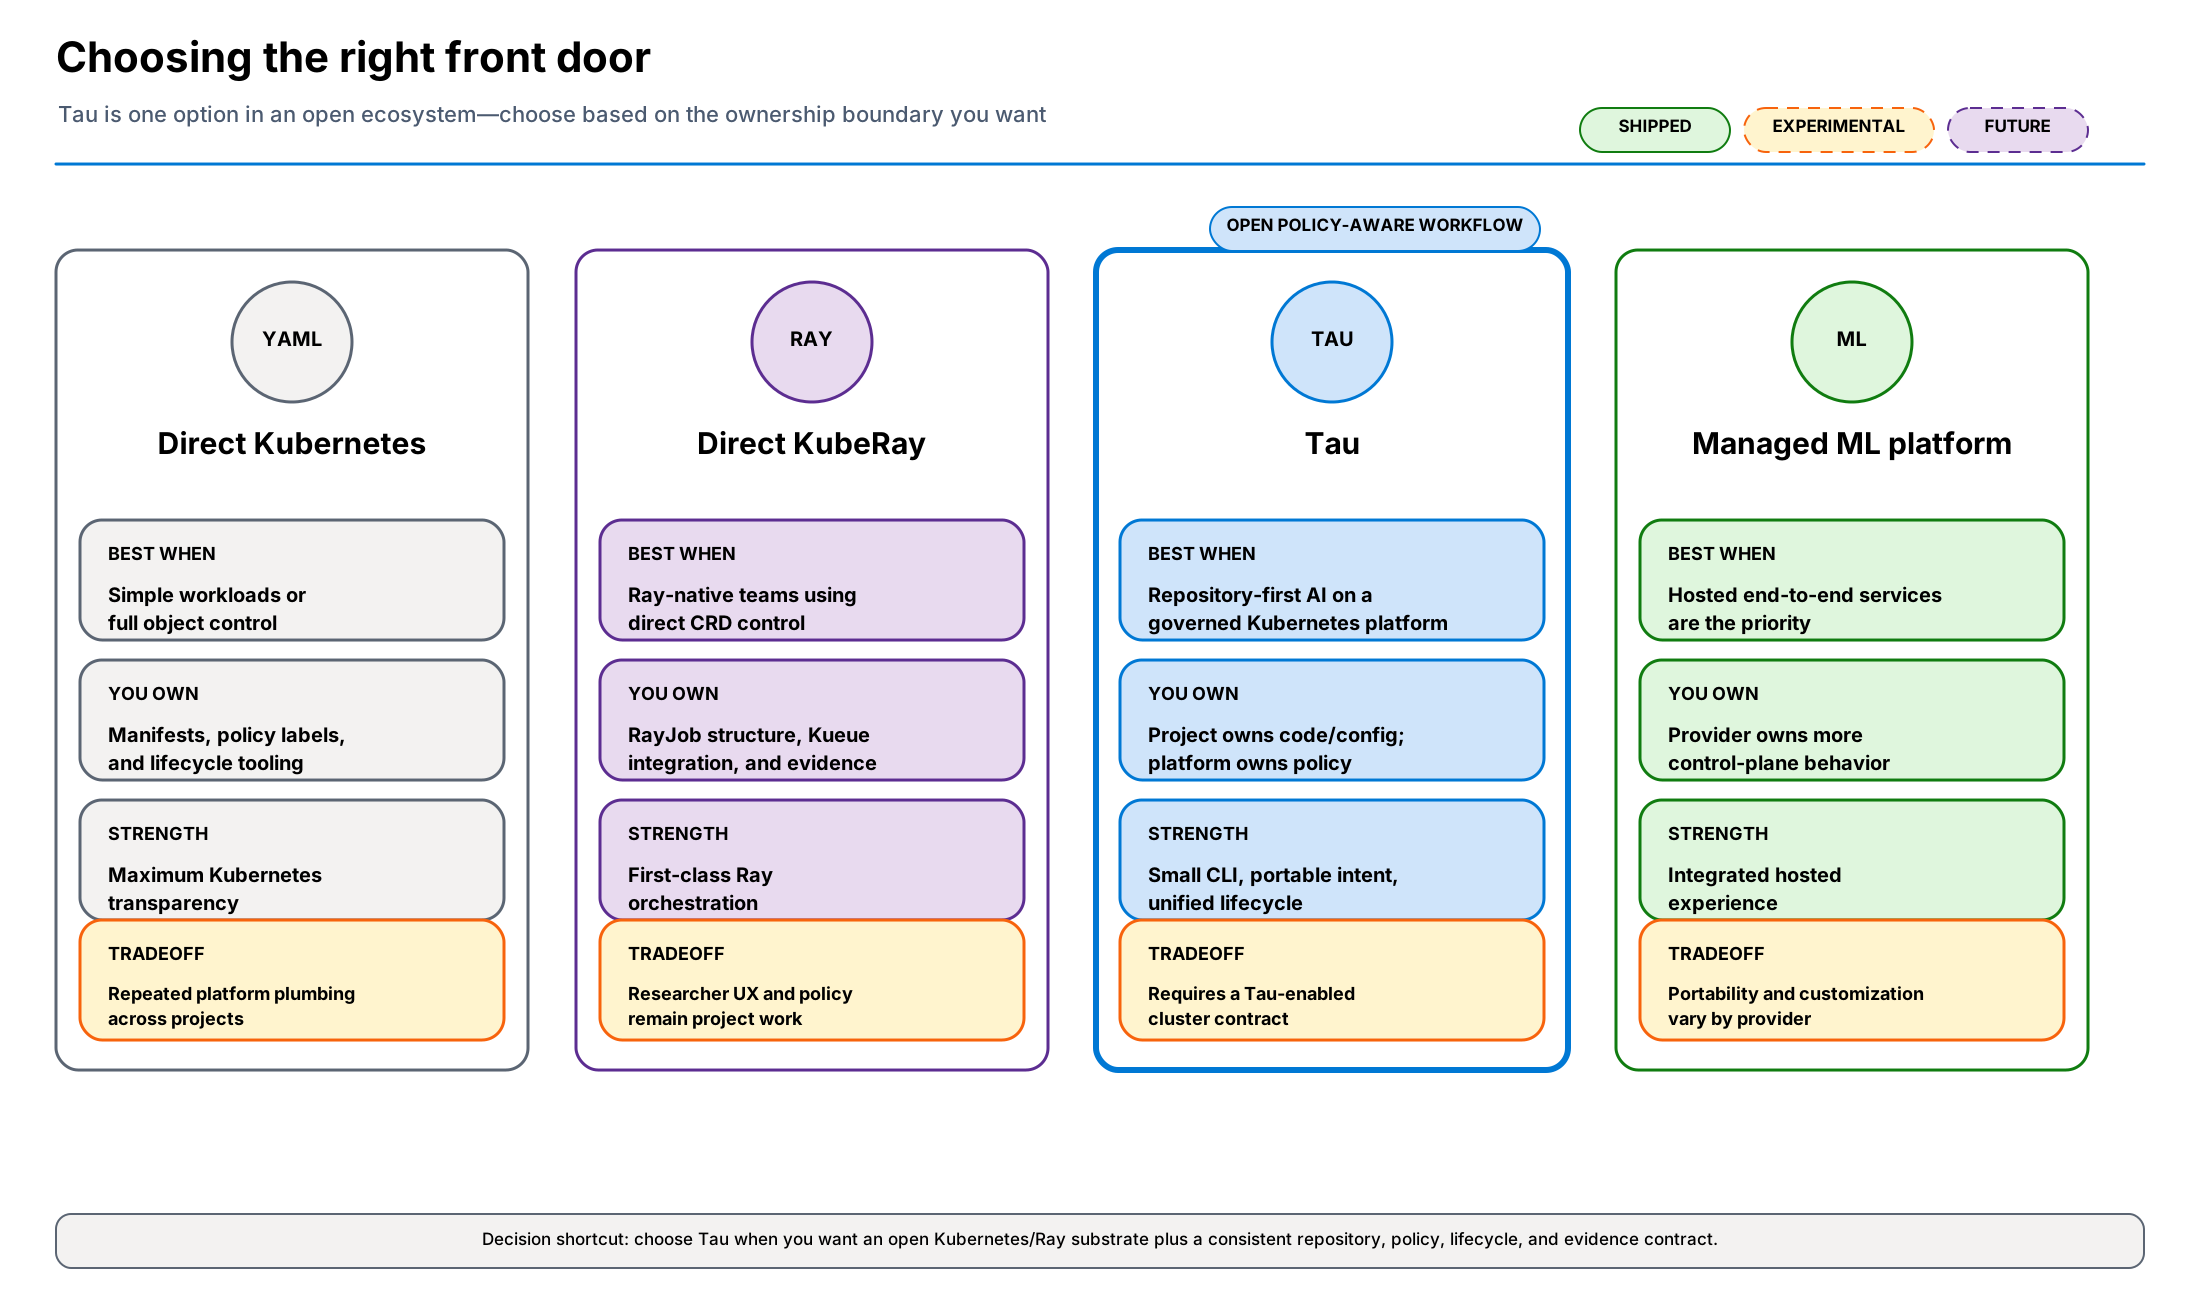
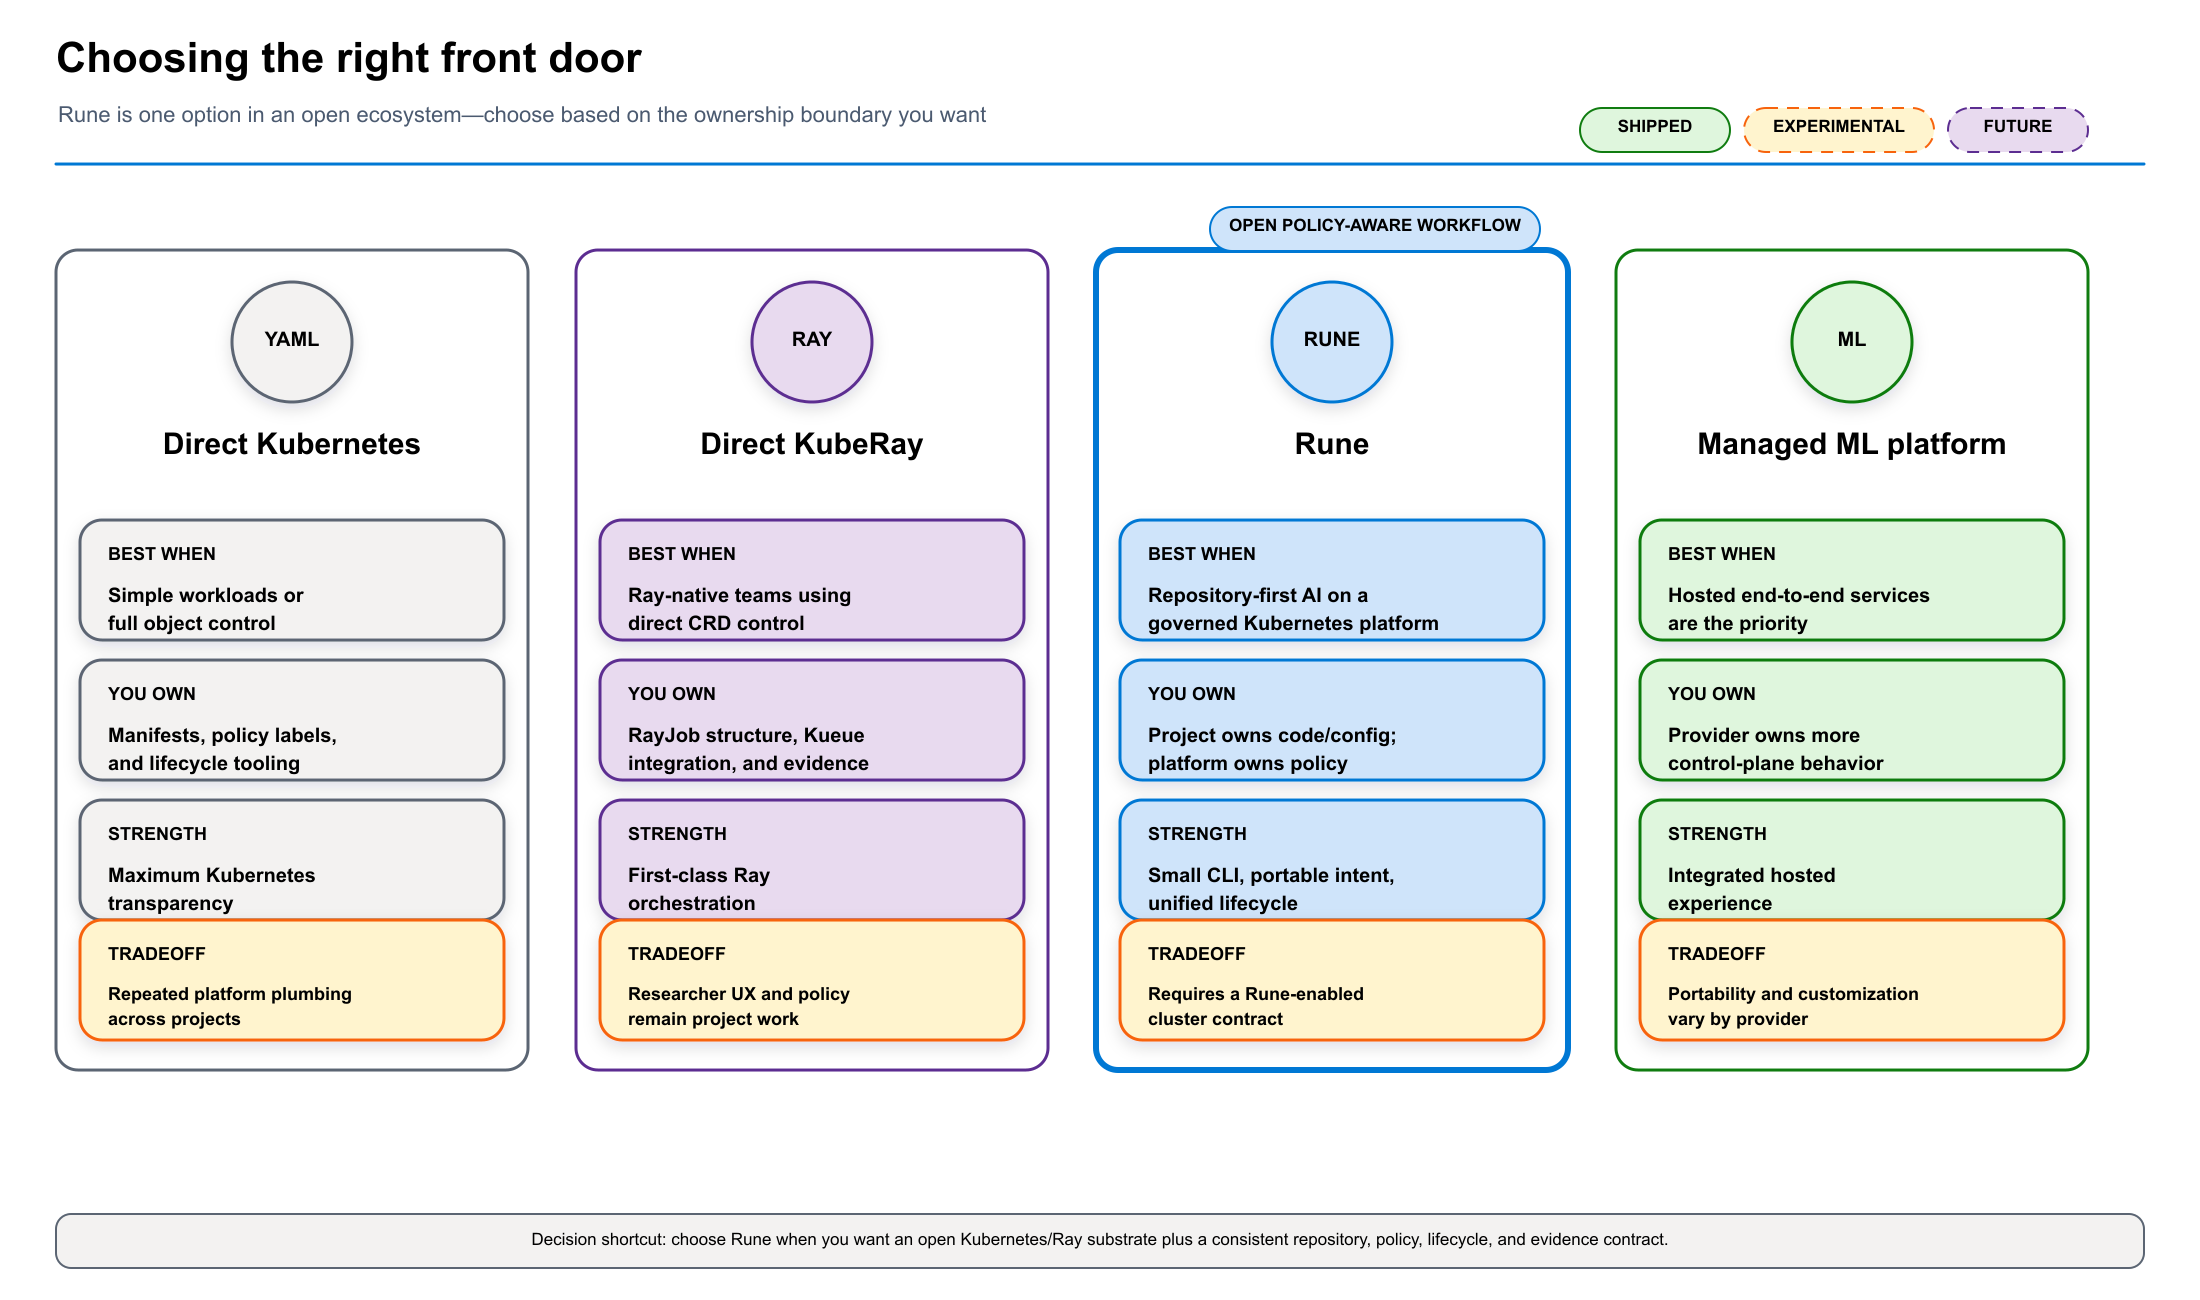
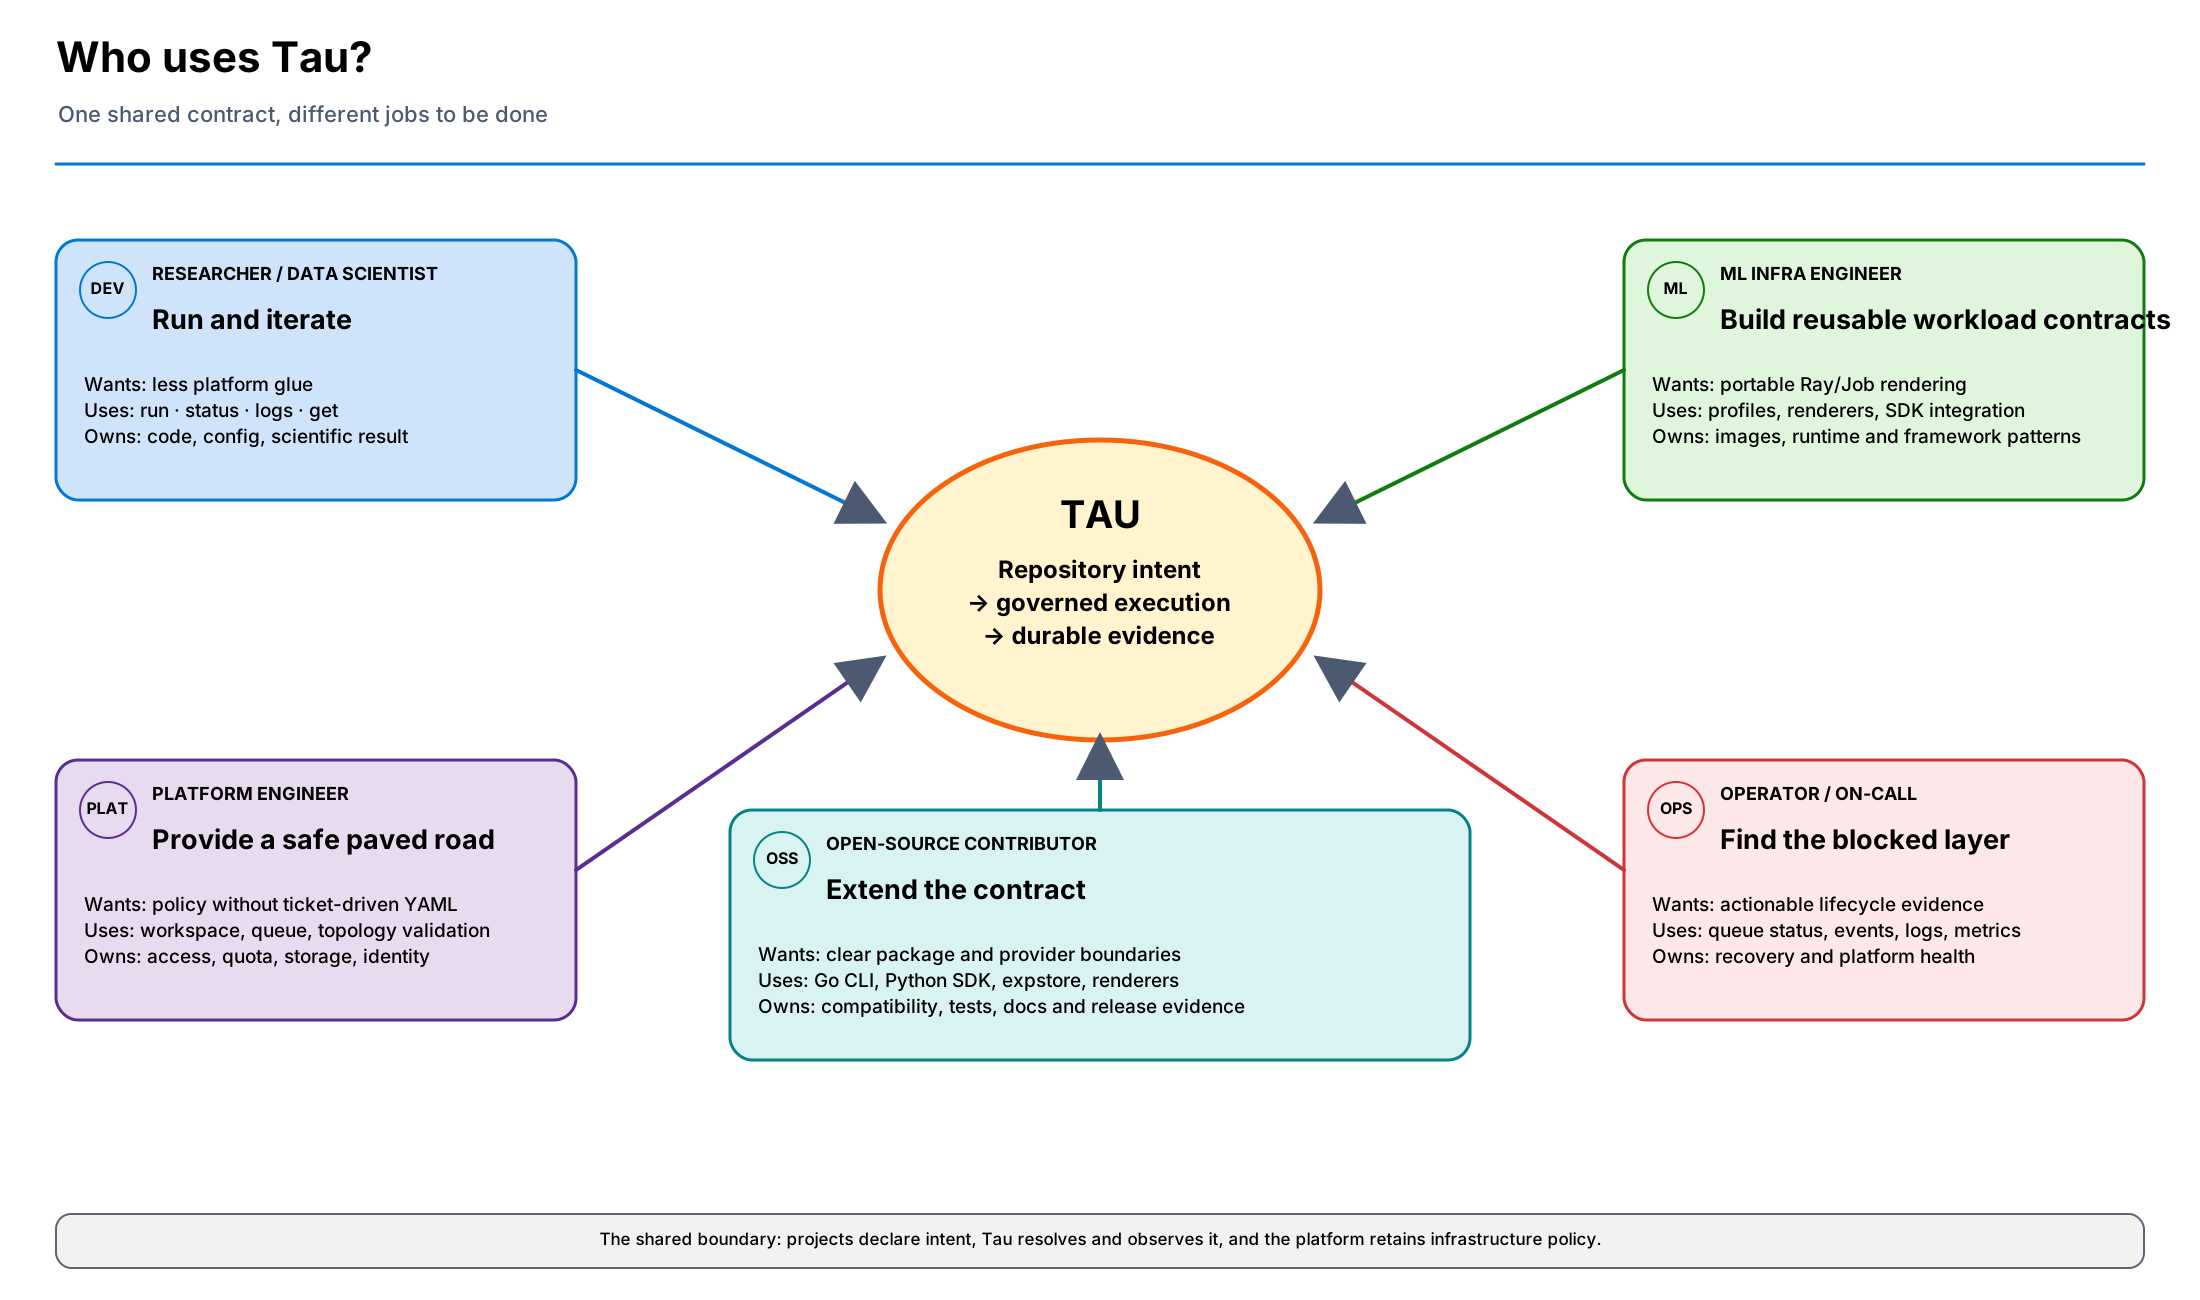
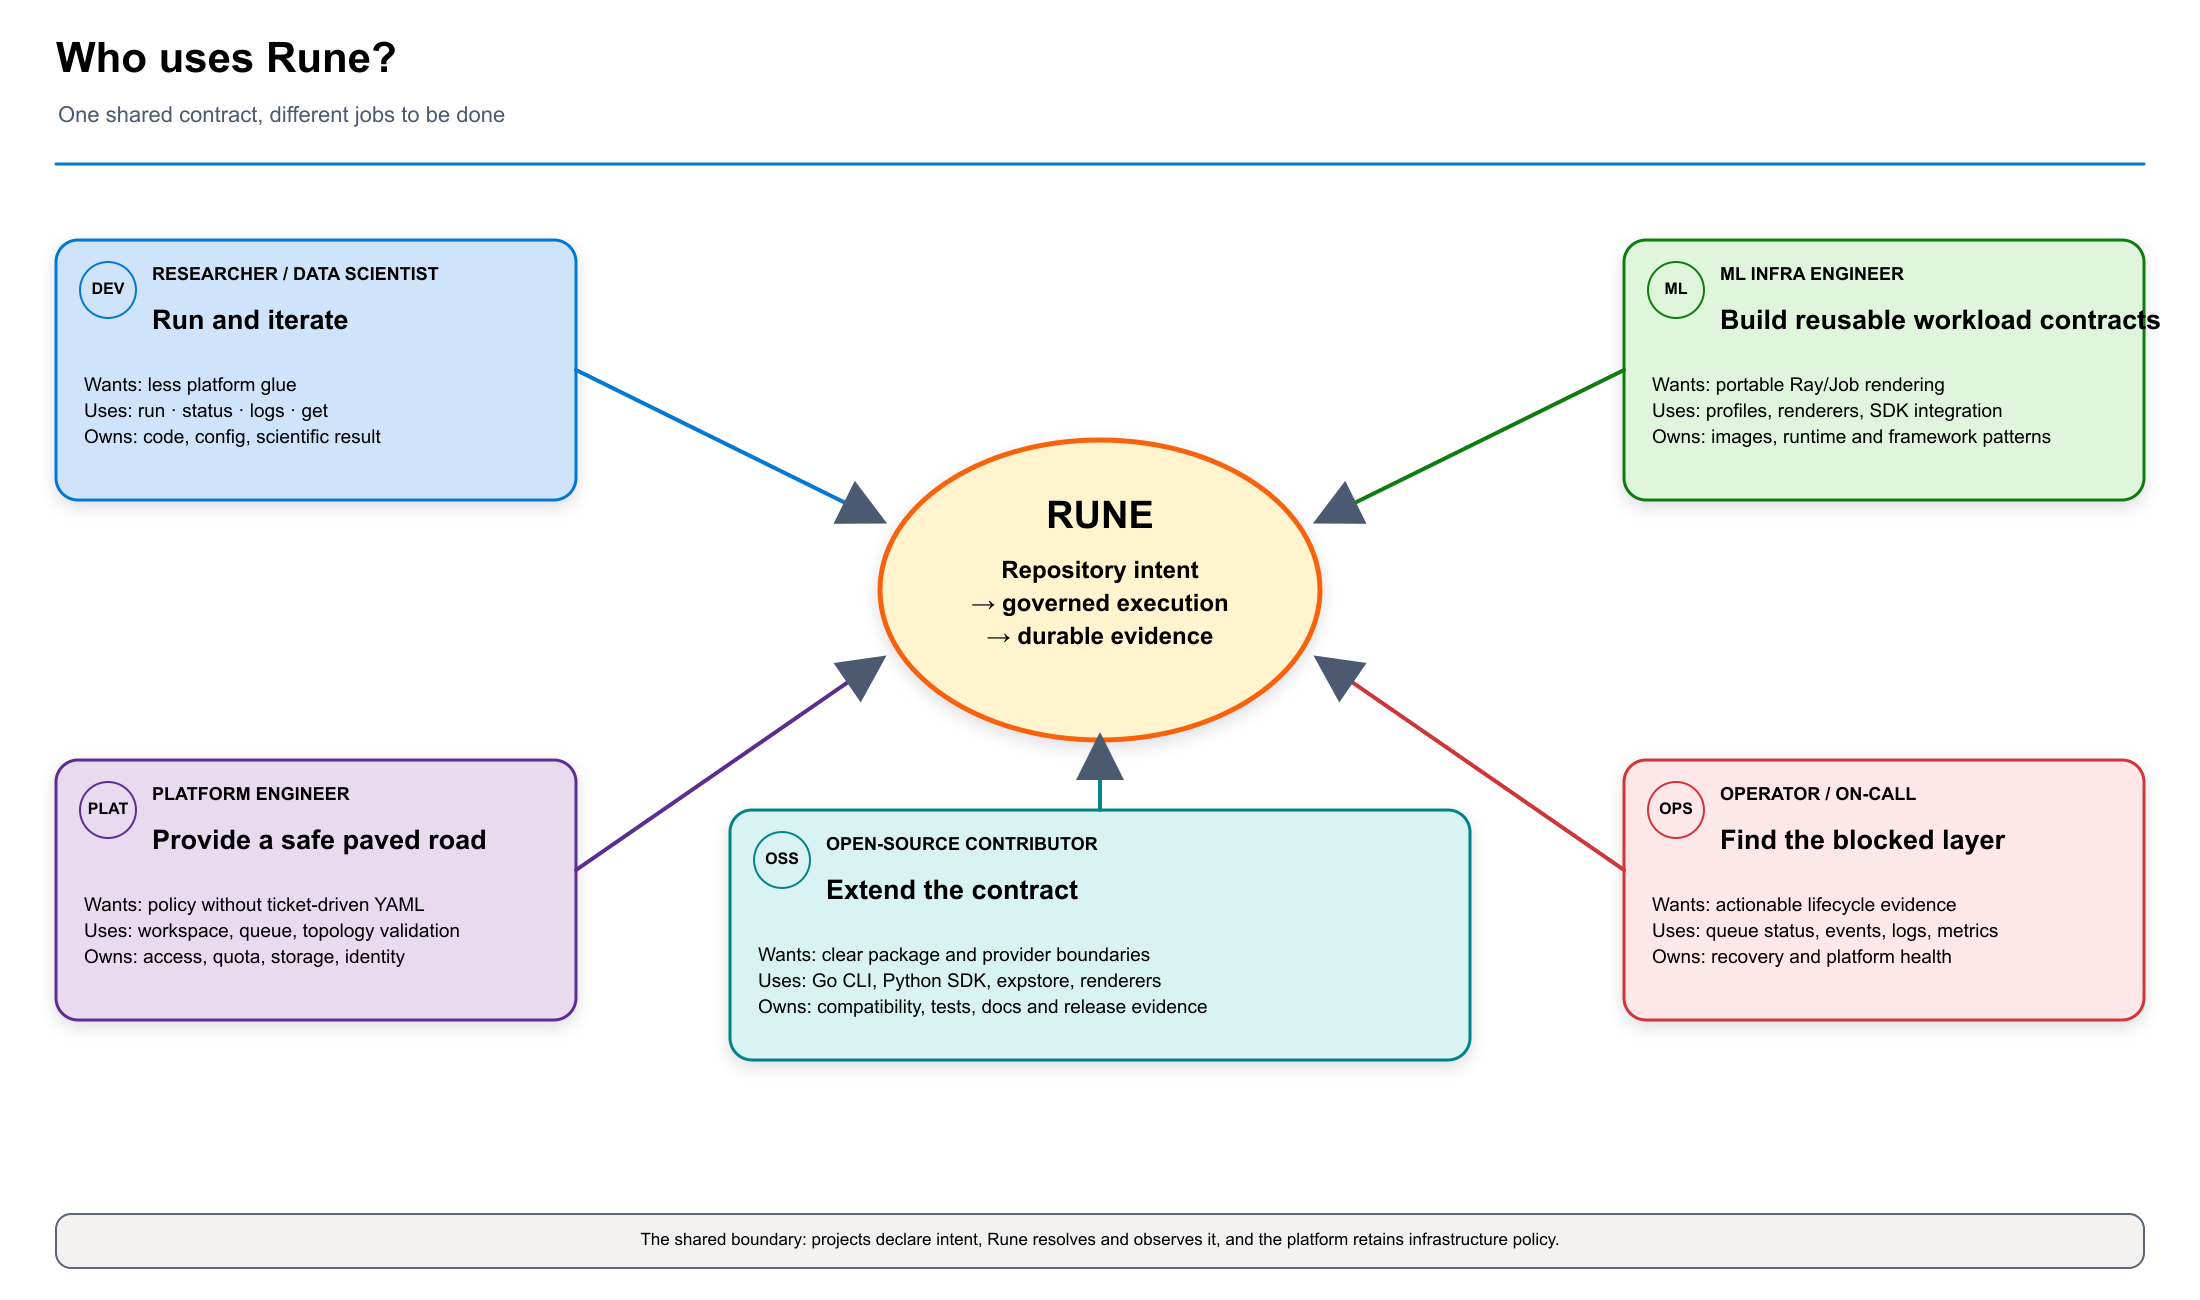
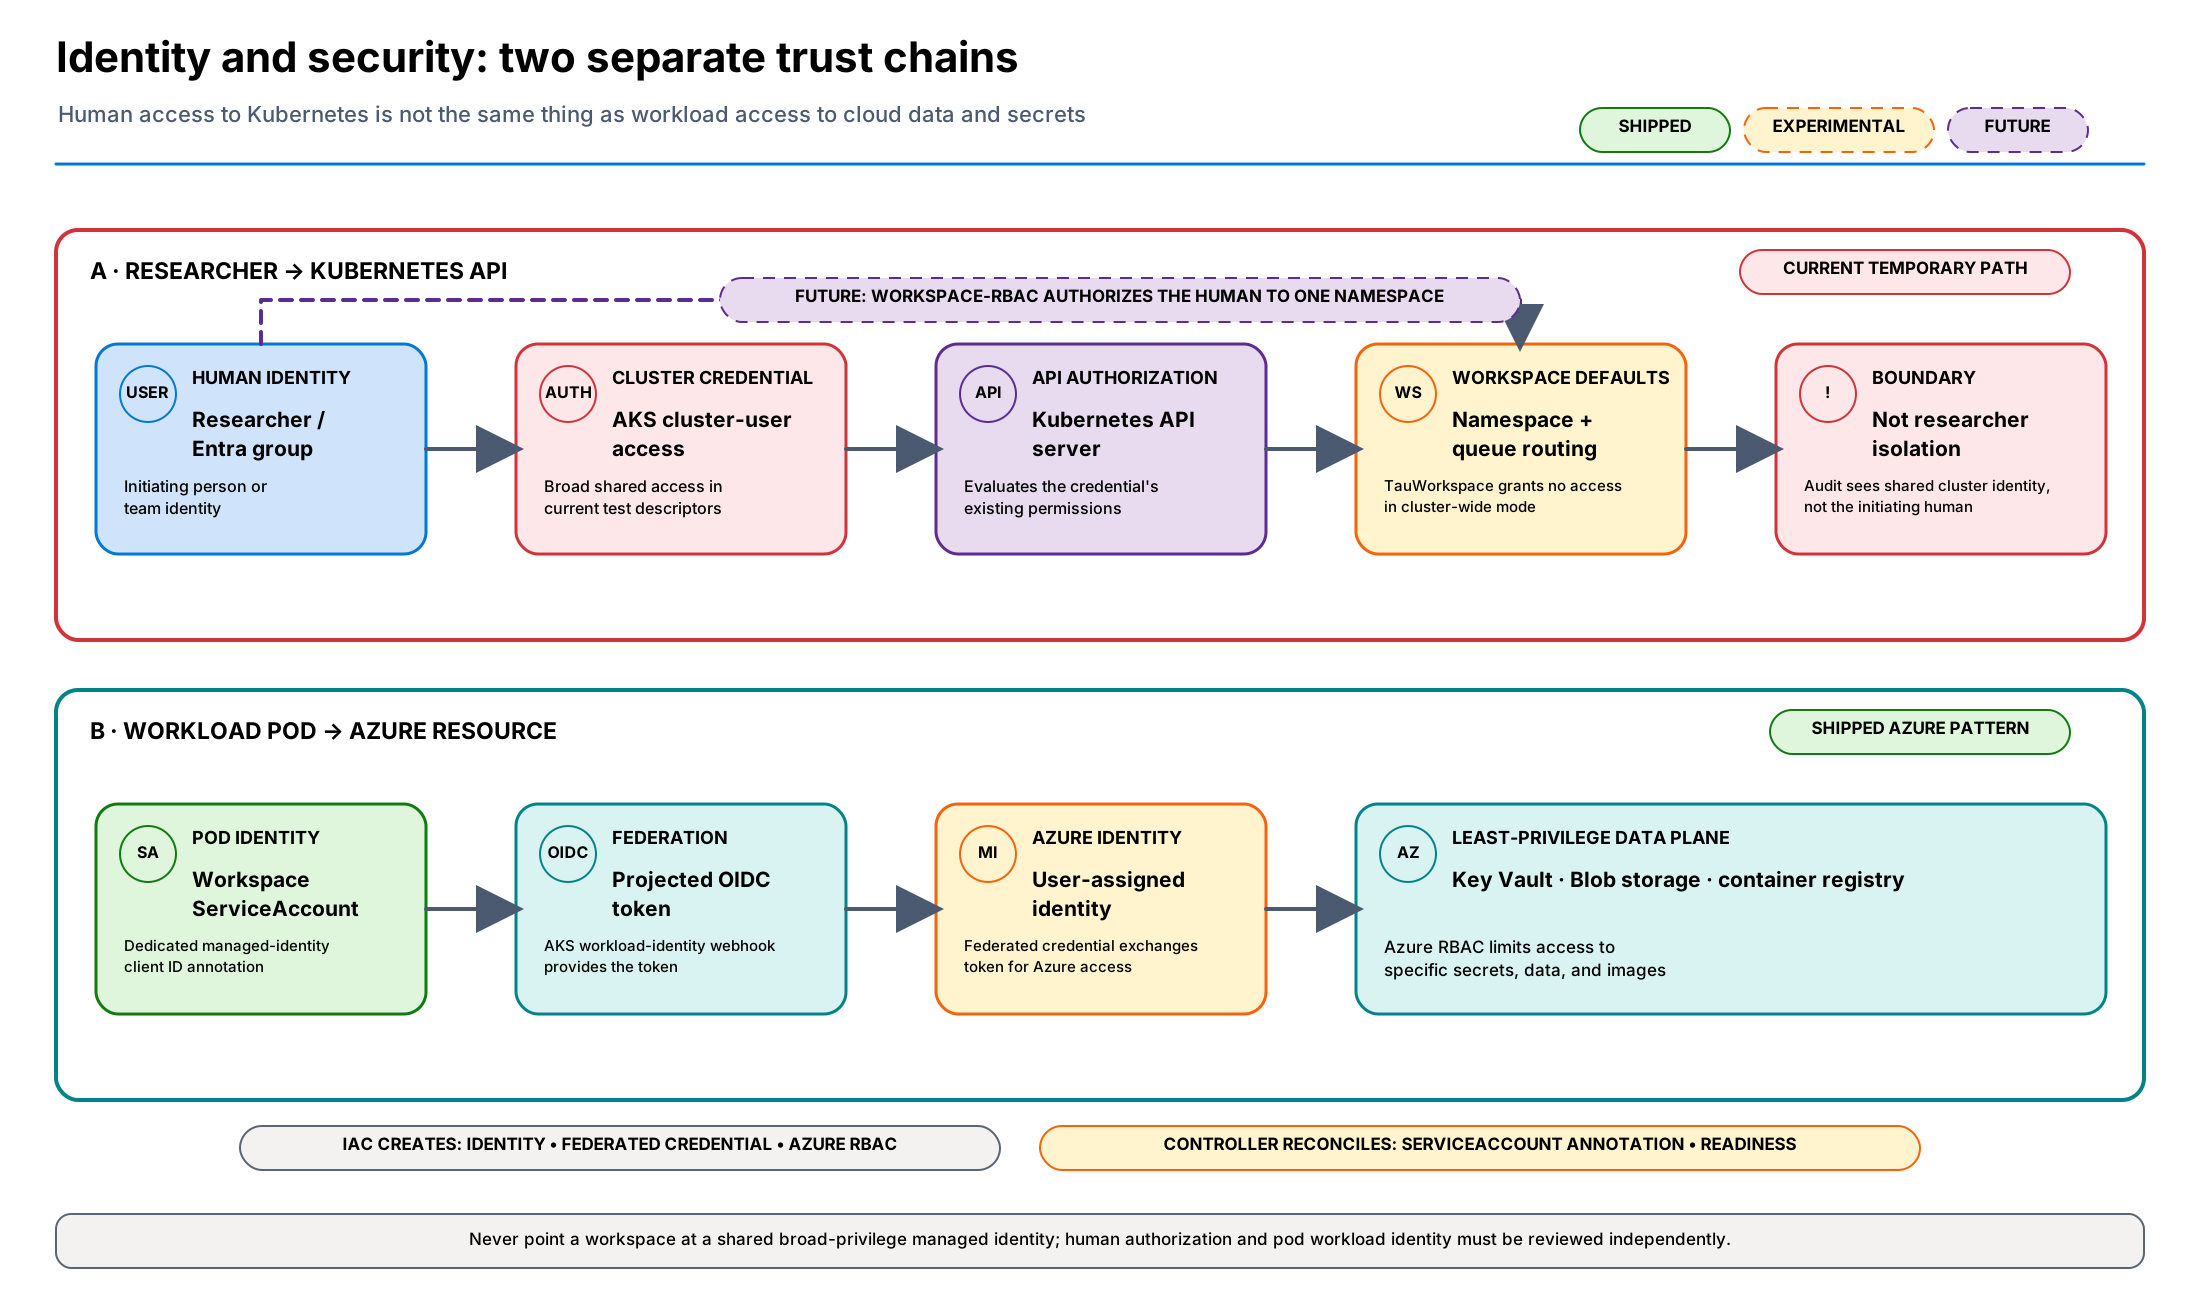
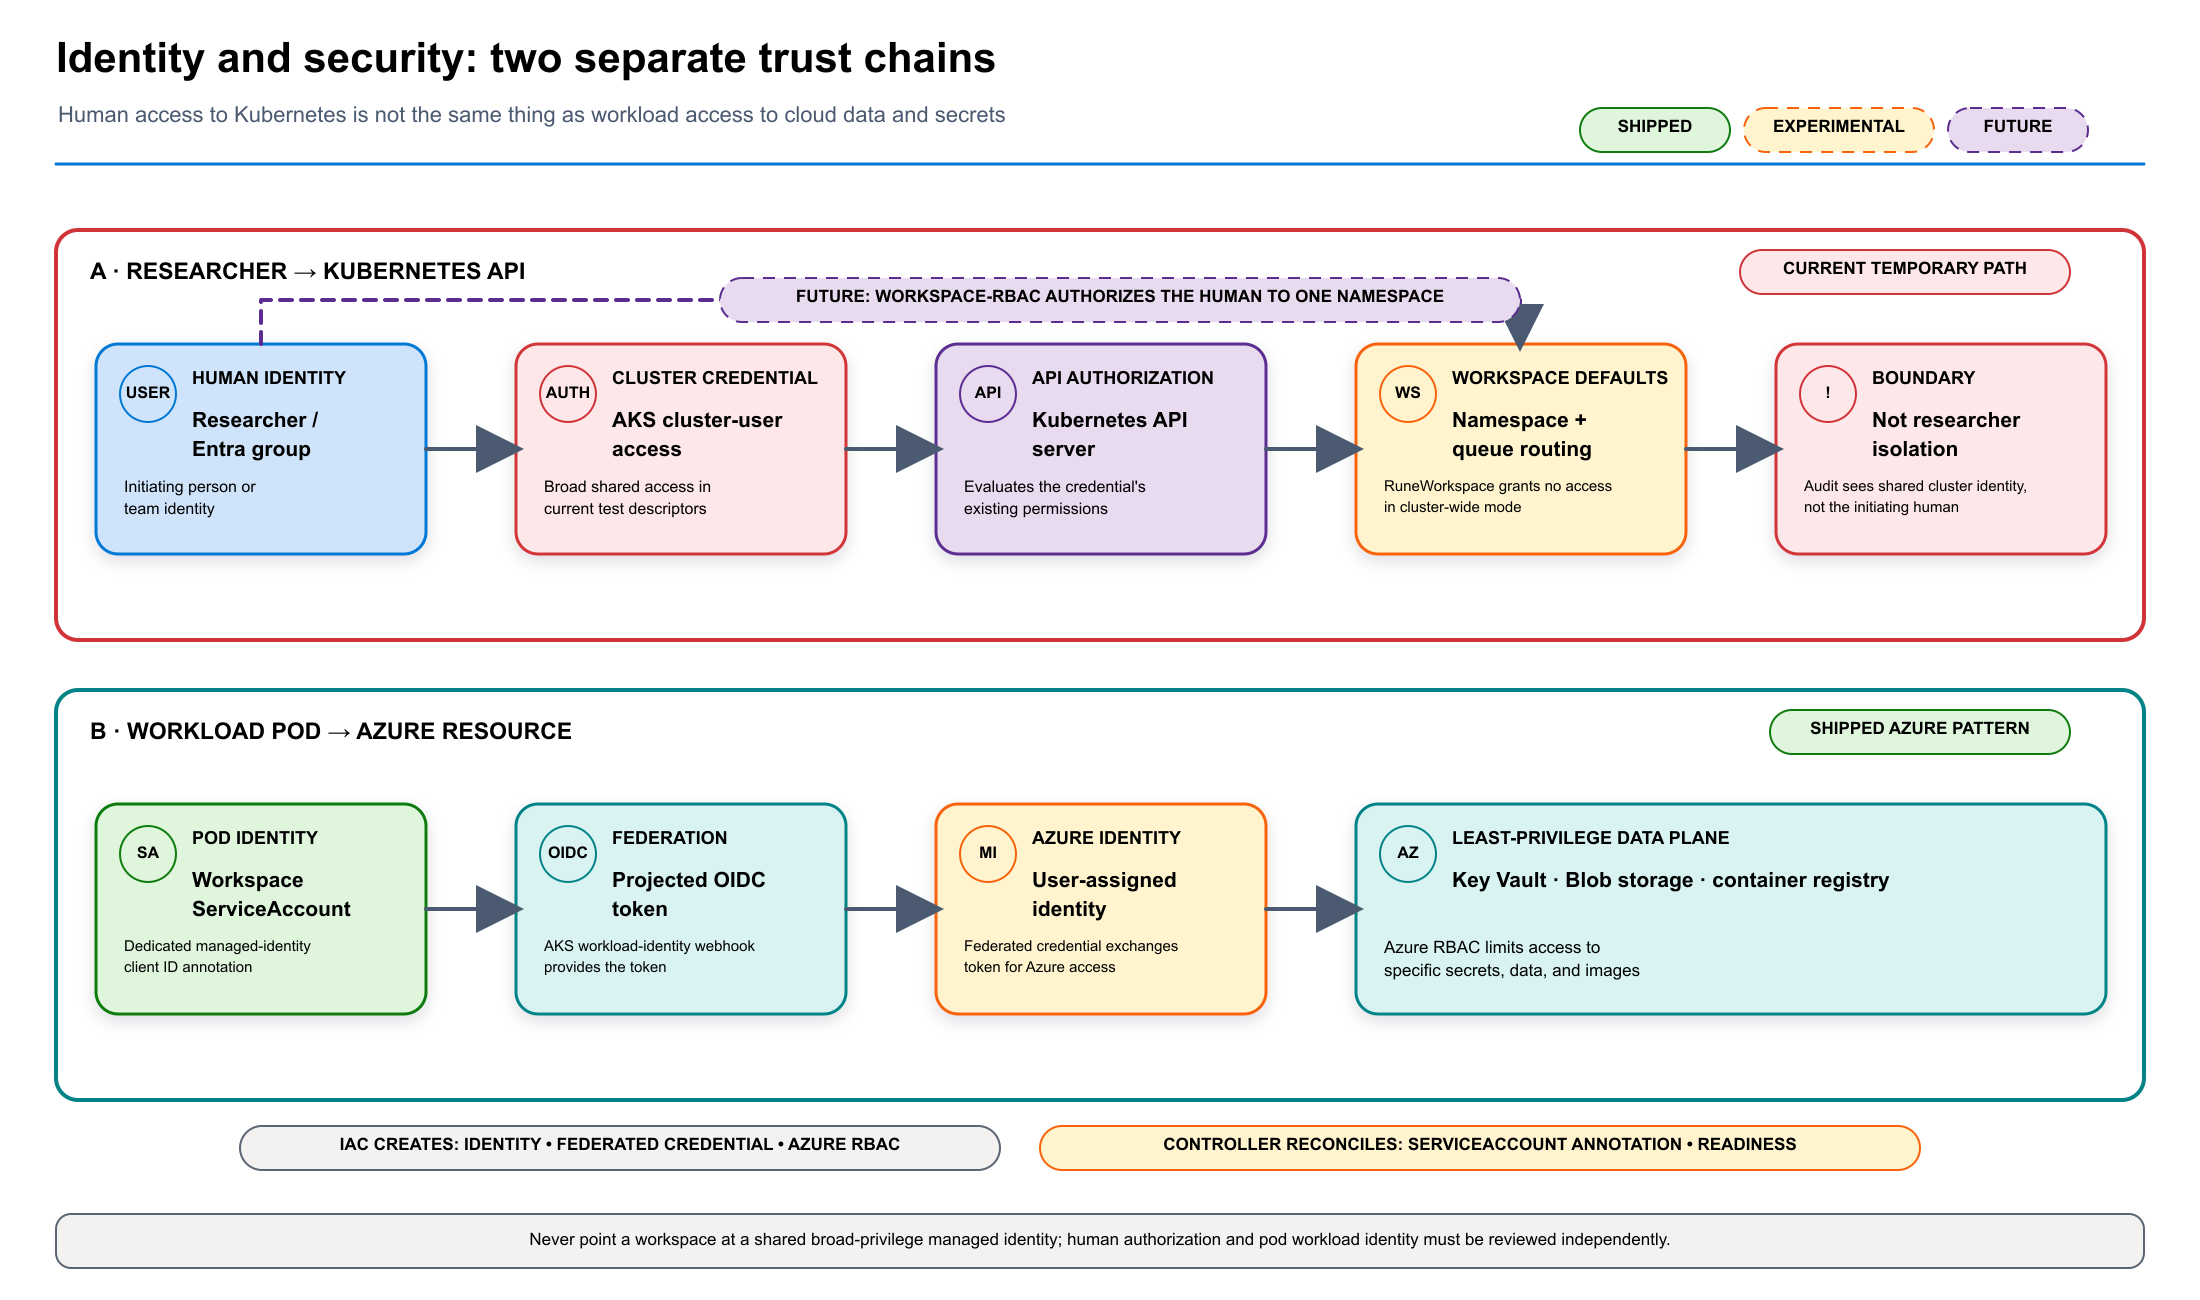
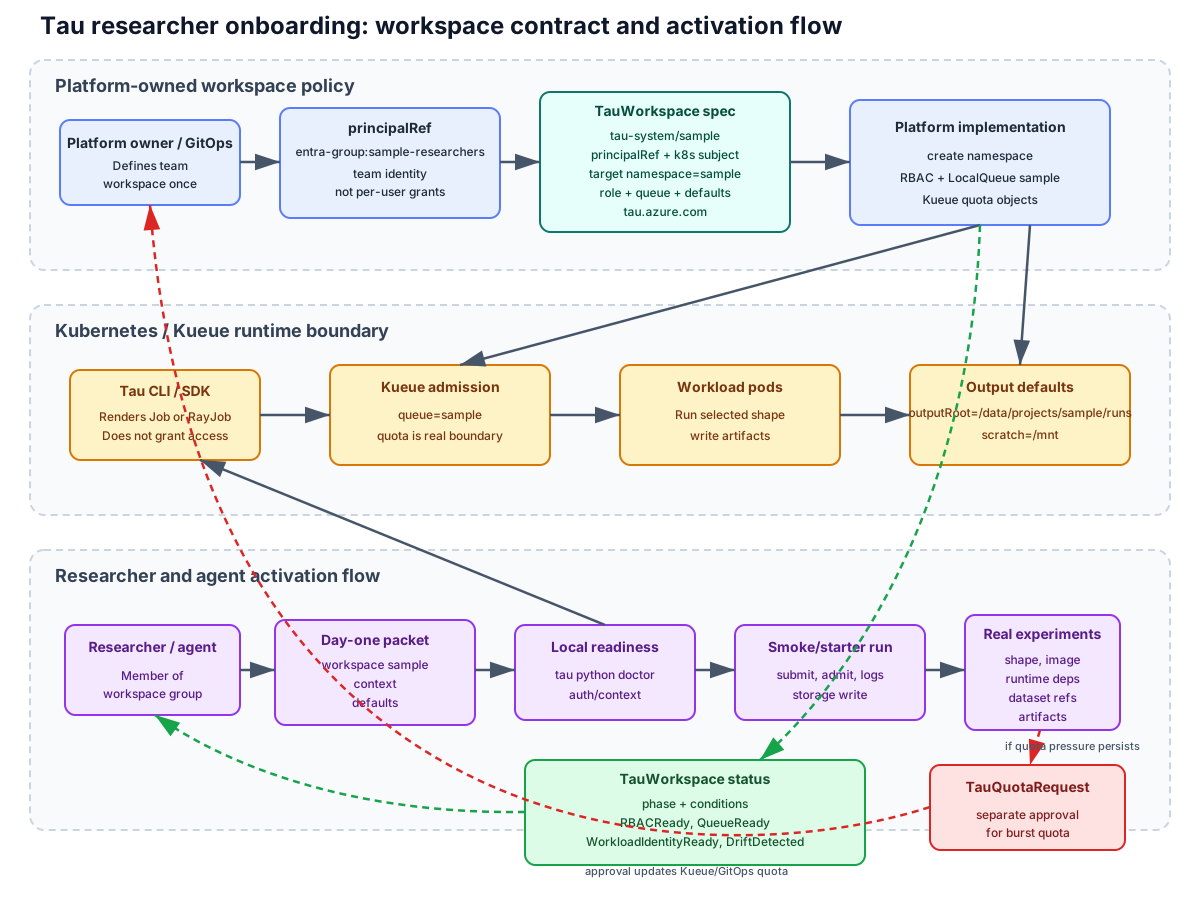
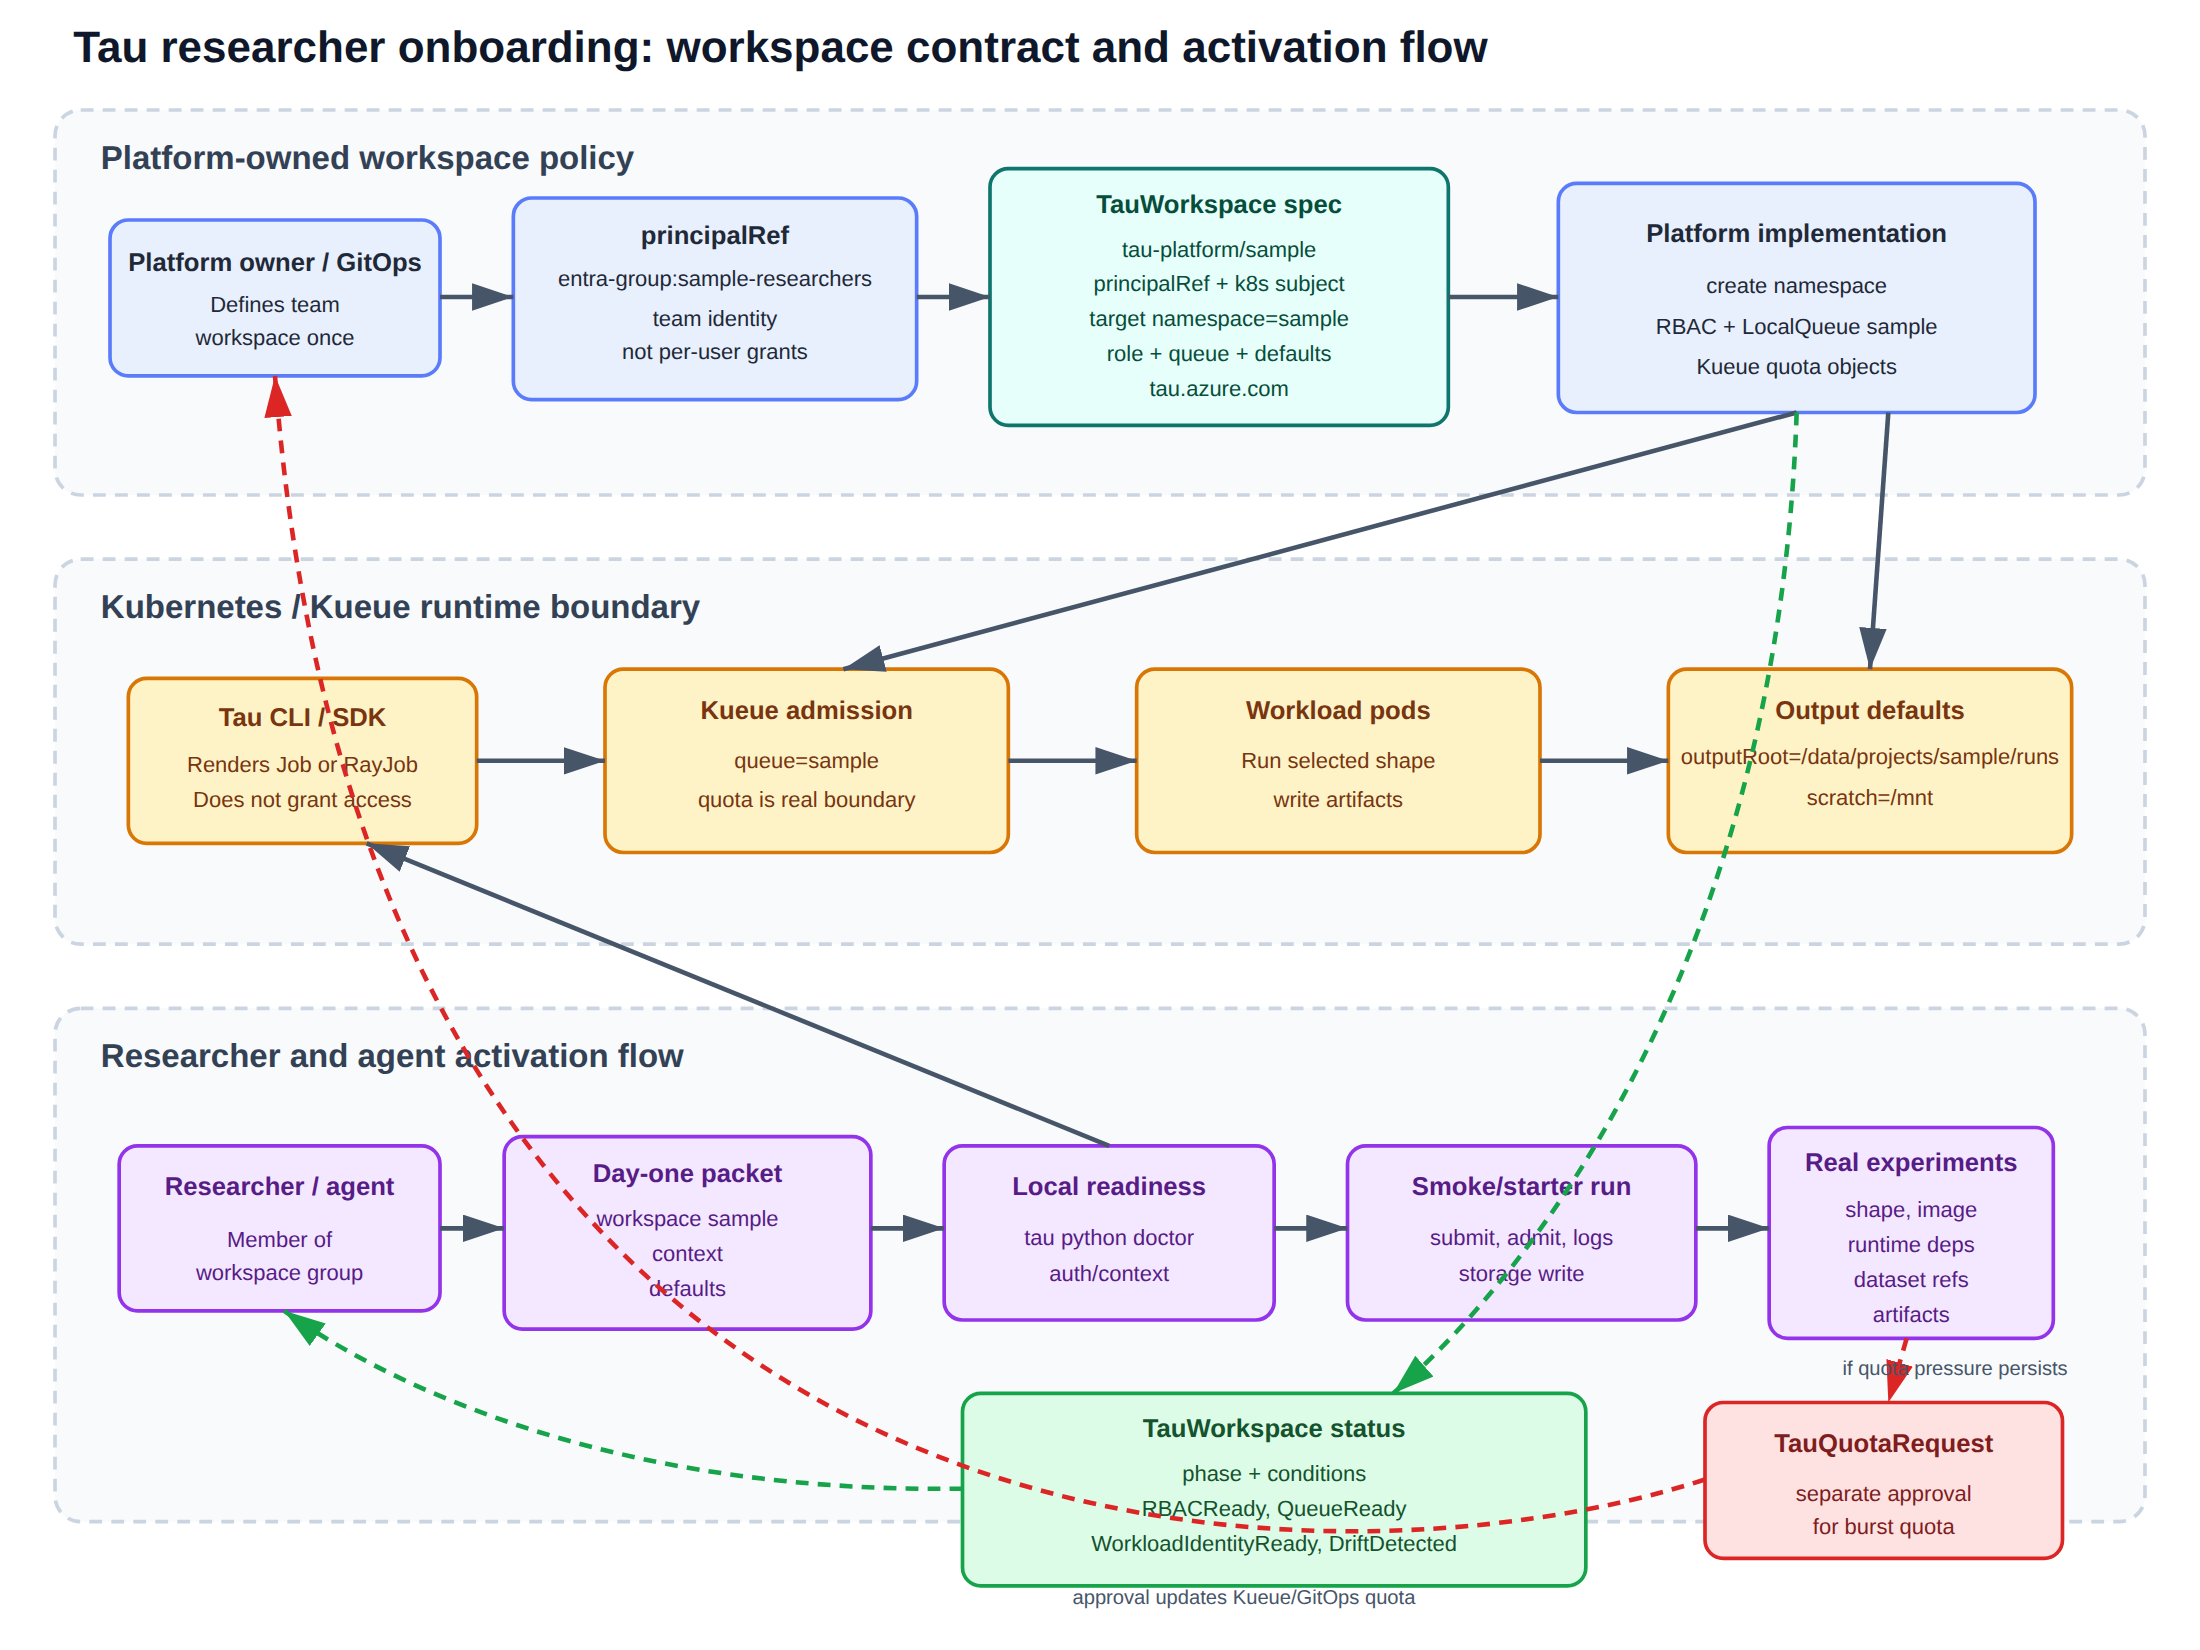
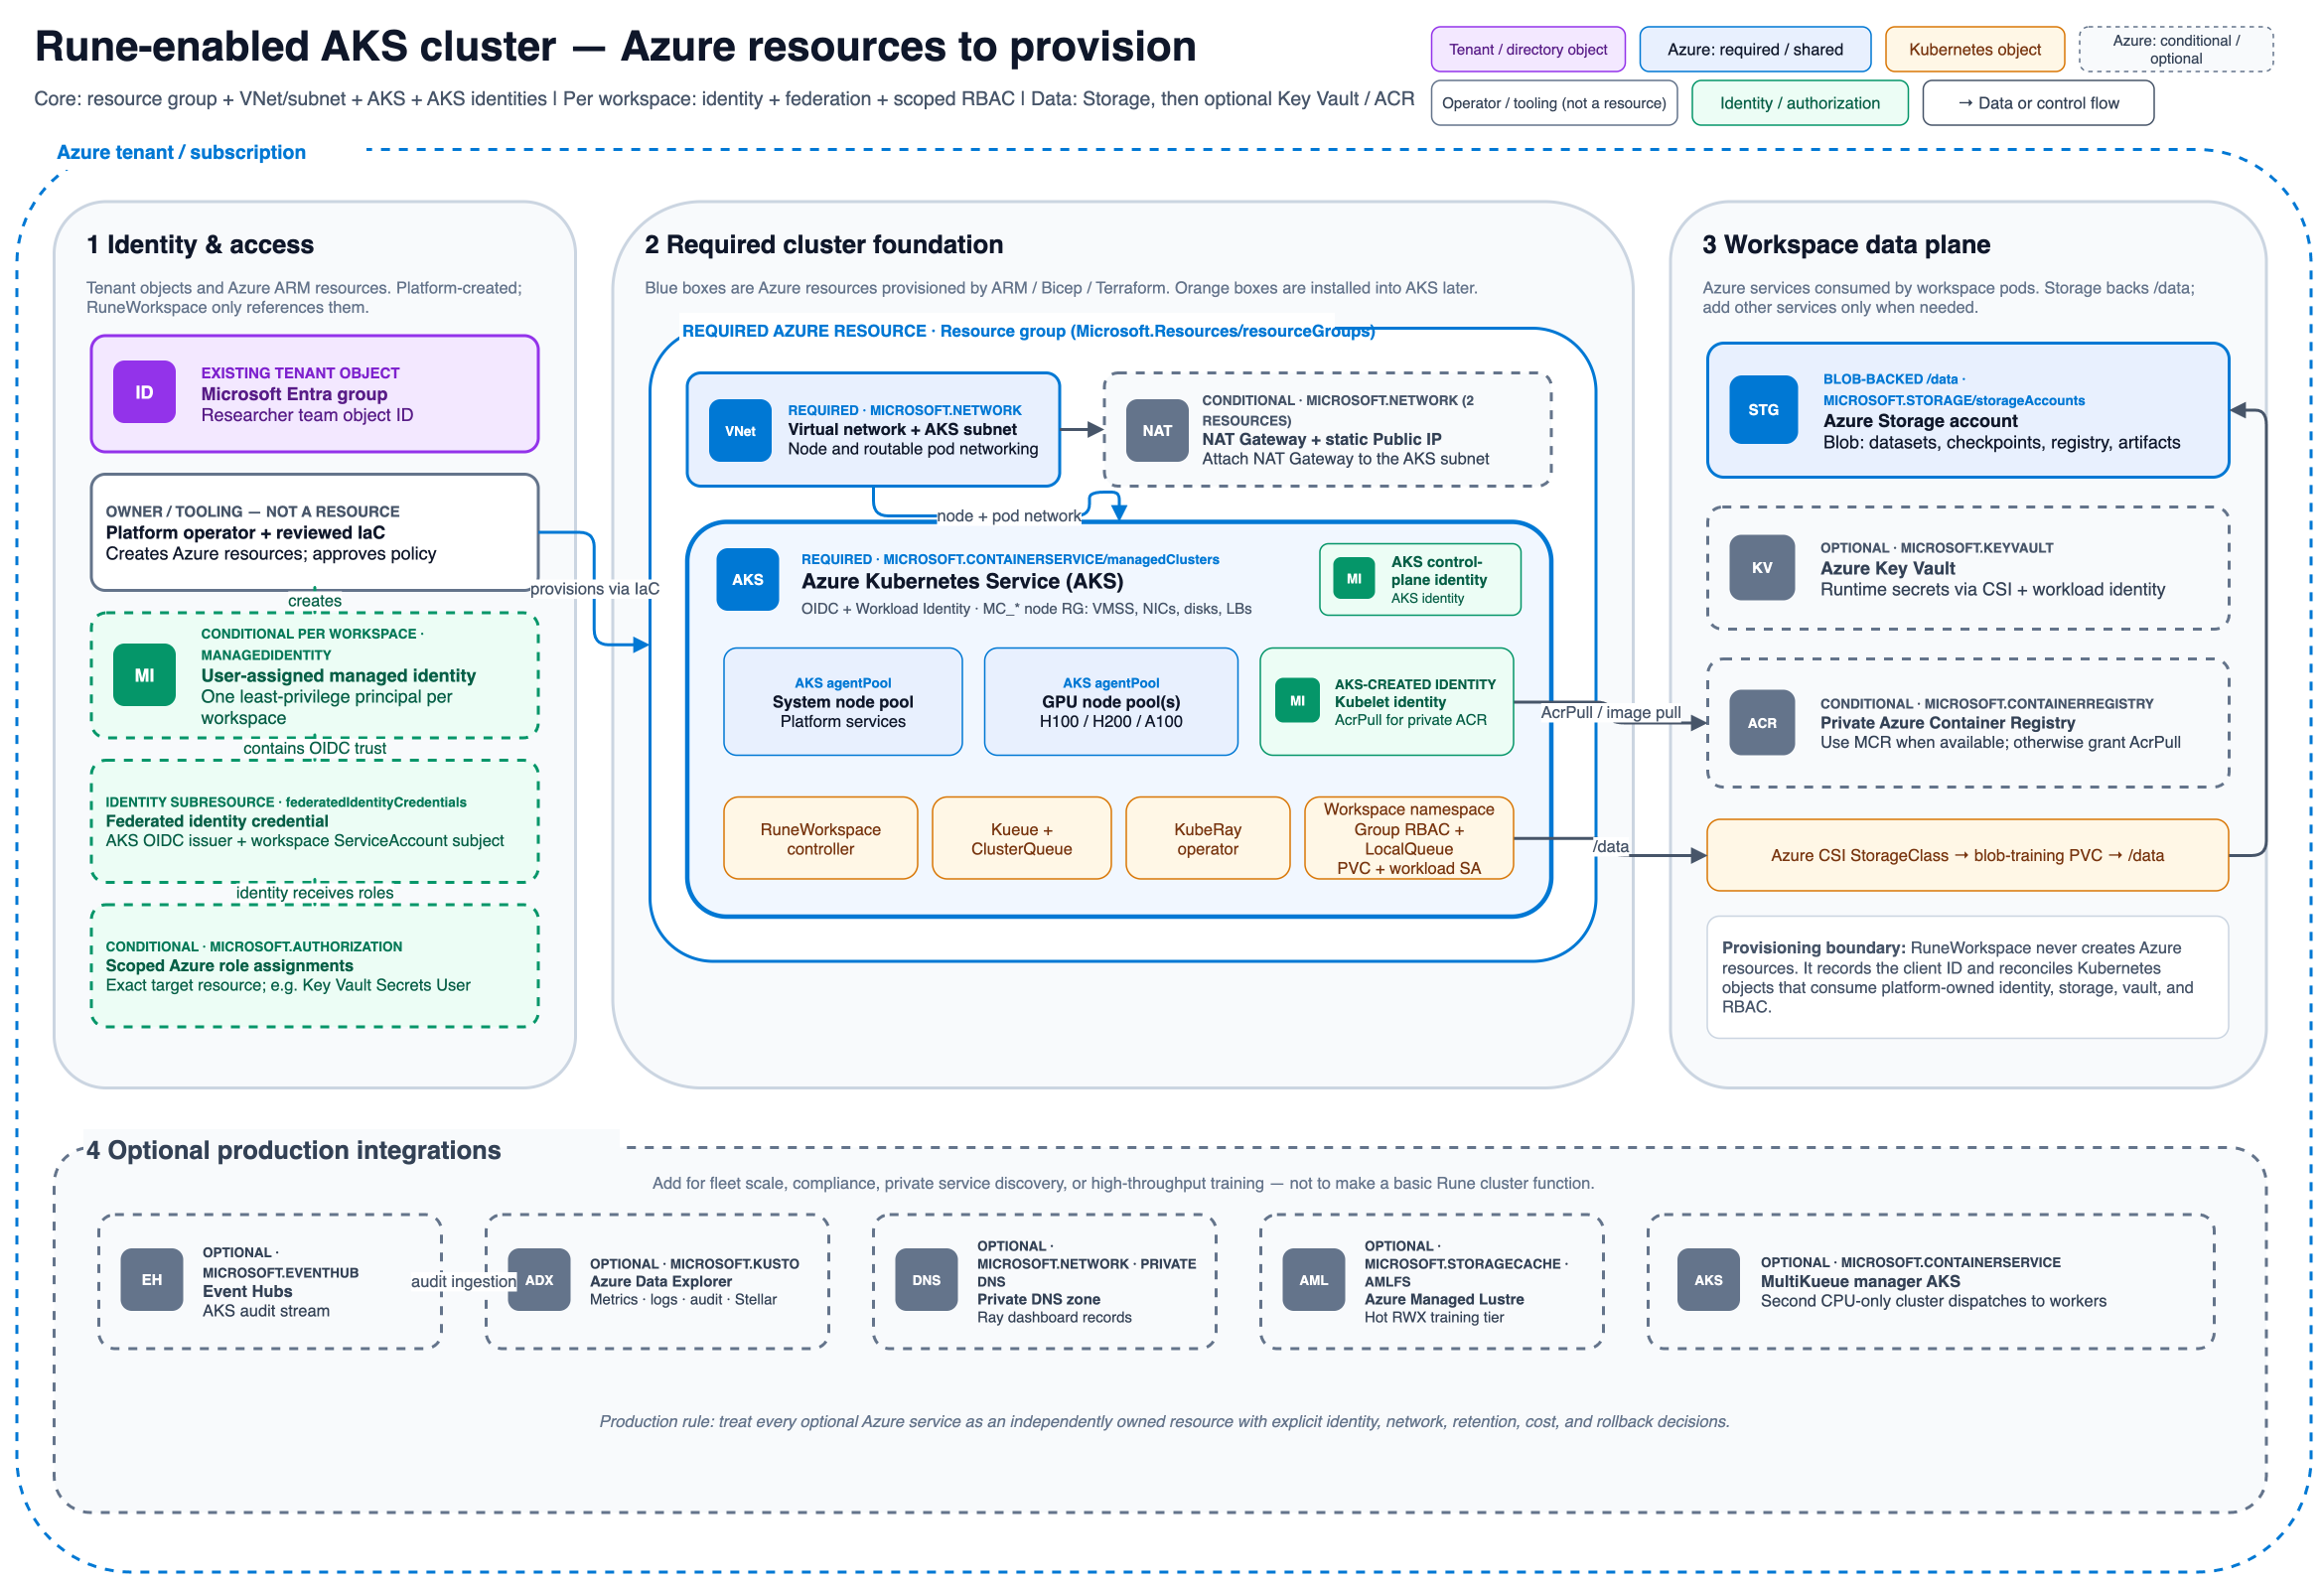
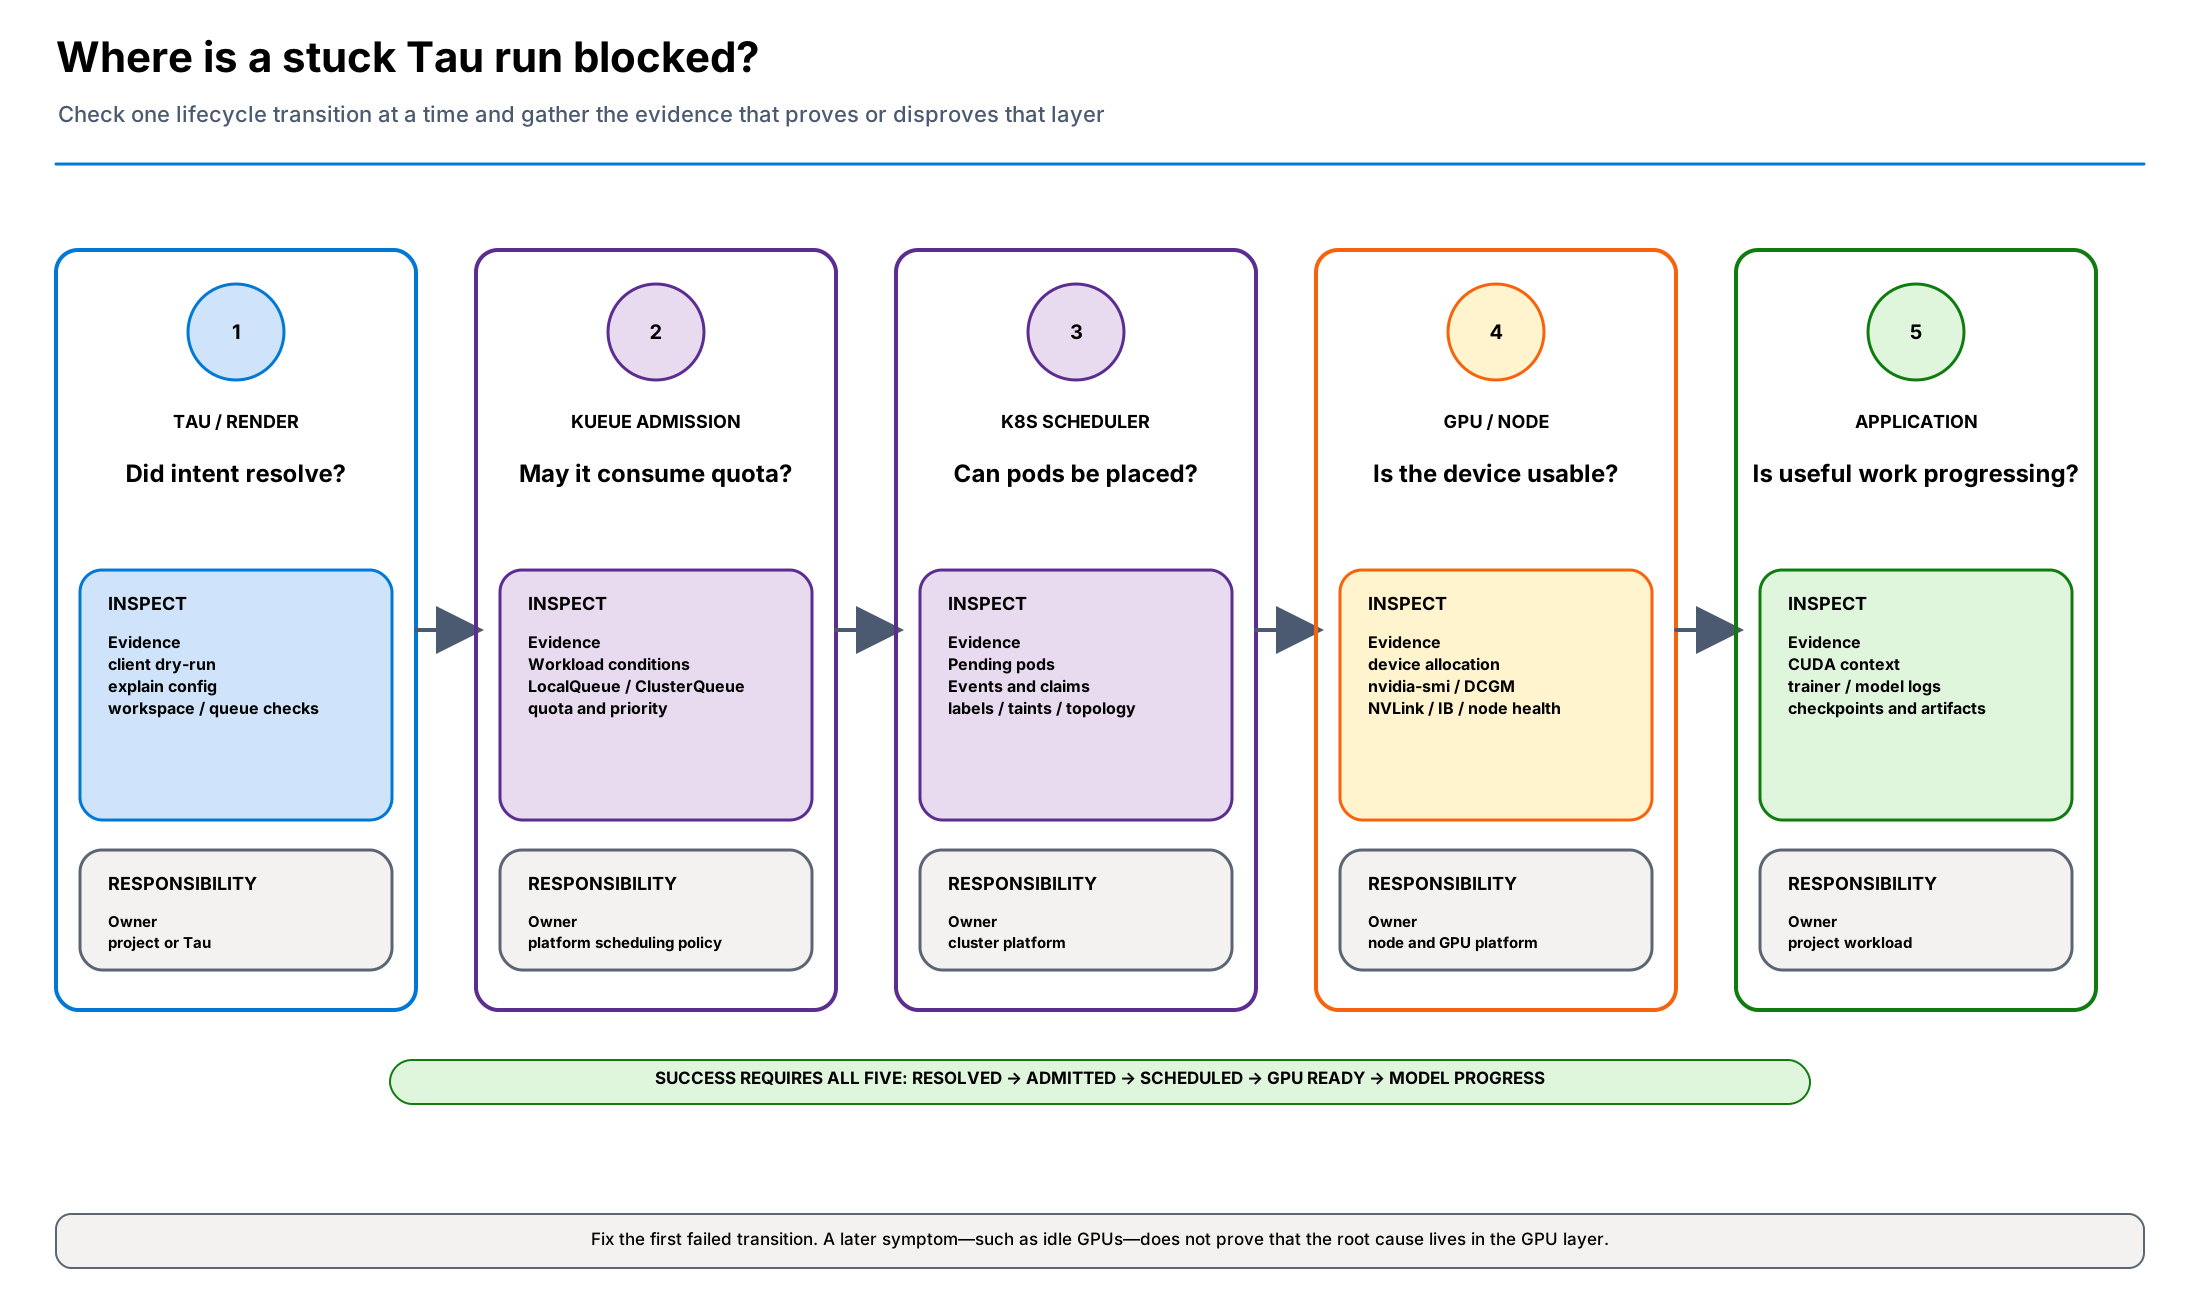
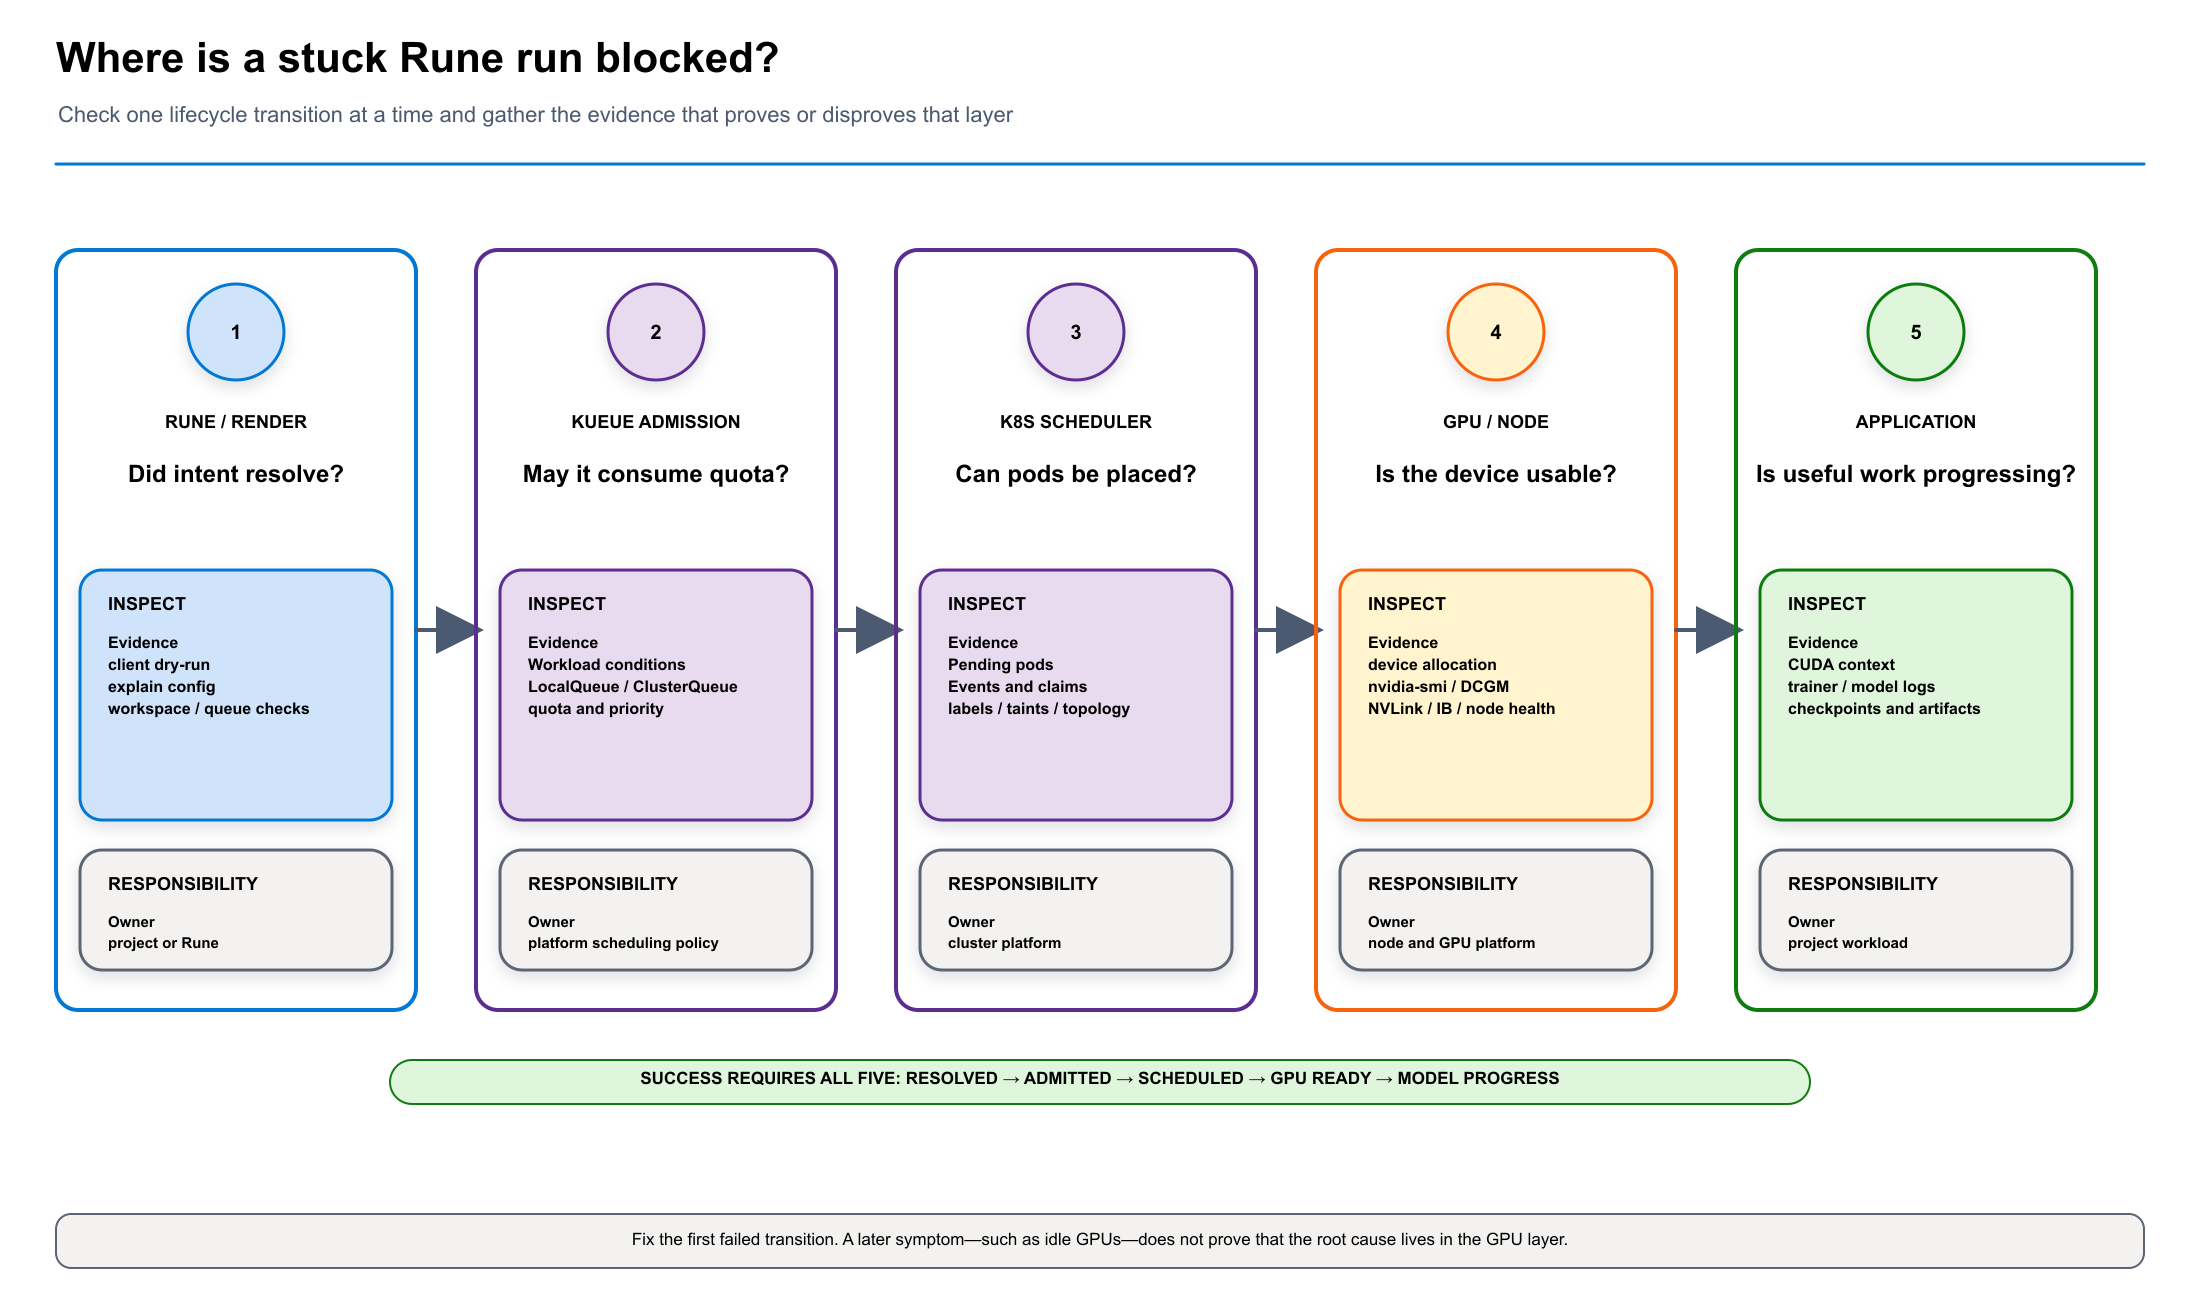
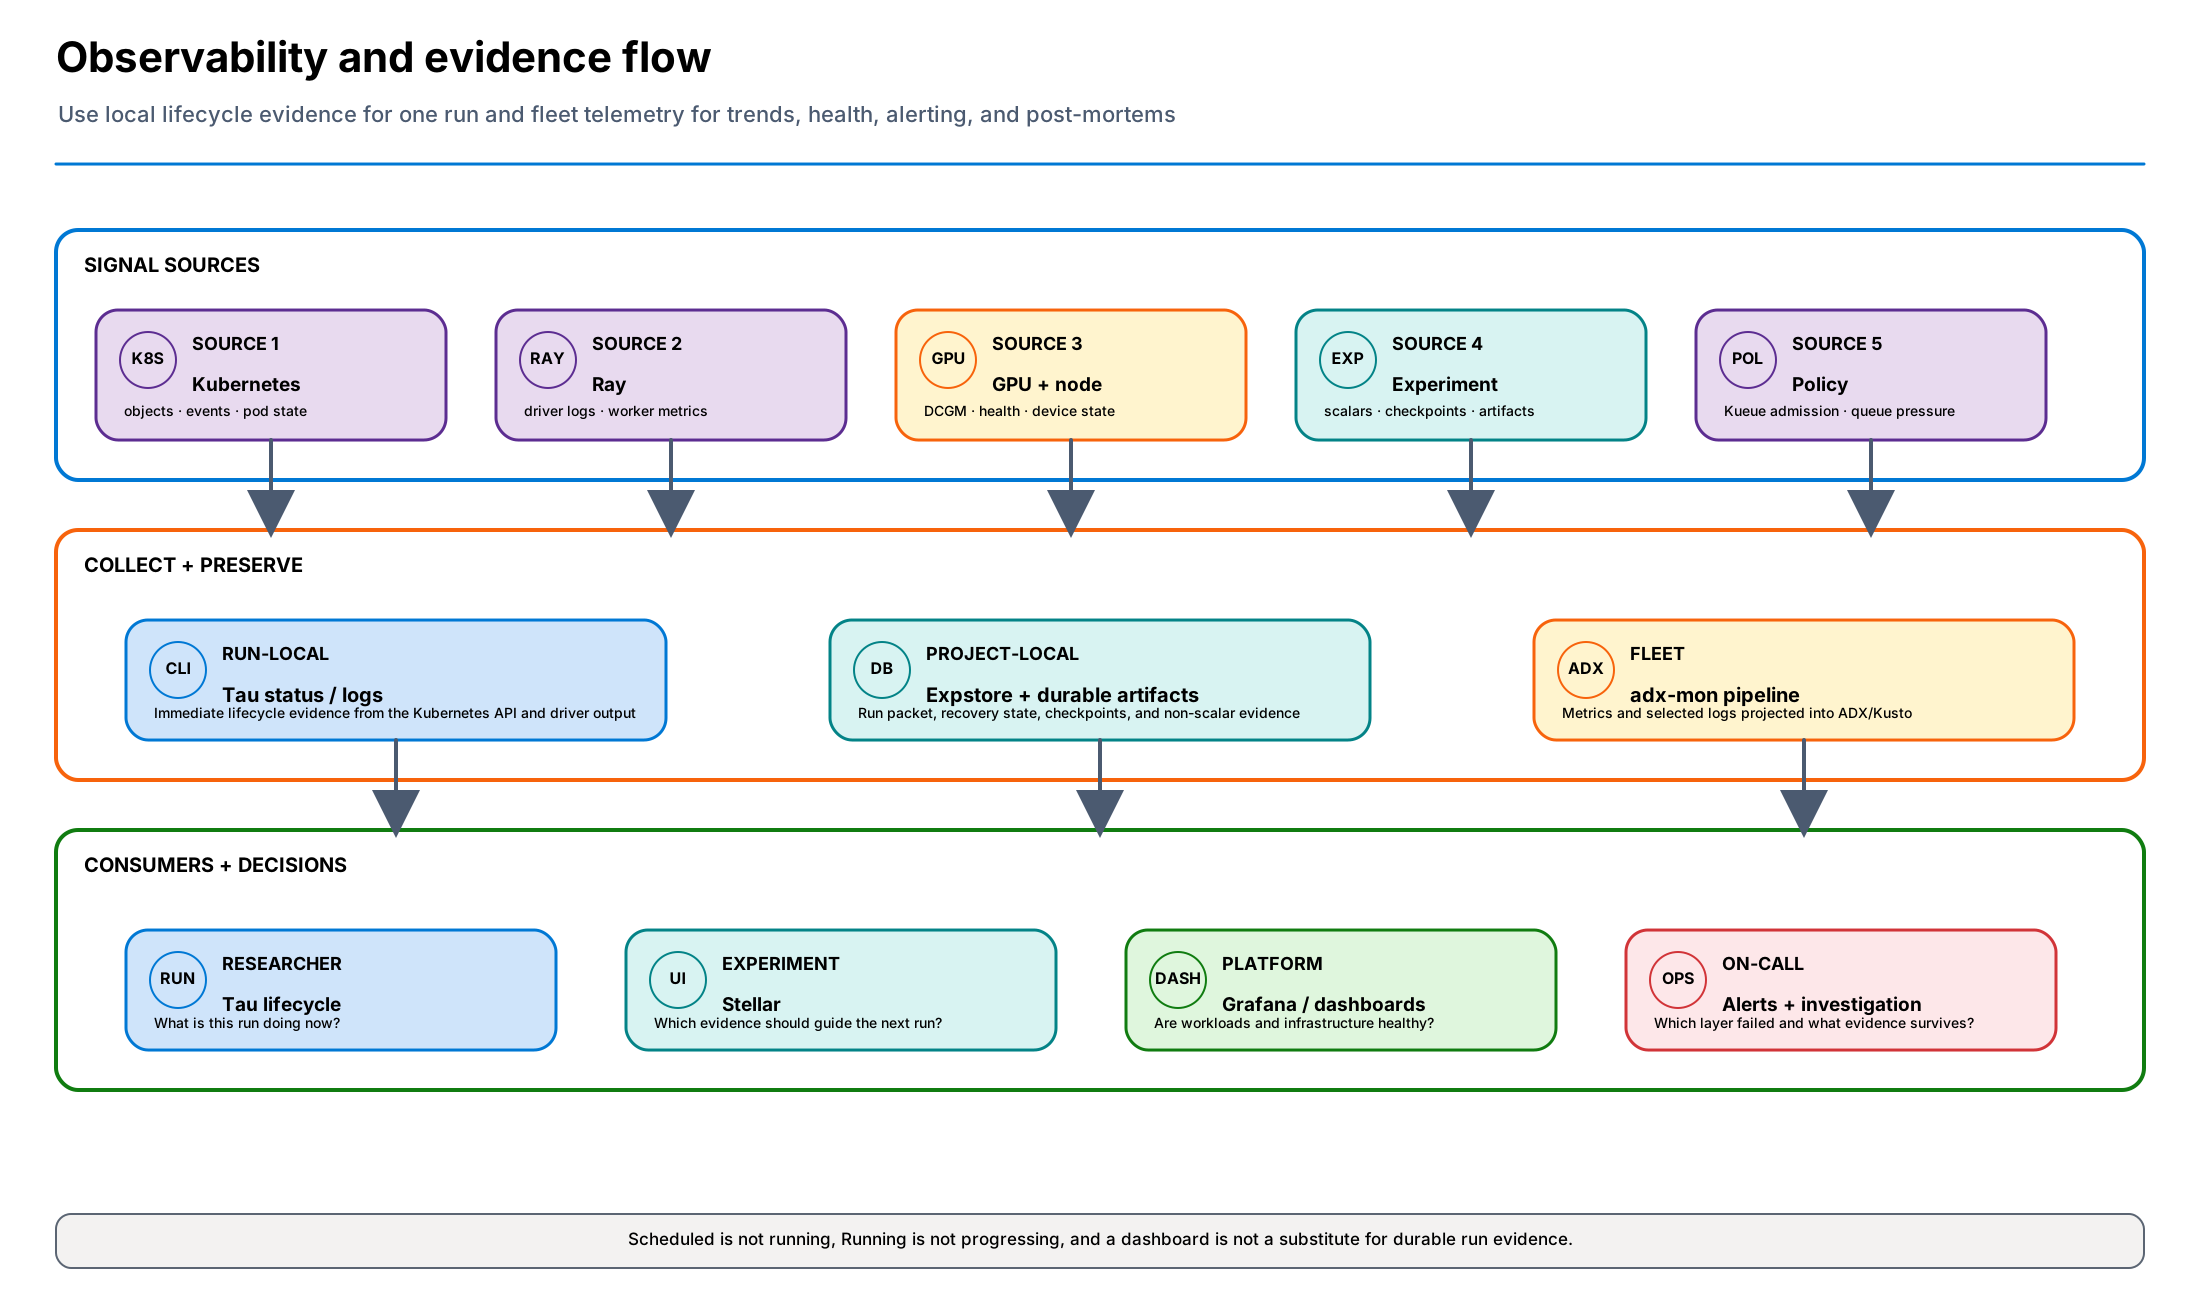
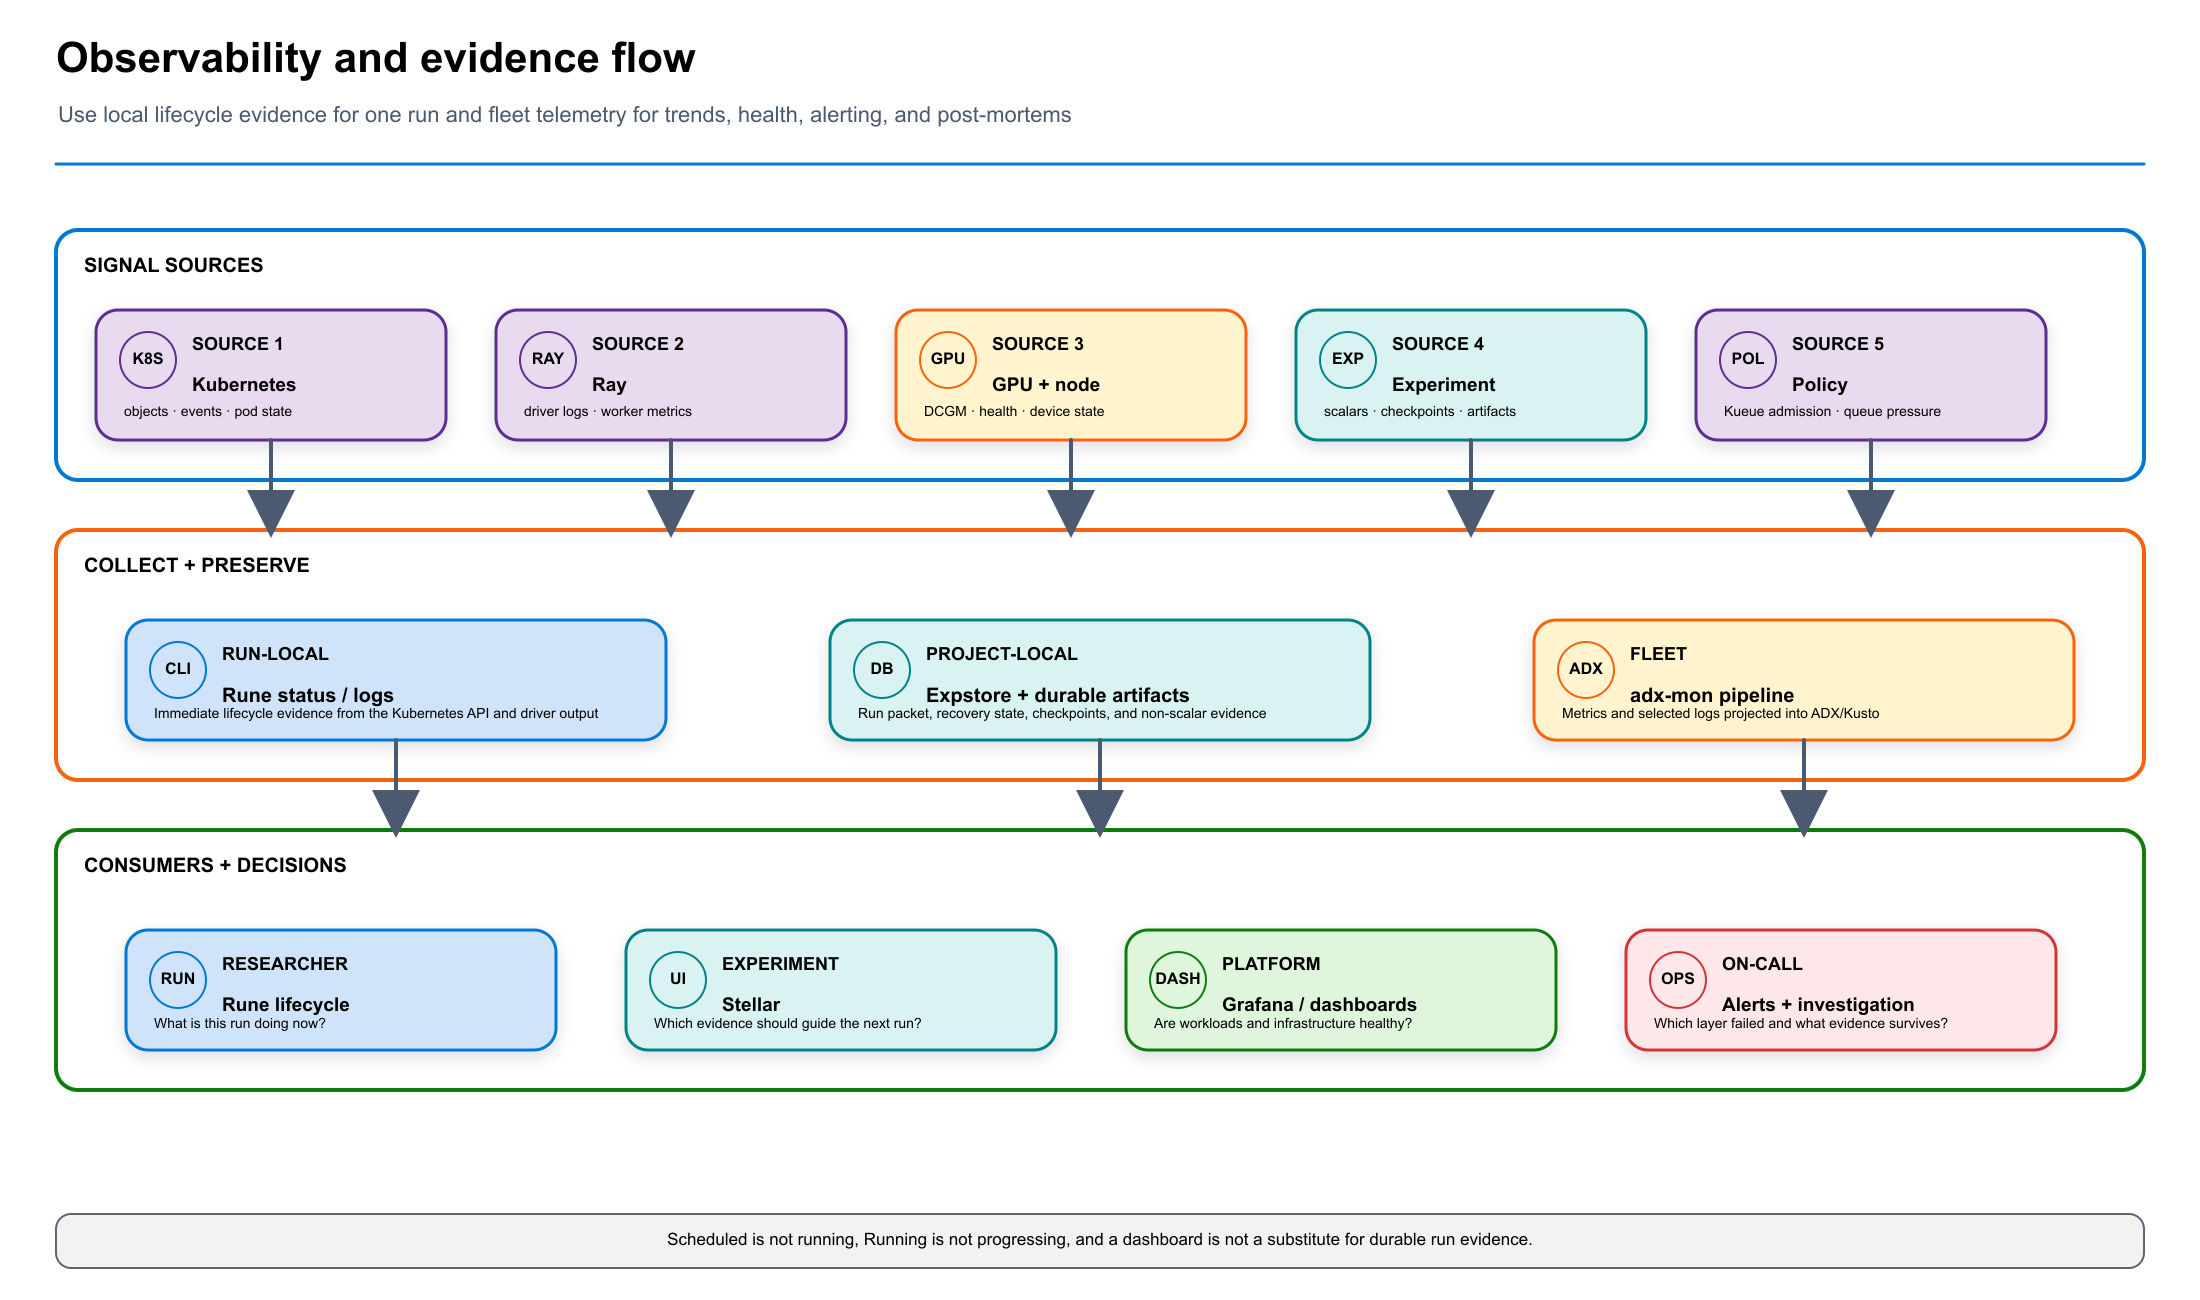
Each diagram answers one reader question and preserves an editable source, SVG, and PNG. Solid elements represent GA capabilities. Orange dashed elements represent Alpha or Beta capabilities. Purple dashed elements represent Planned work.
Understand and evaluate
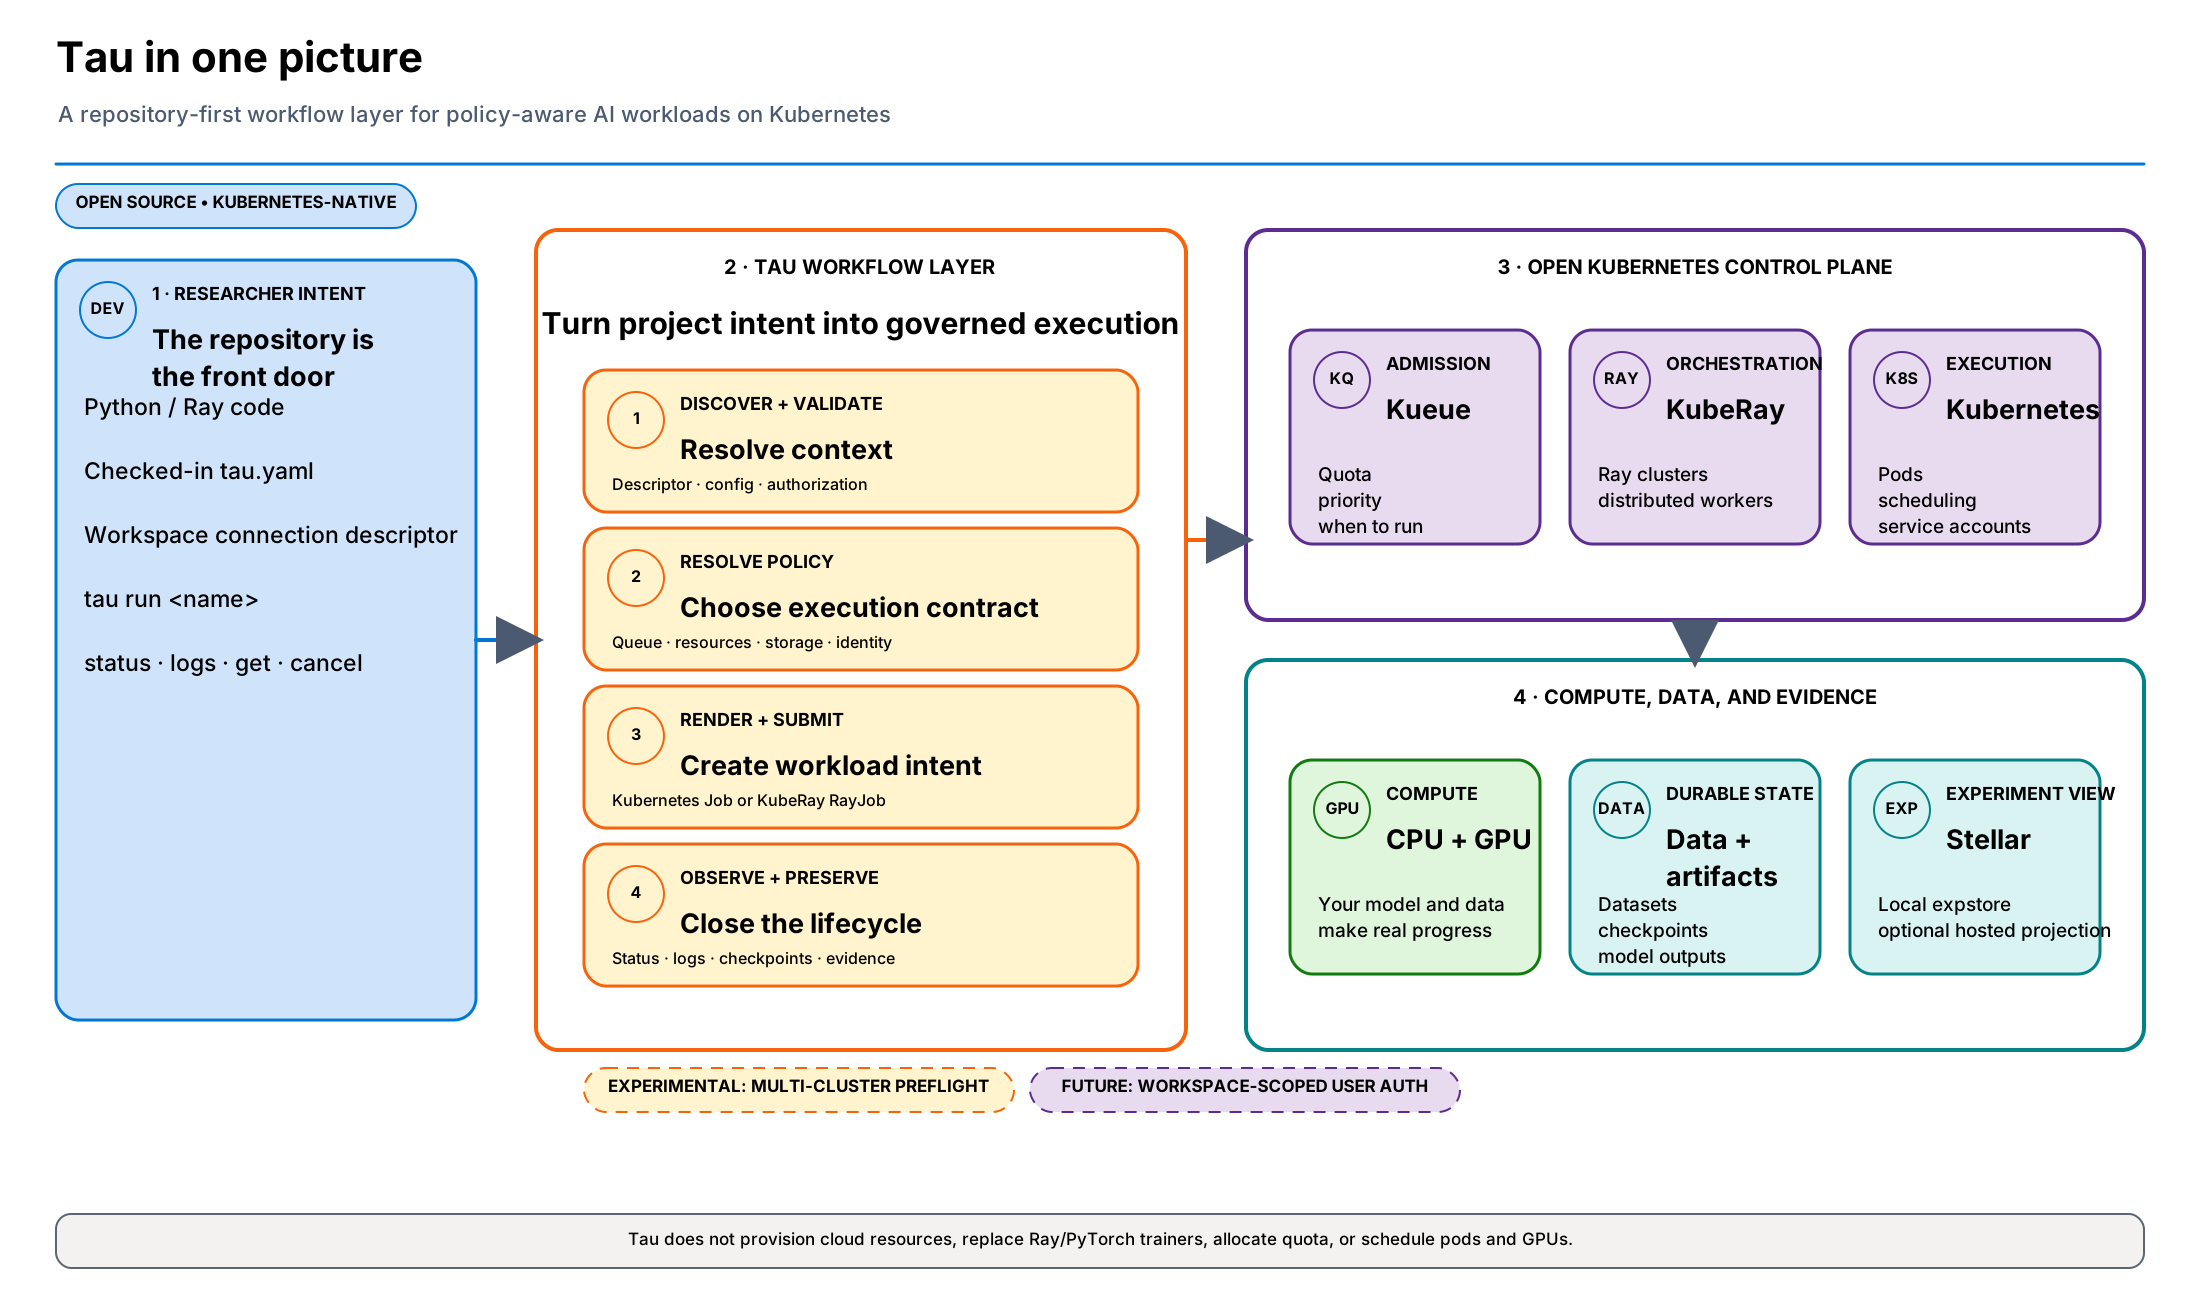
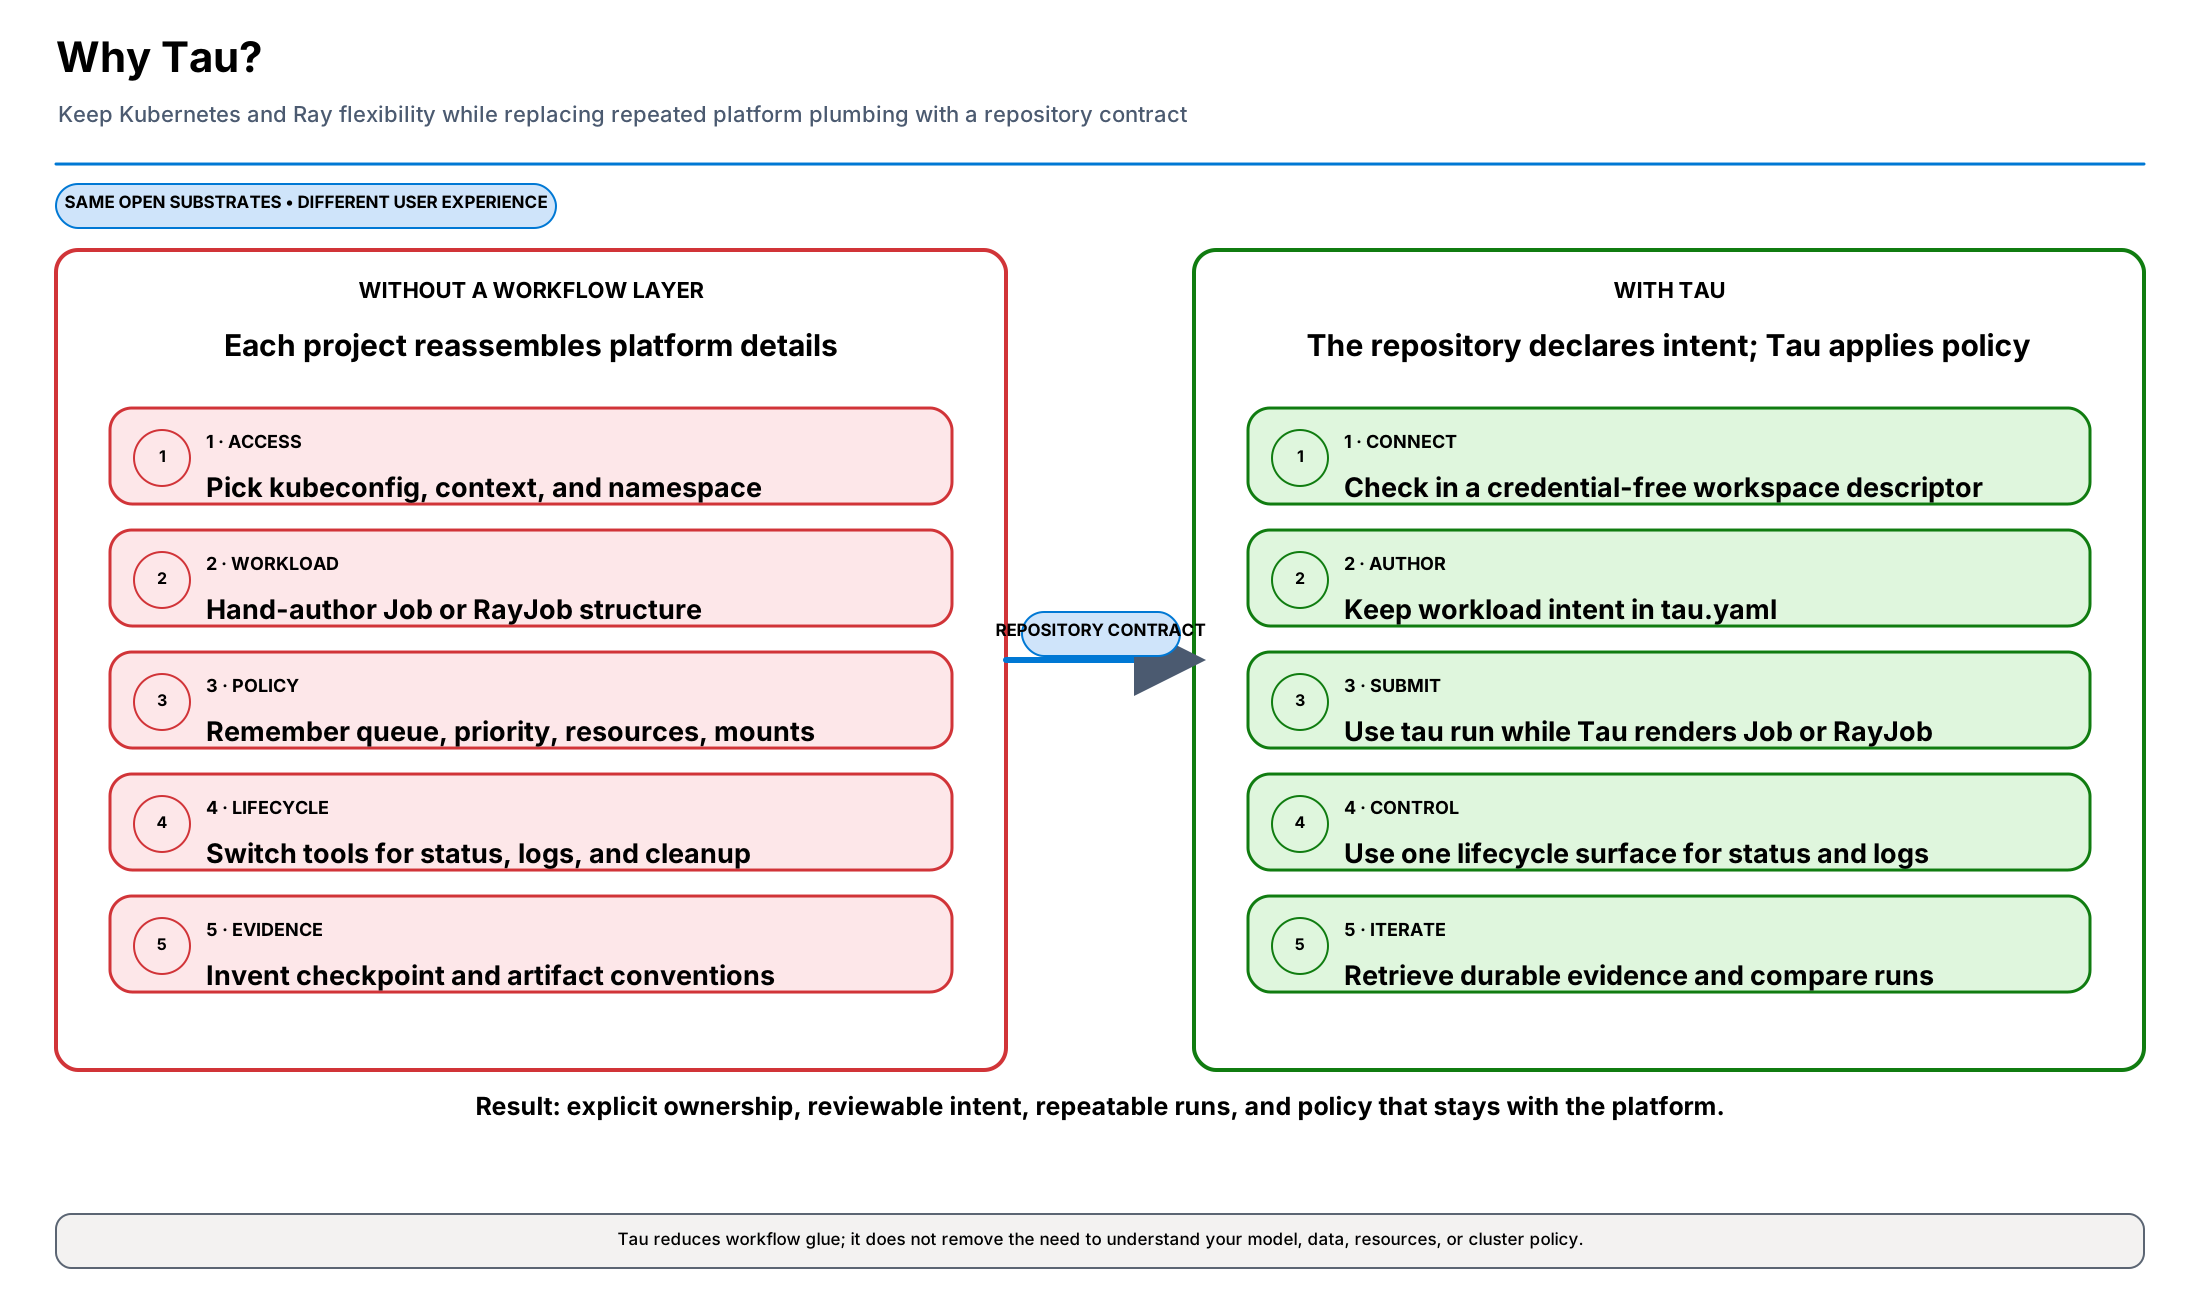
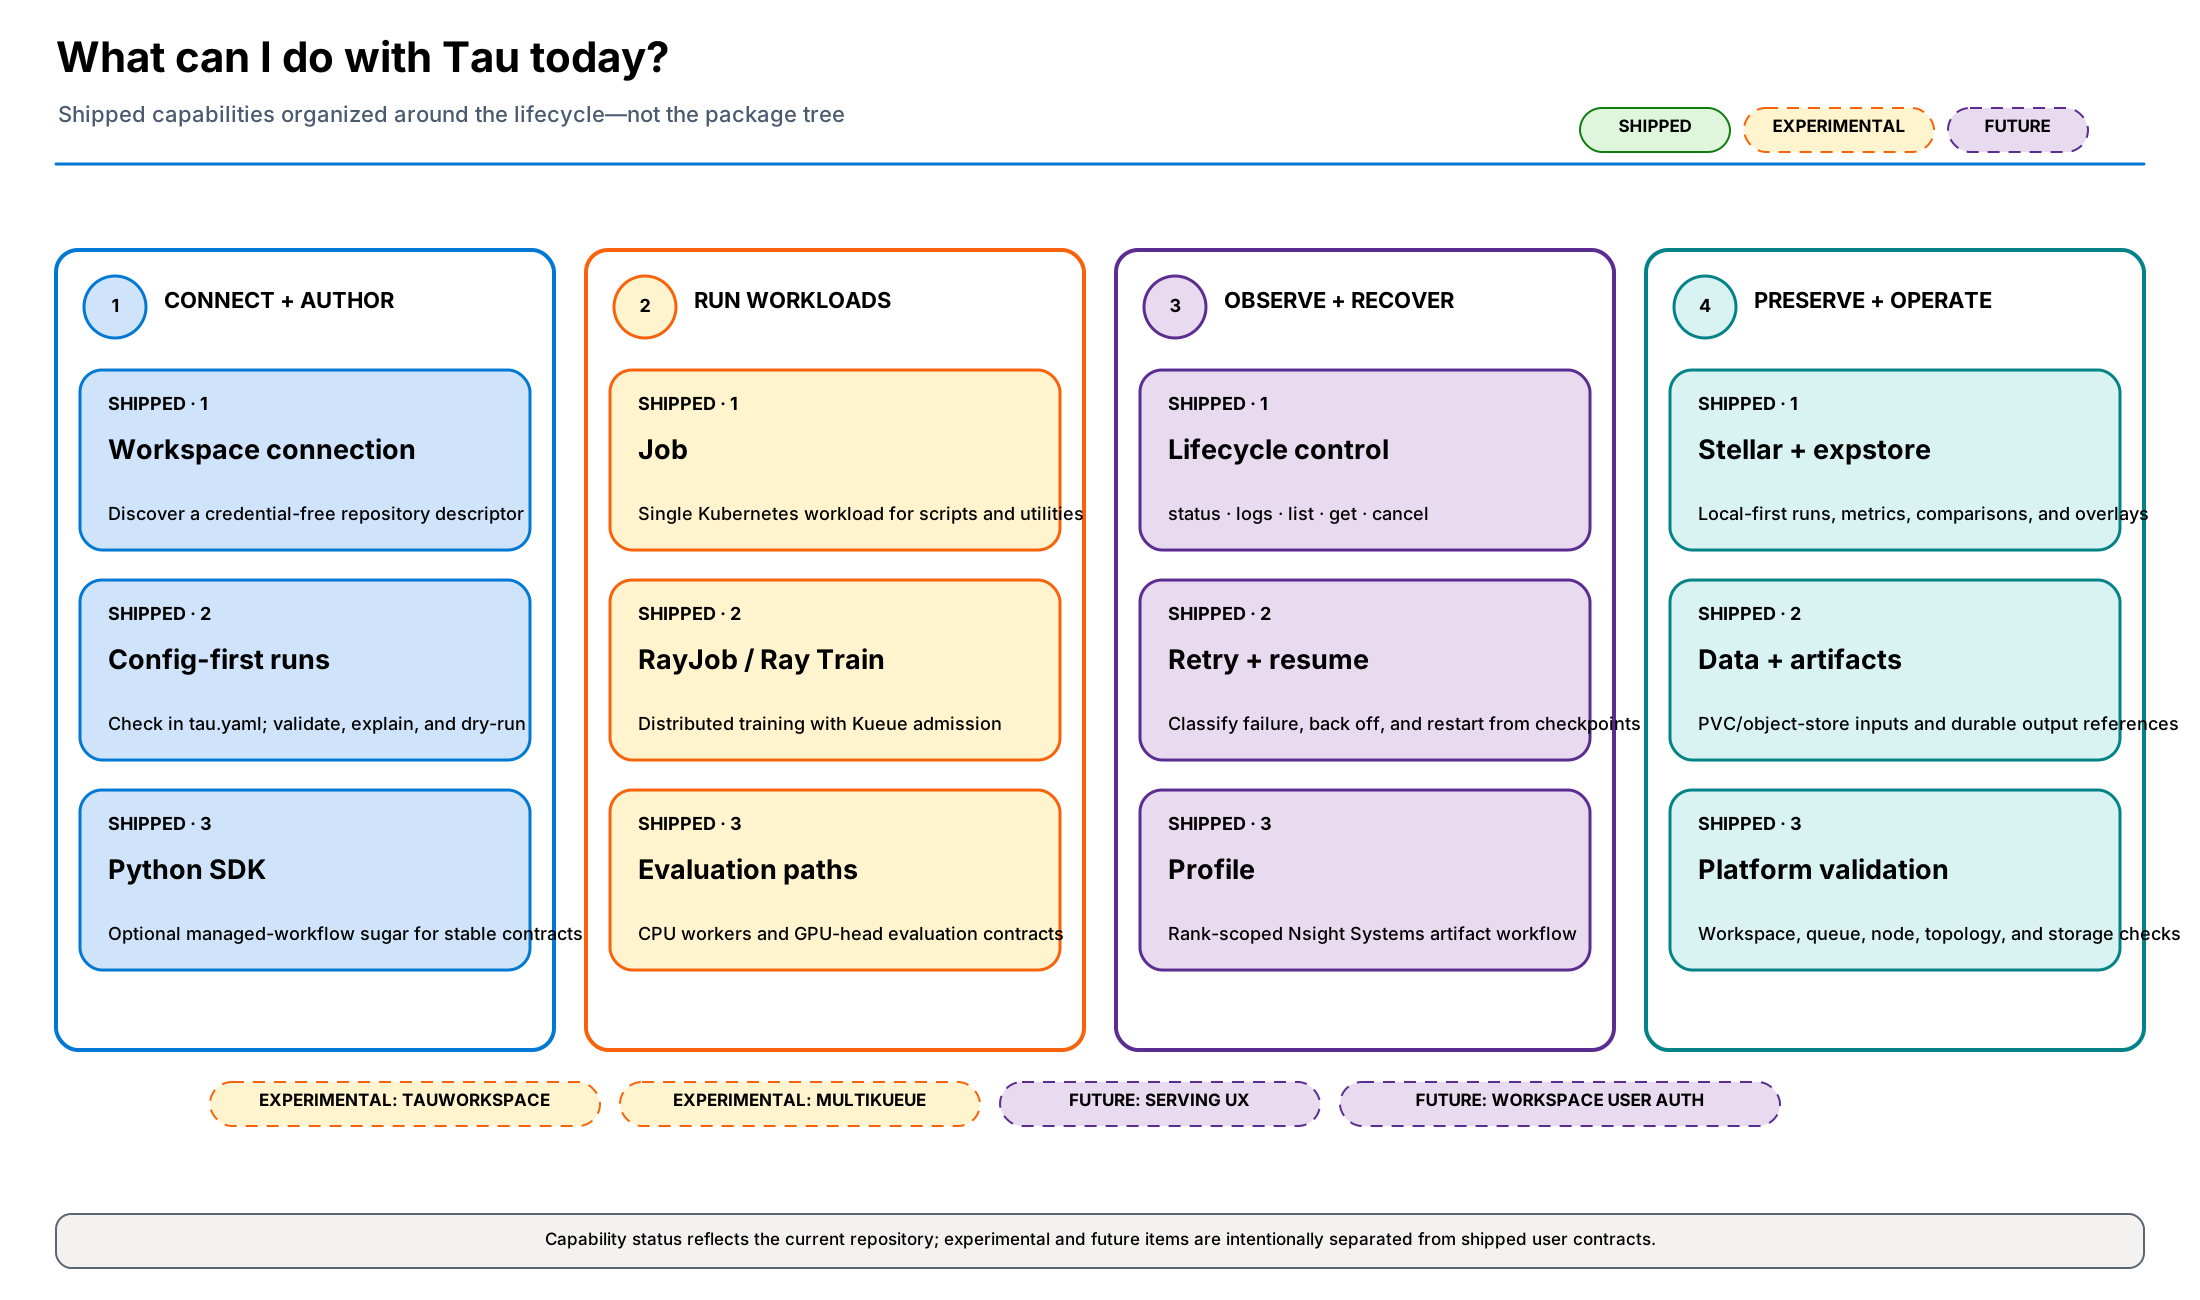
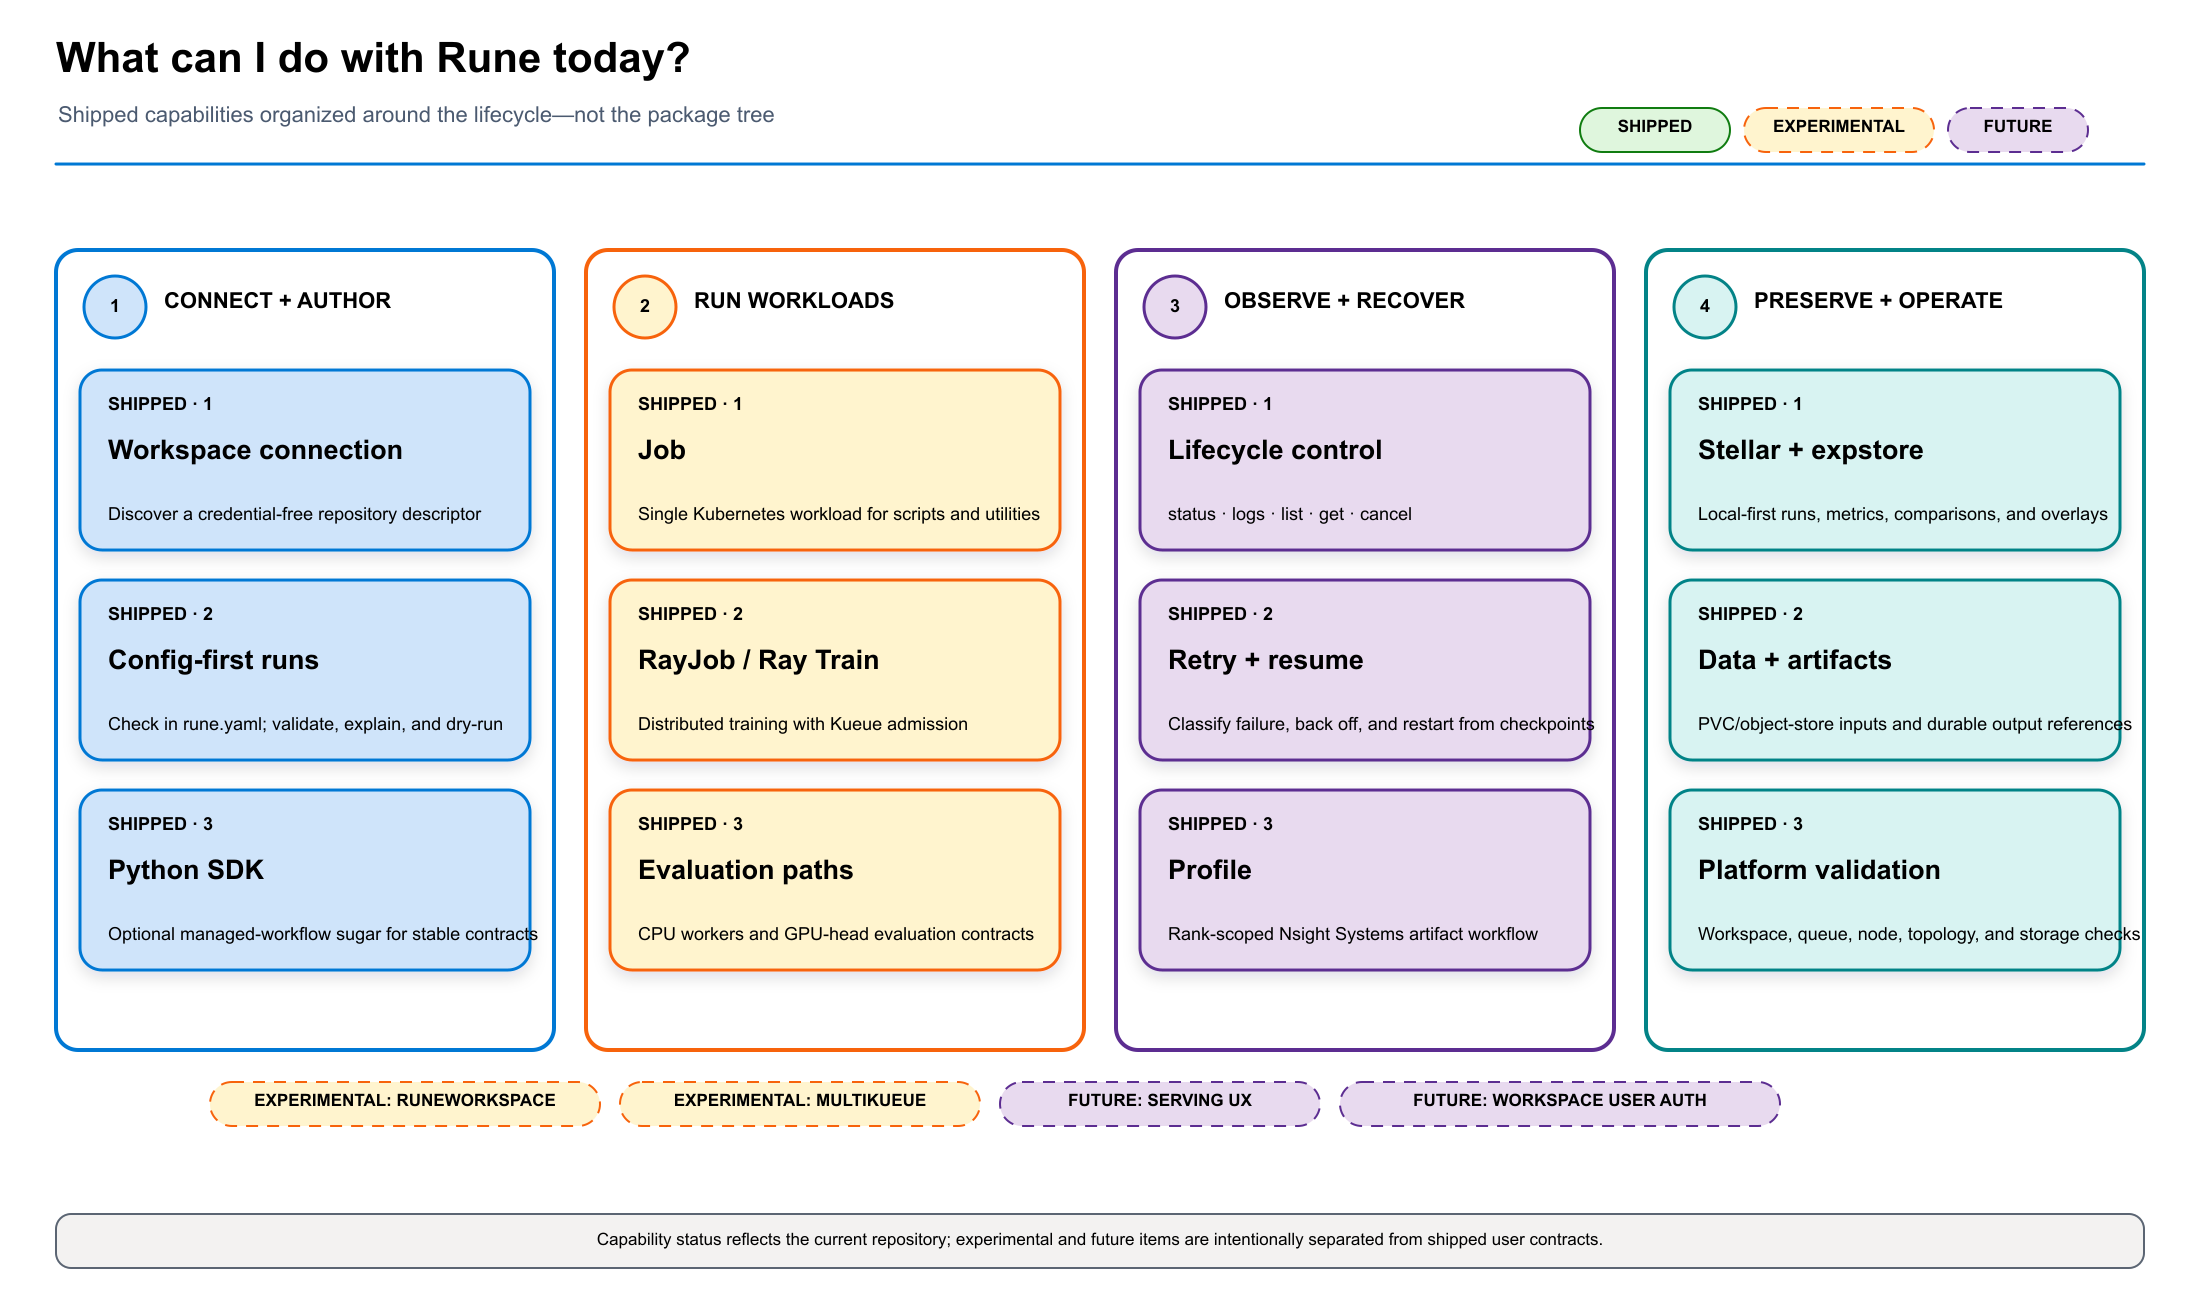
Adopt and configure
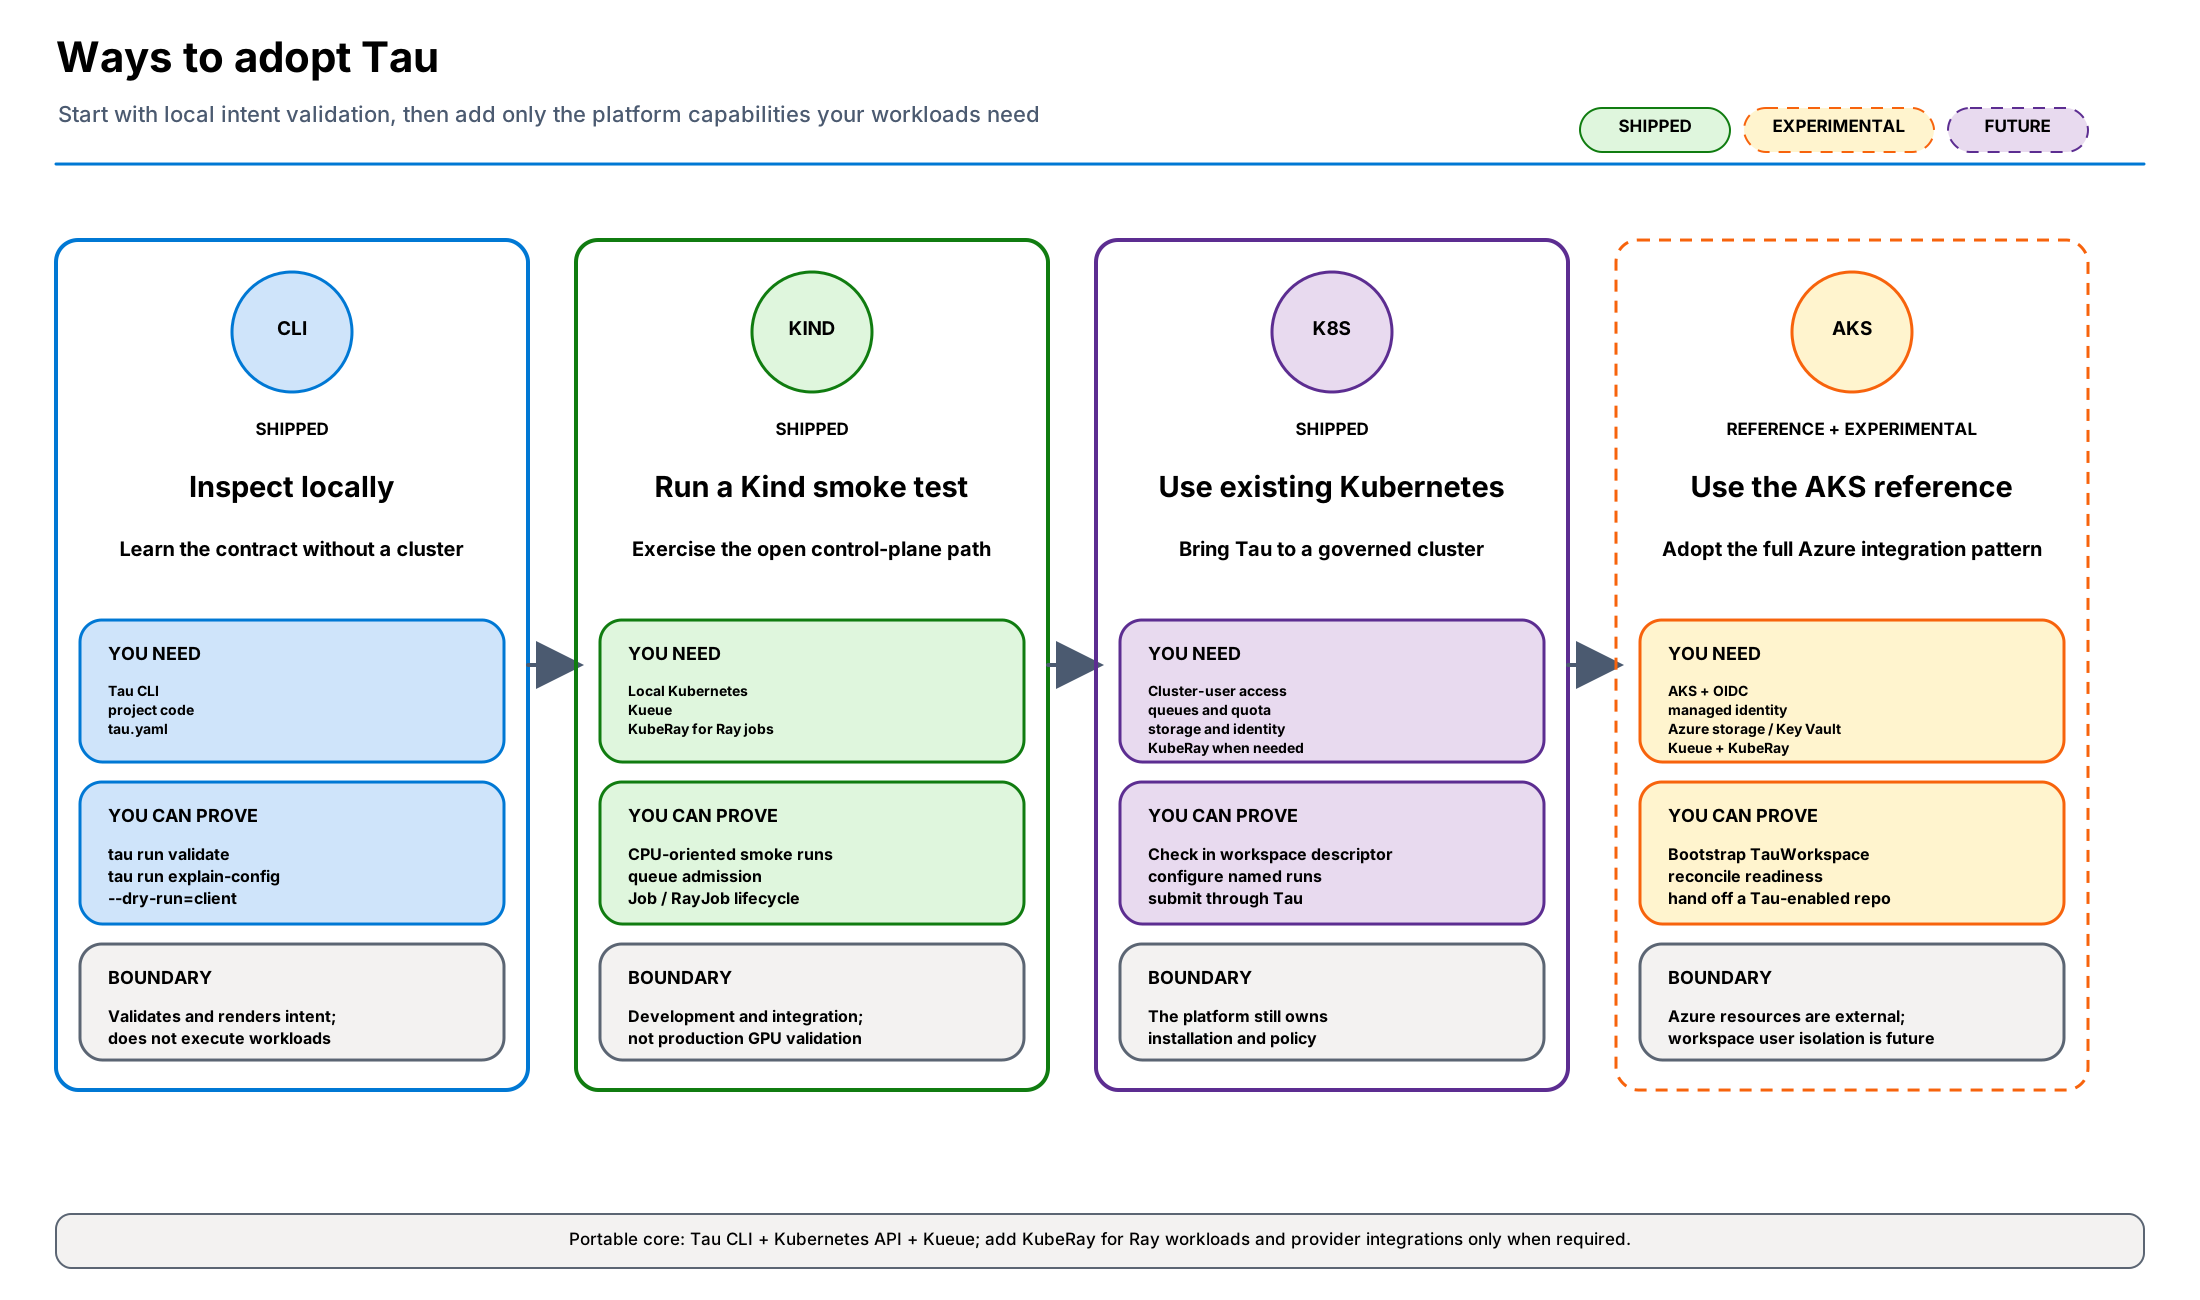
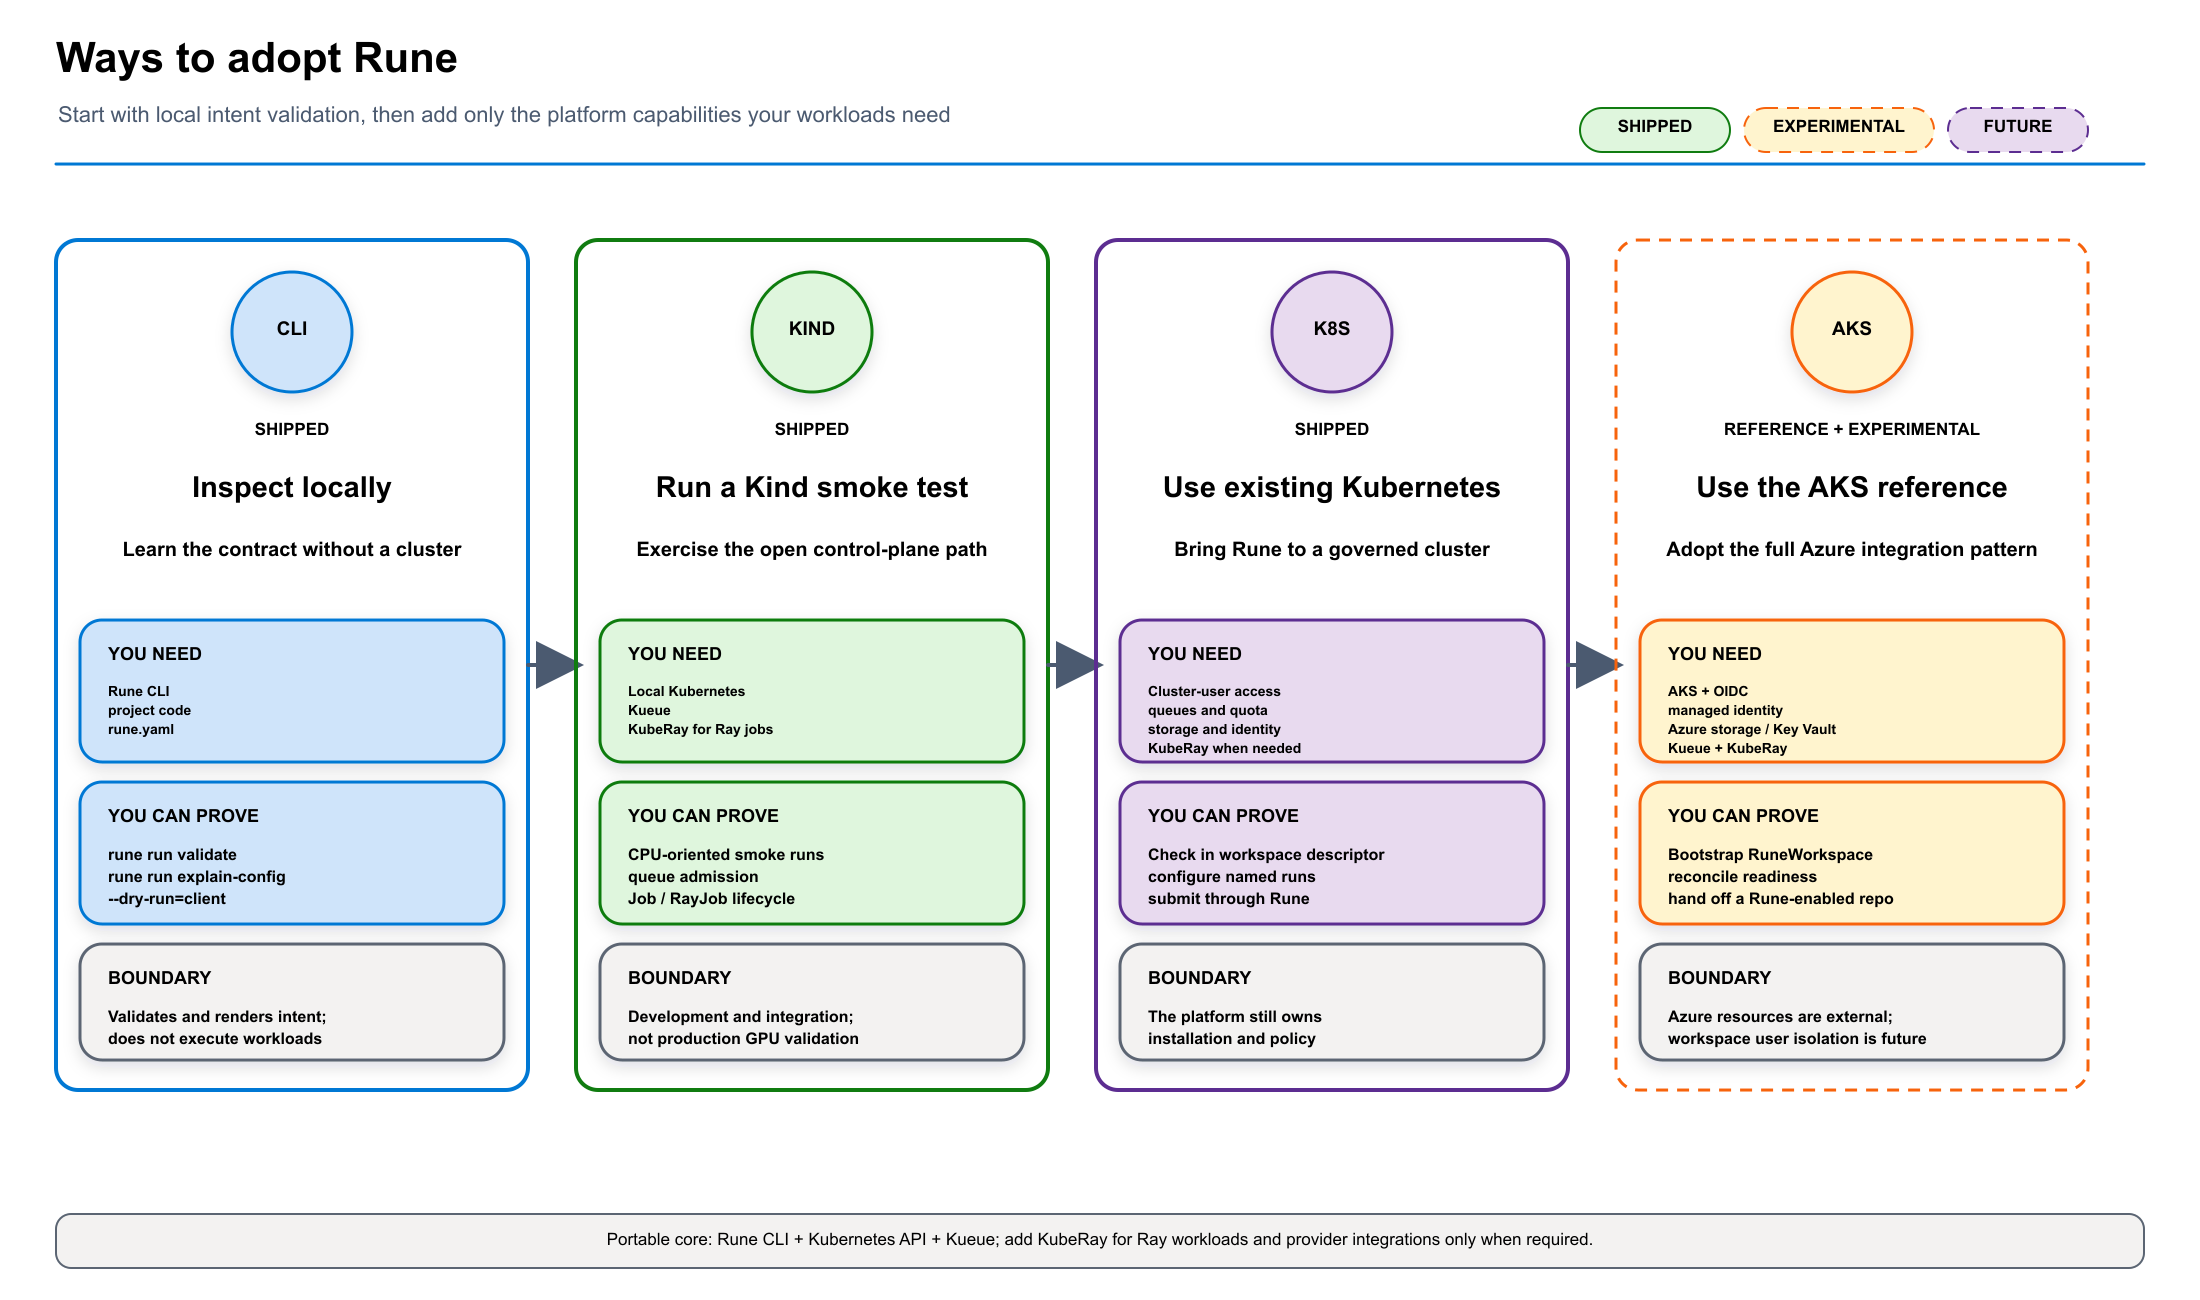
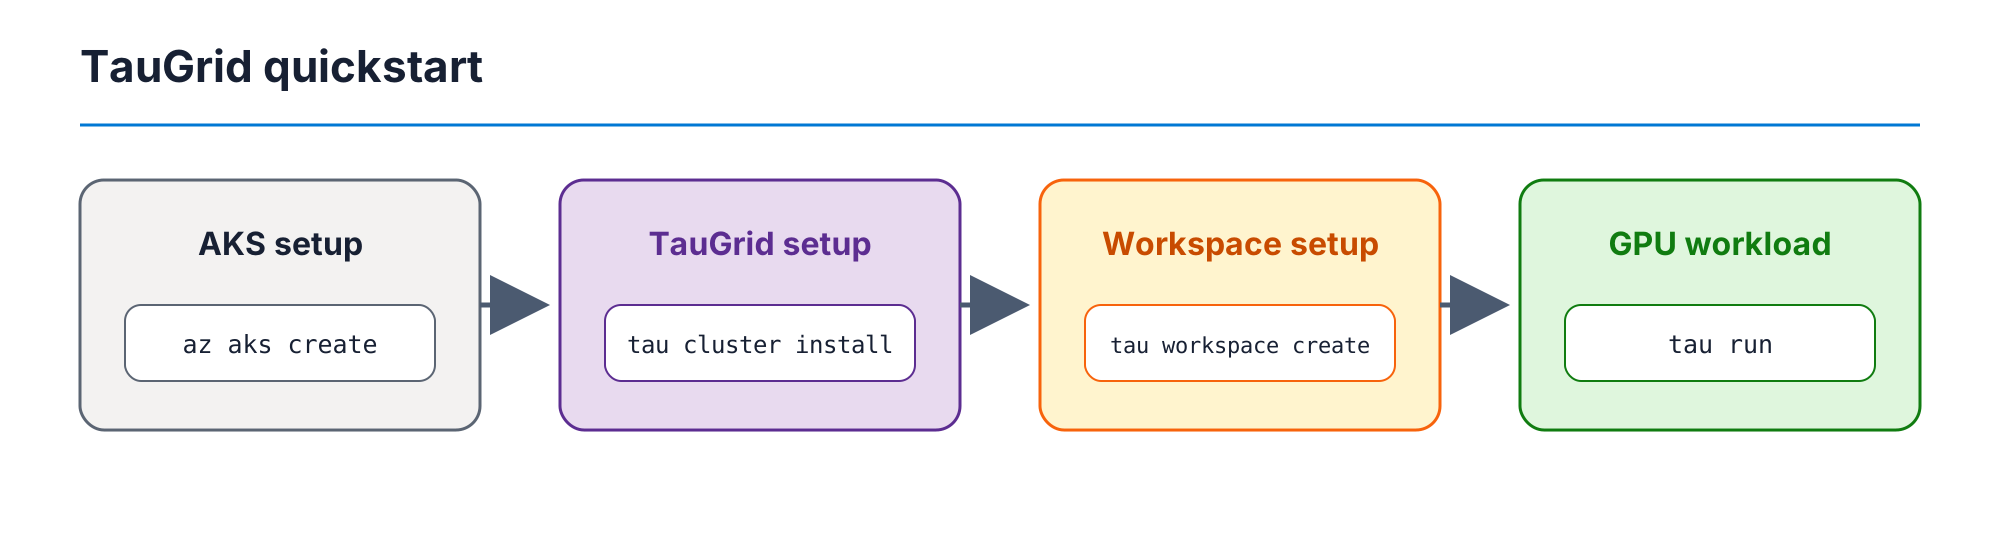
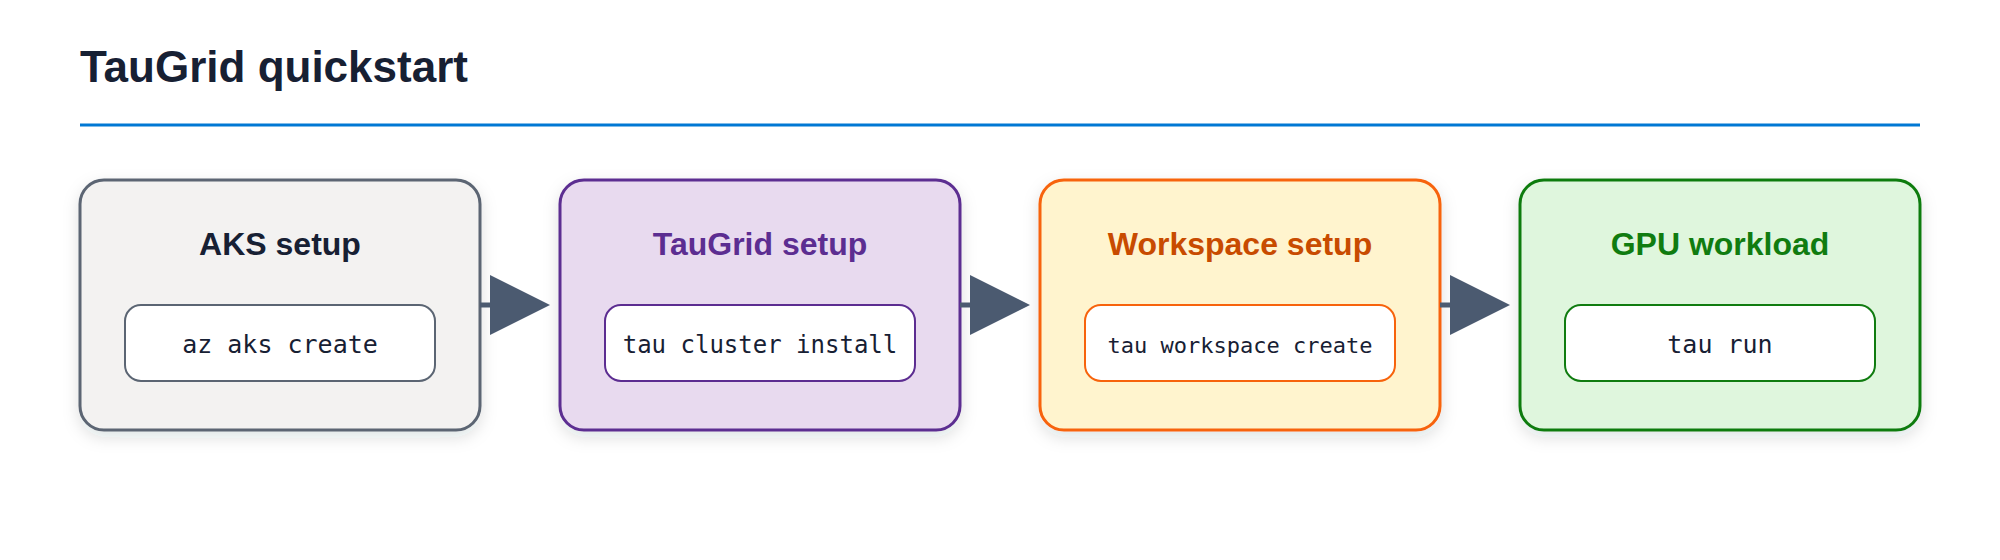
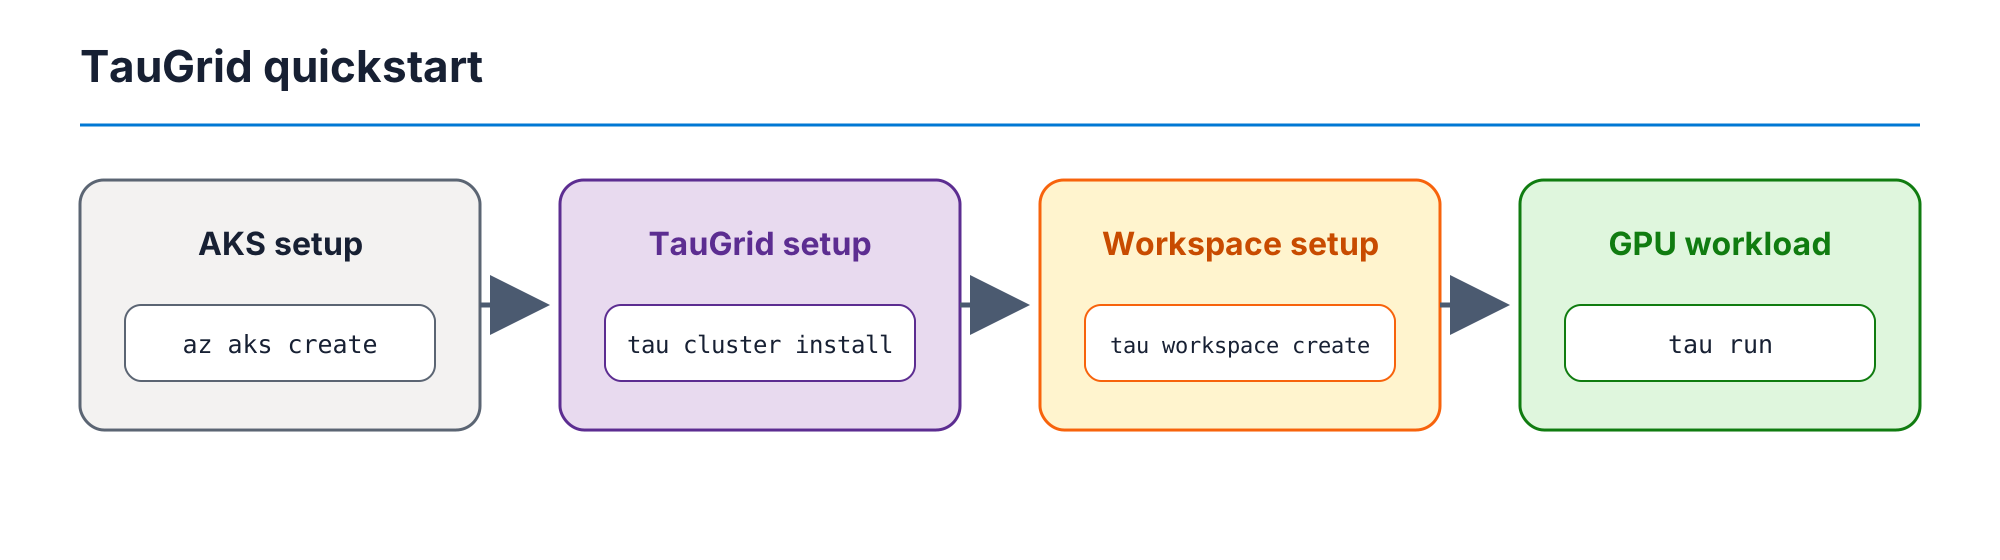

Use TauGrid day to day
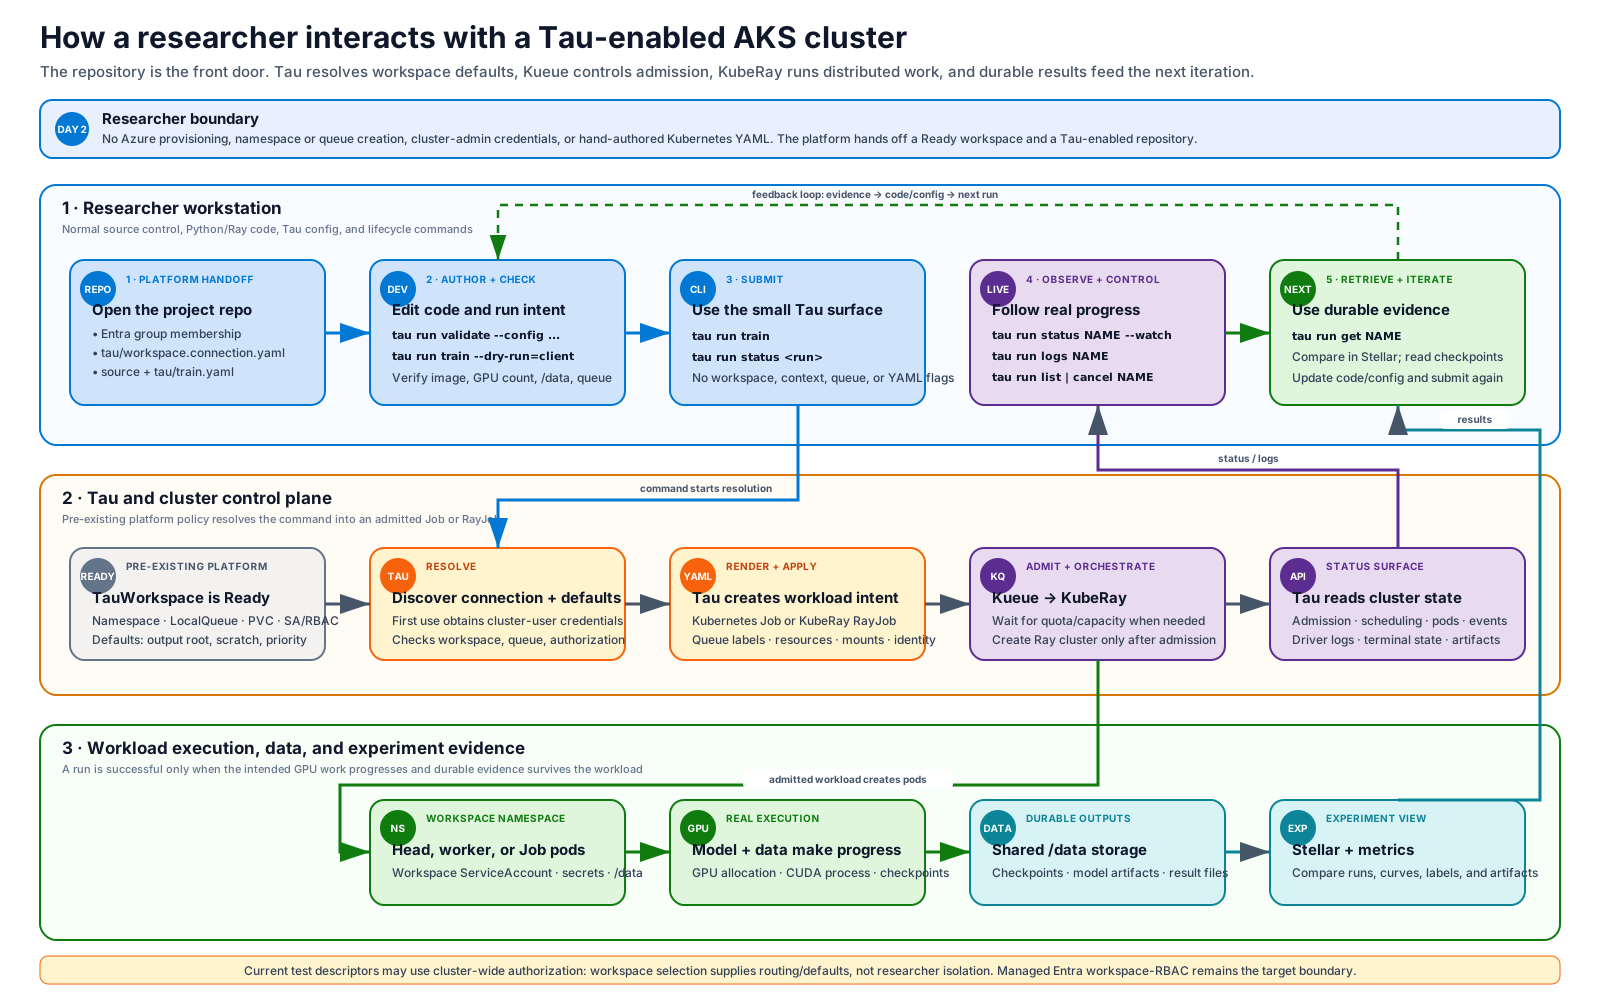
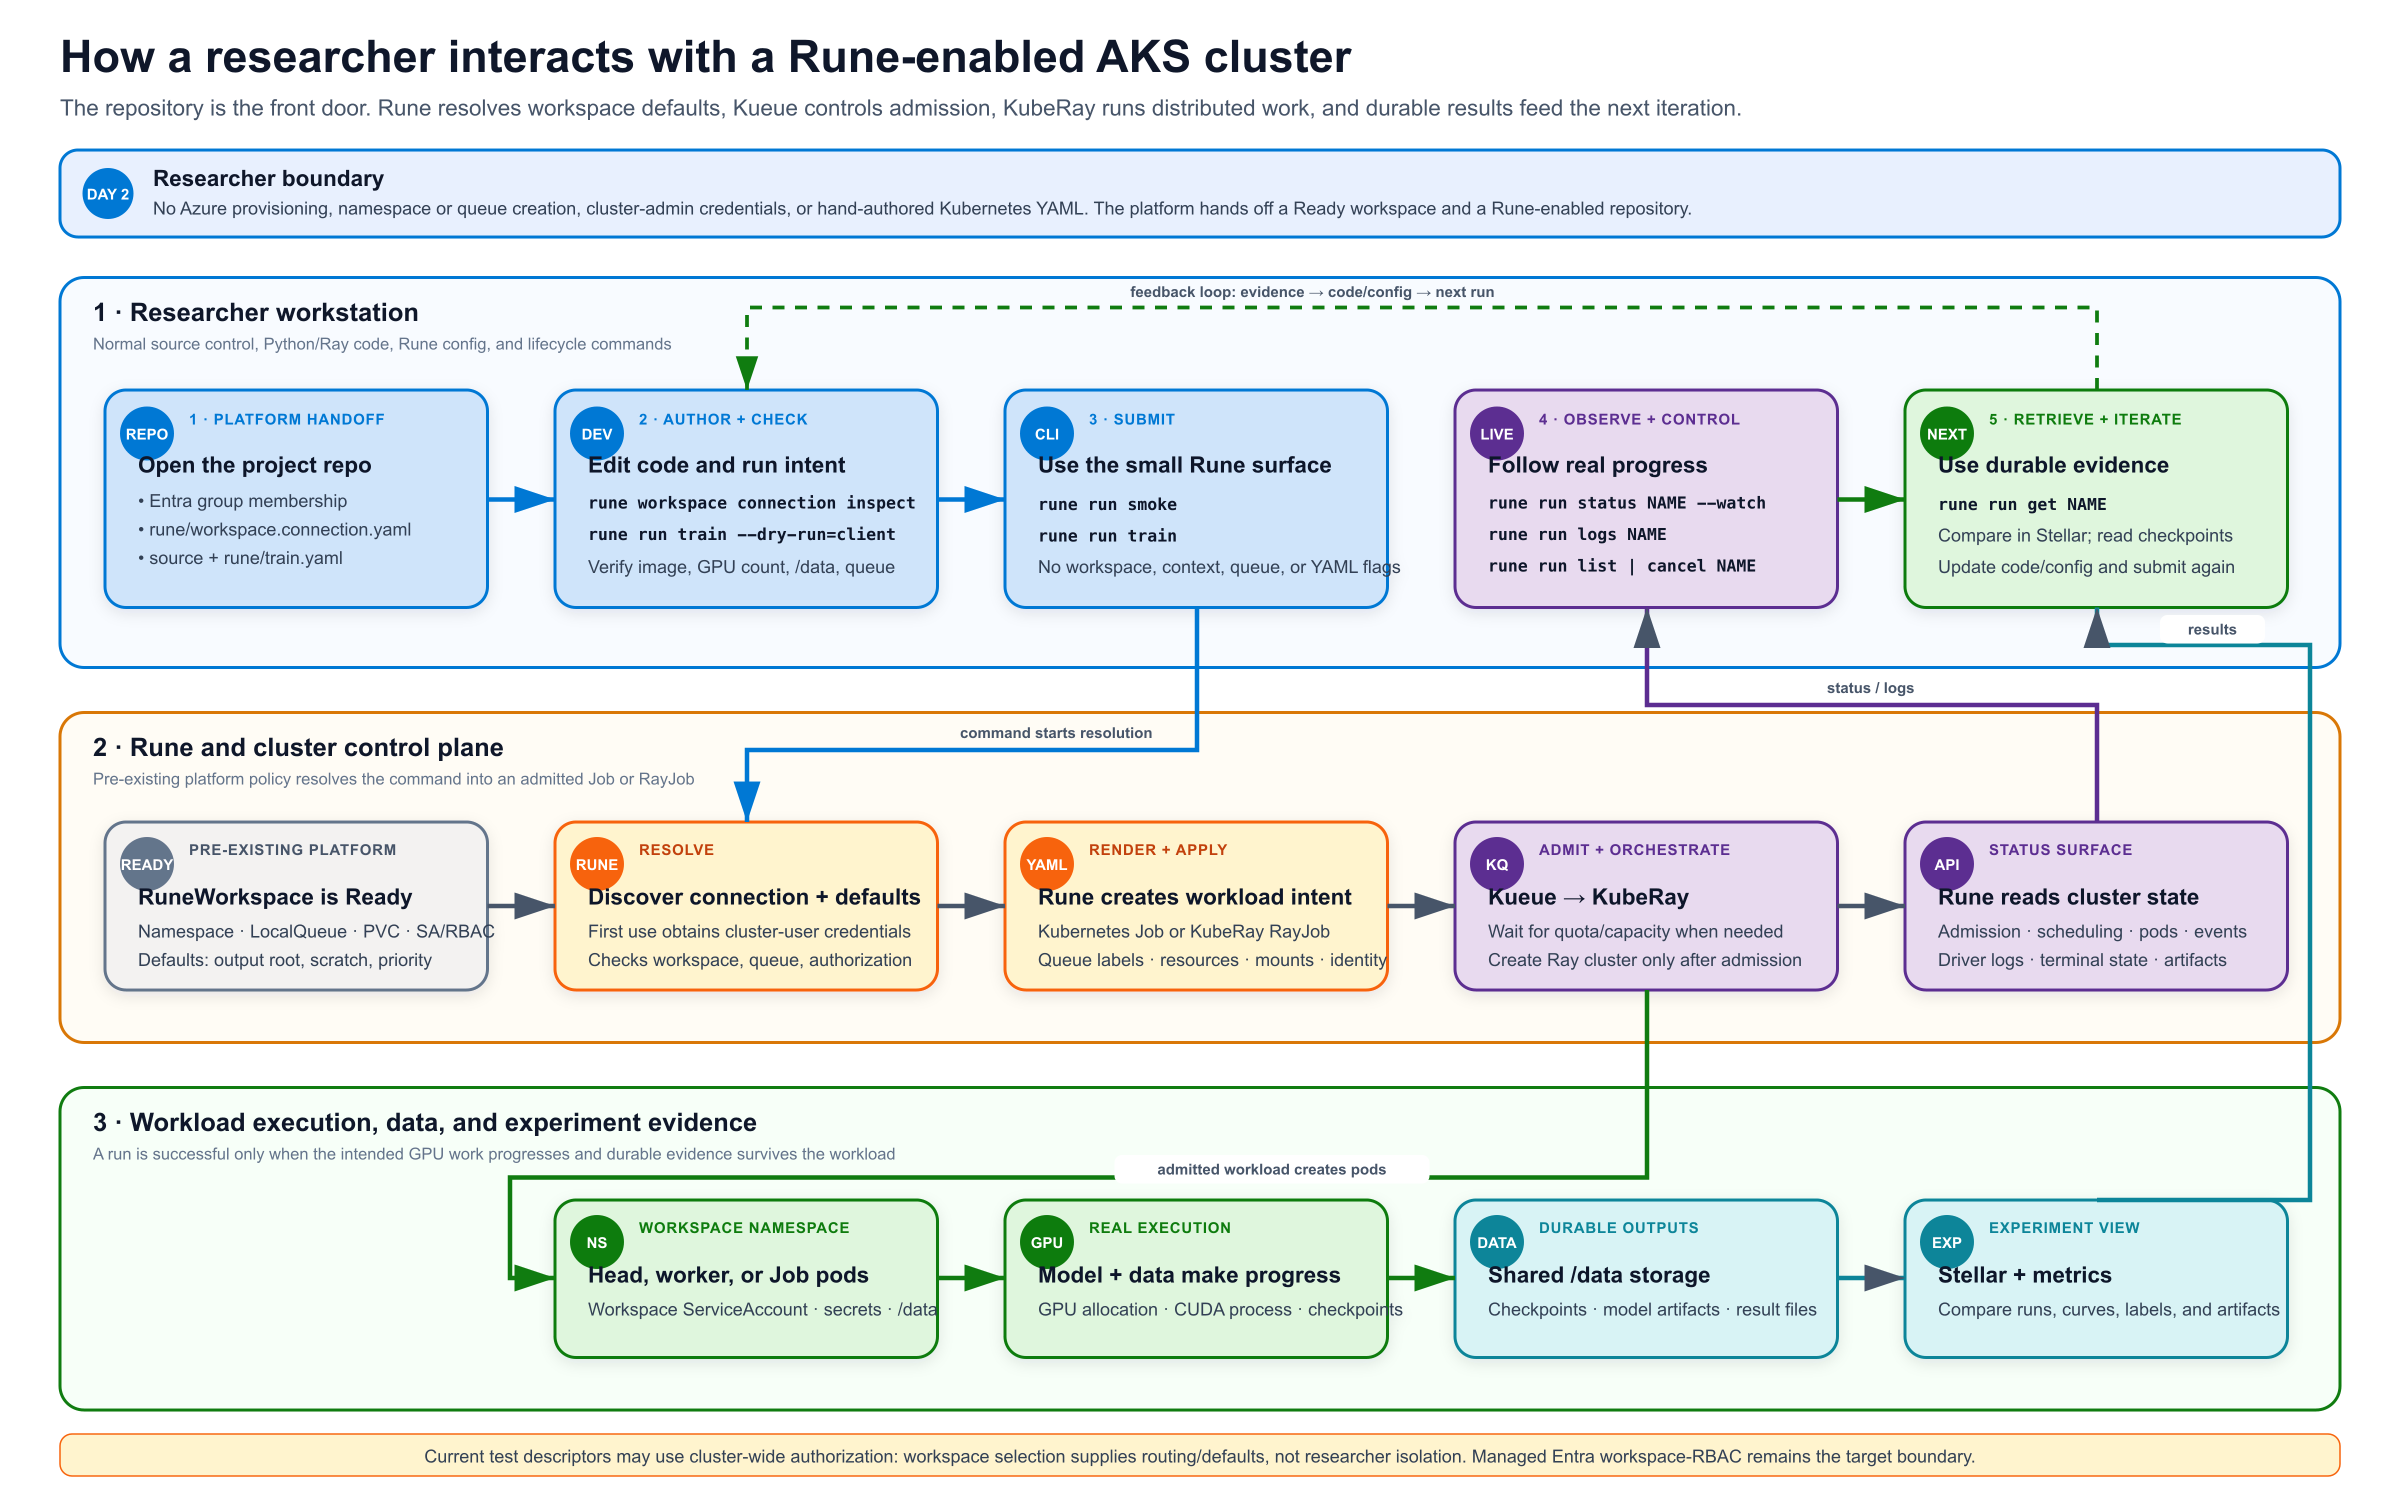
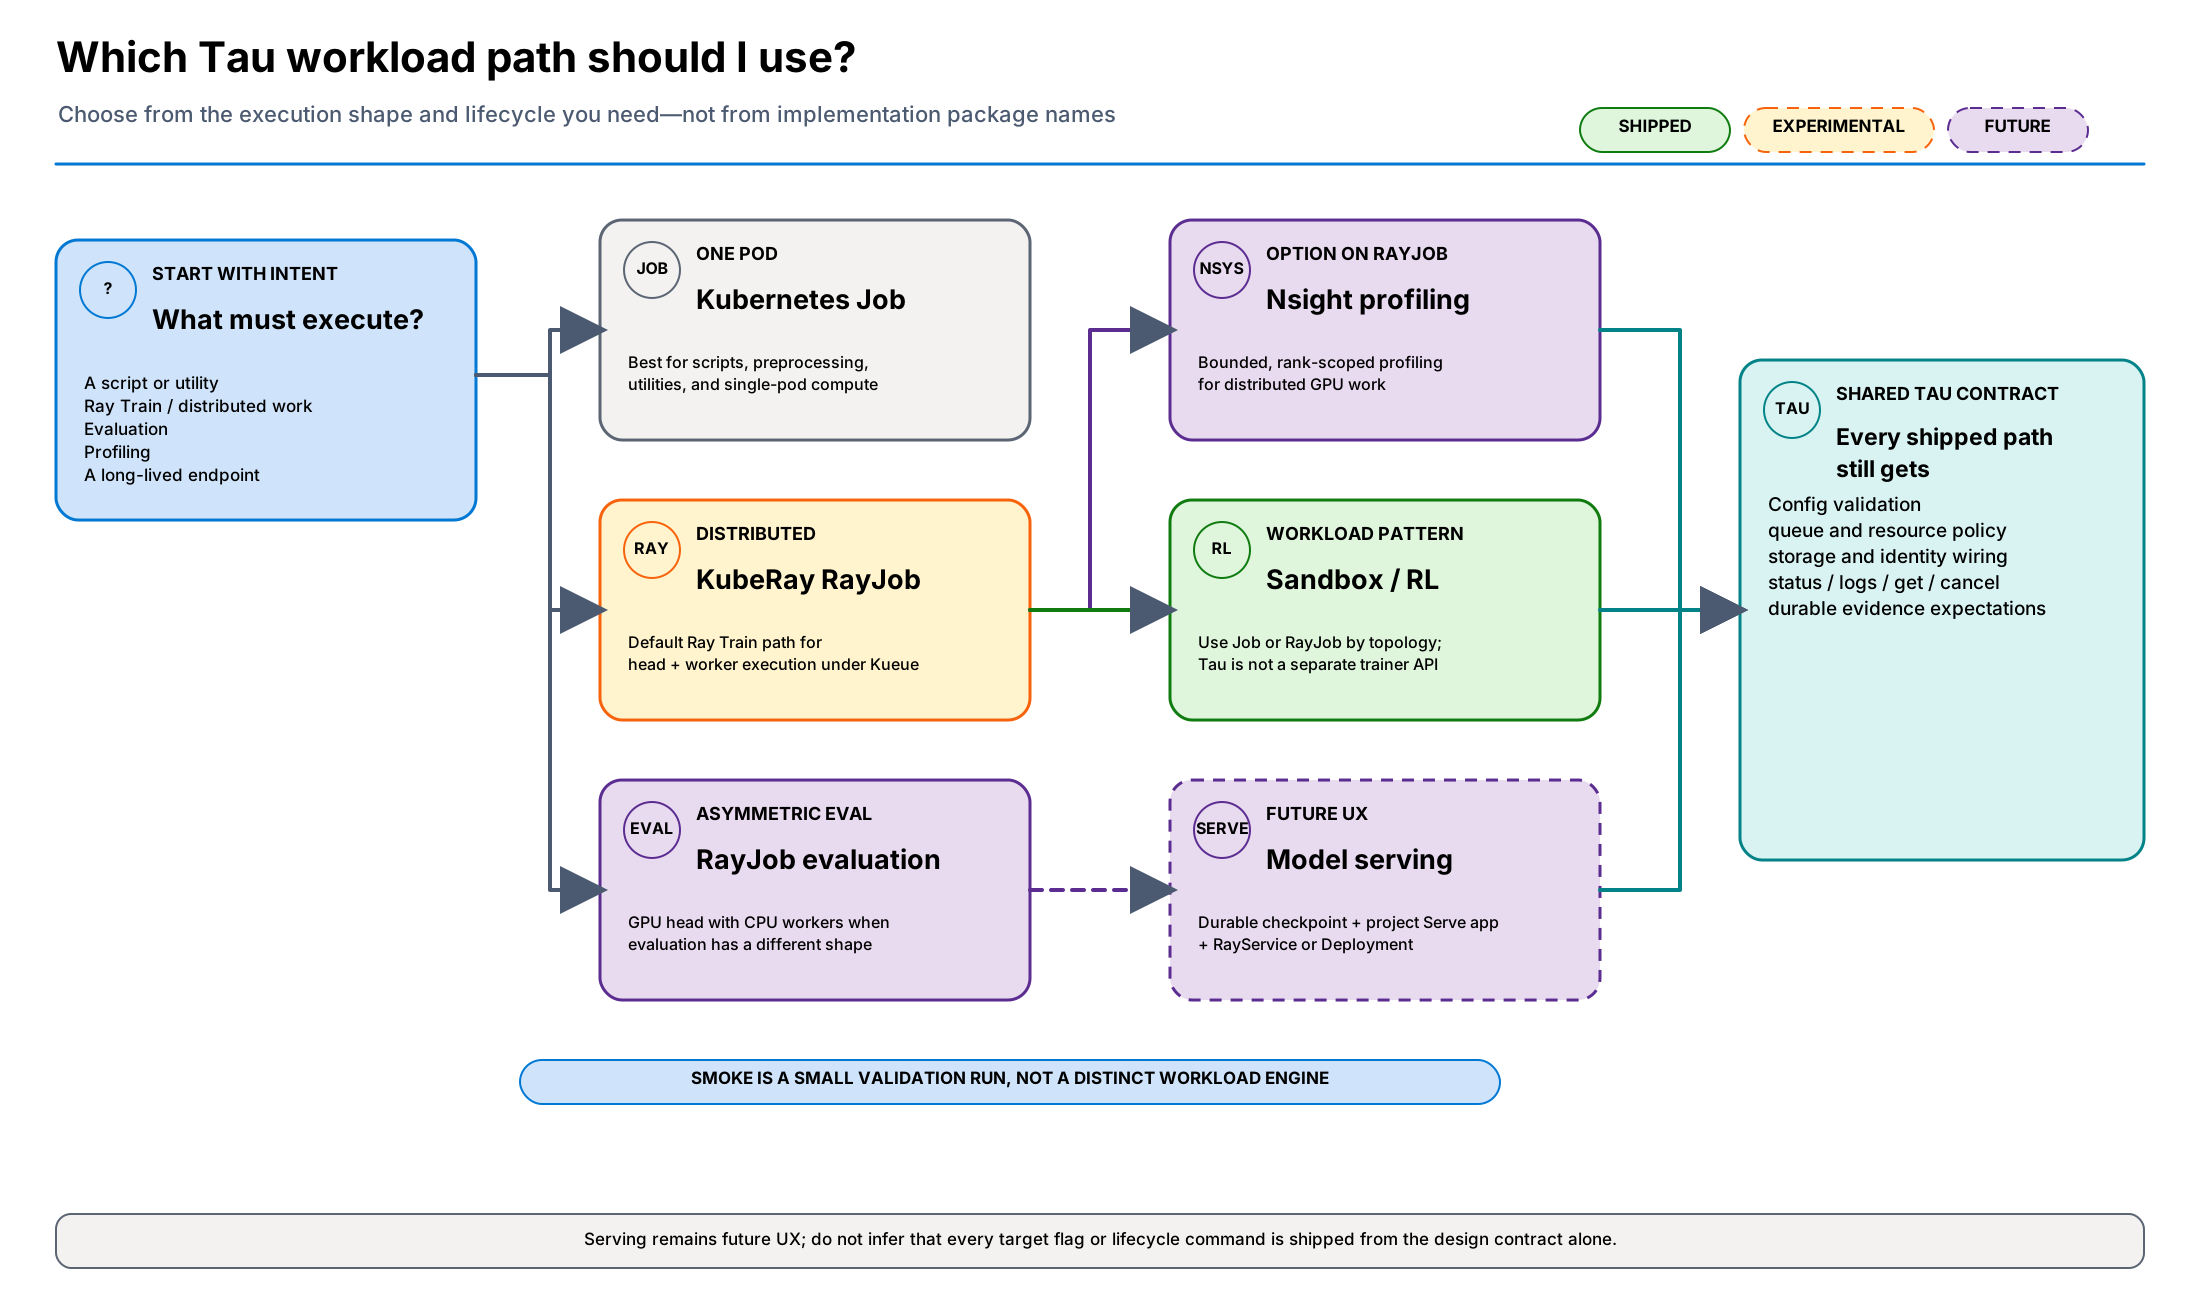
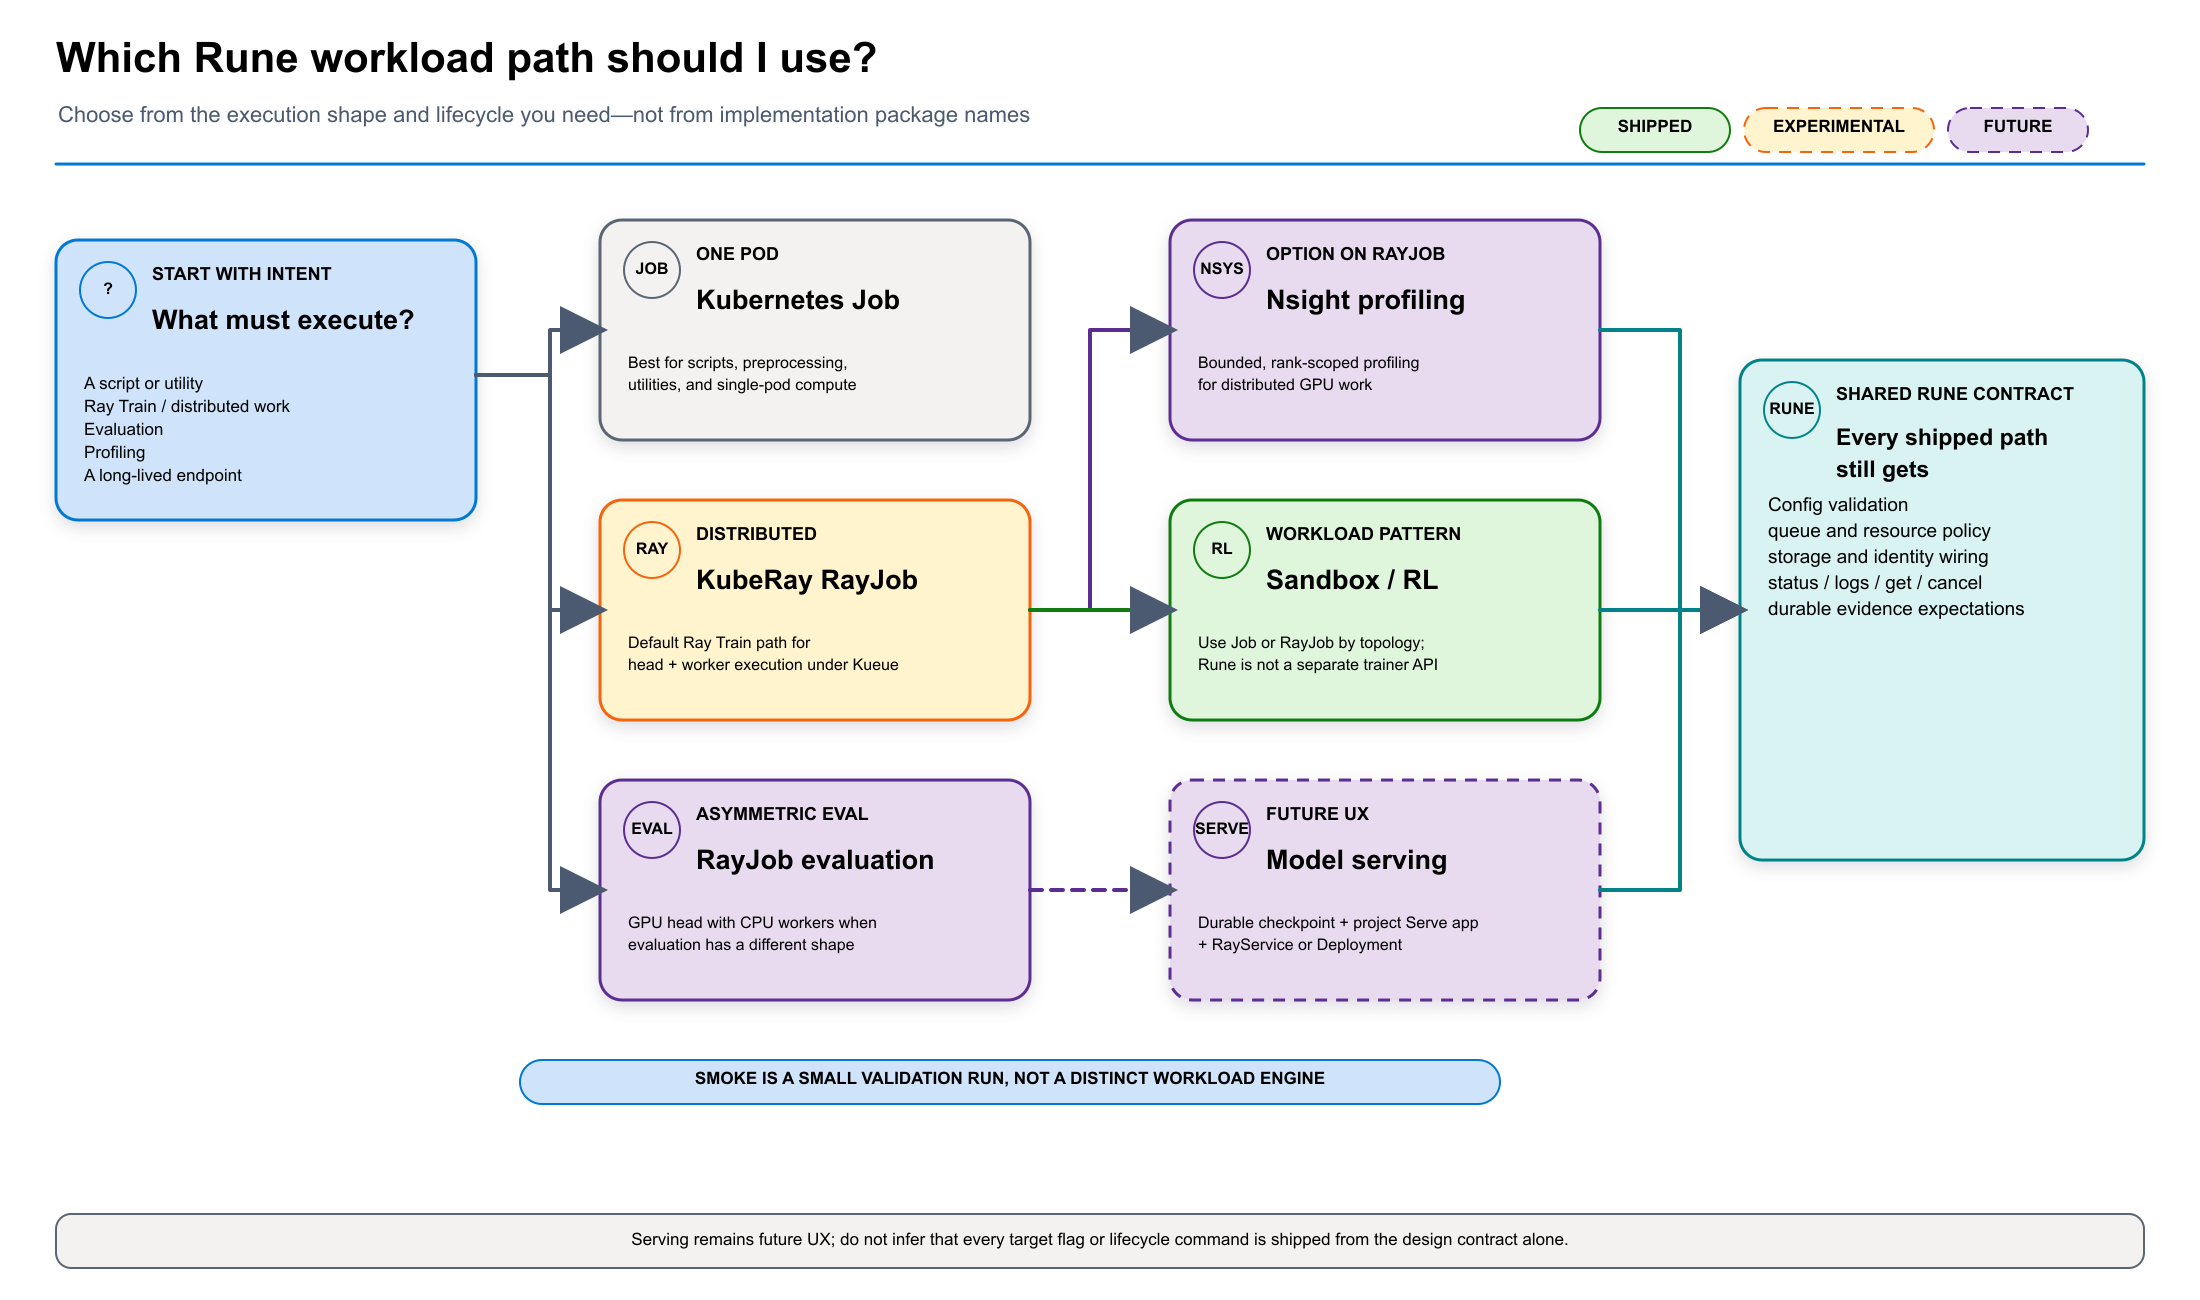
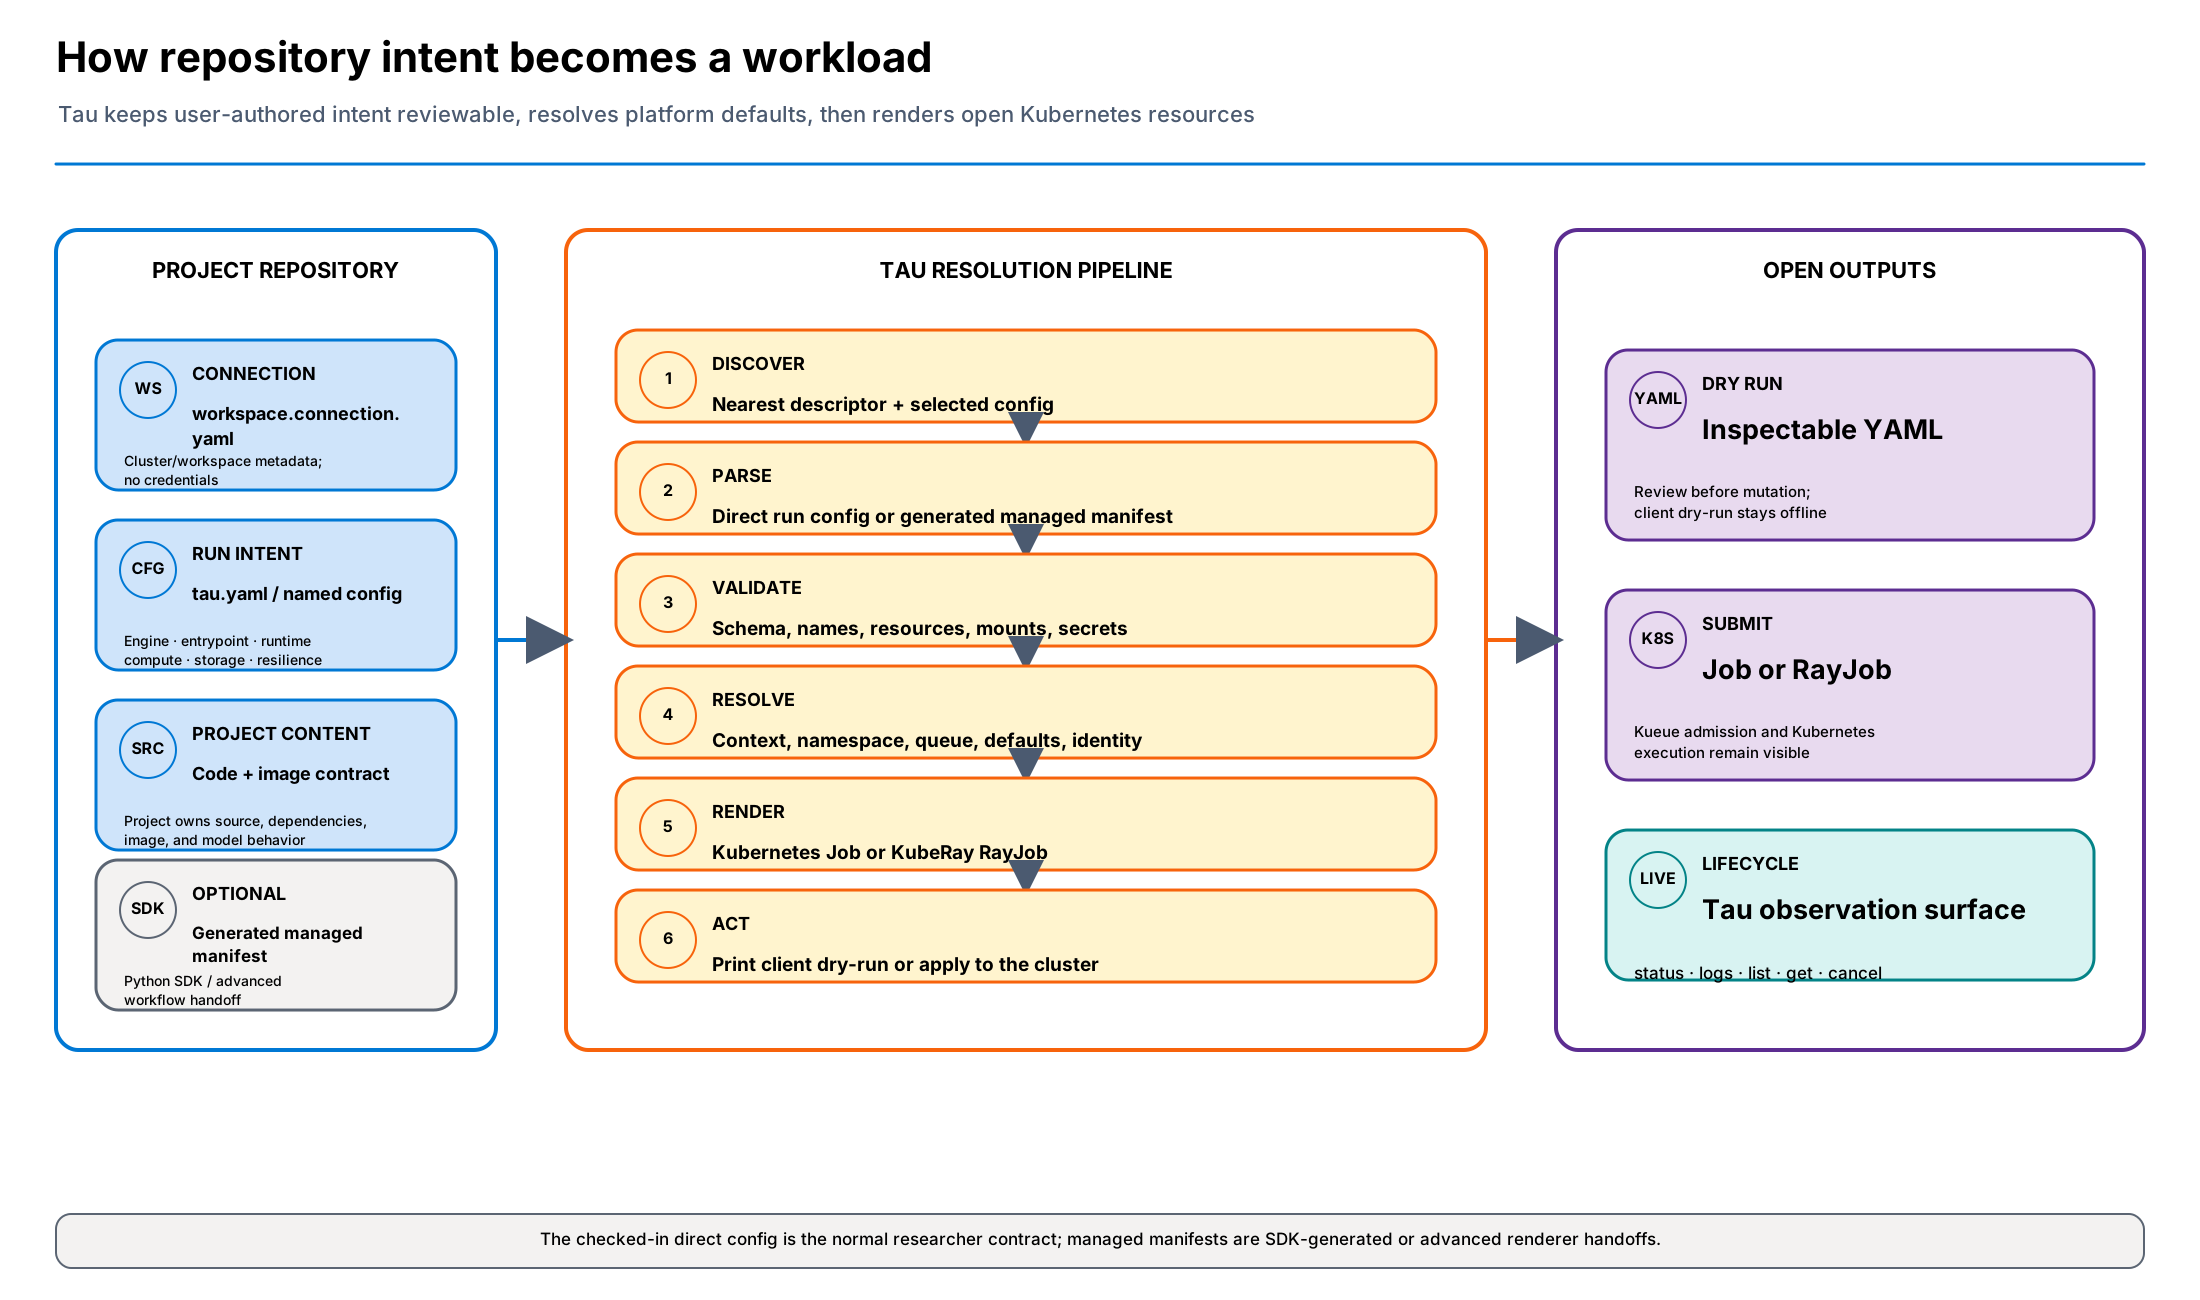
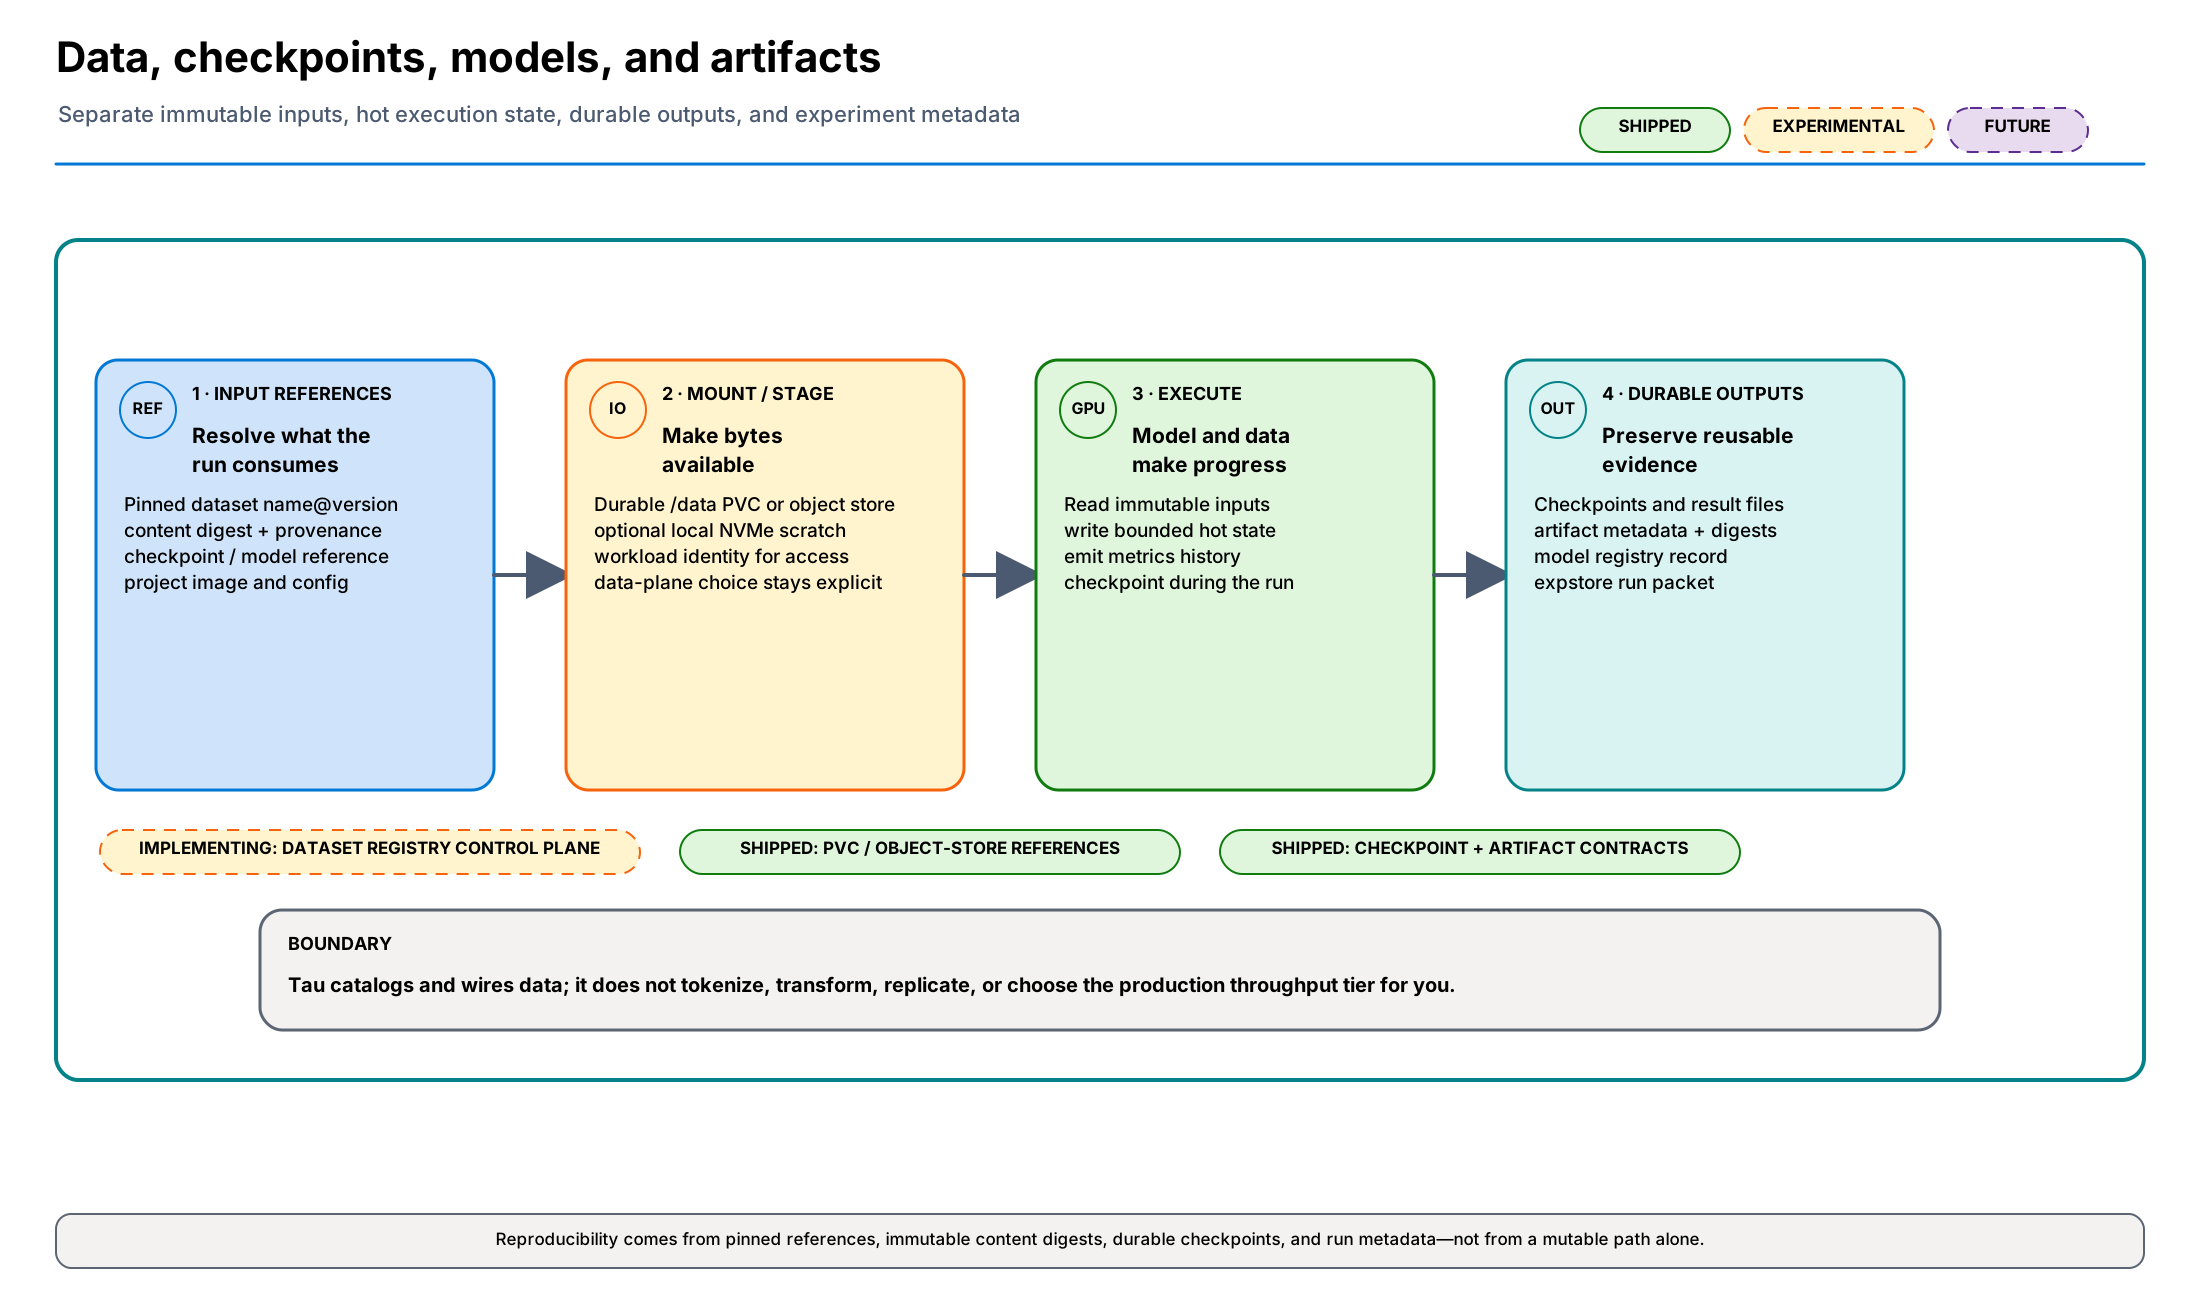
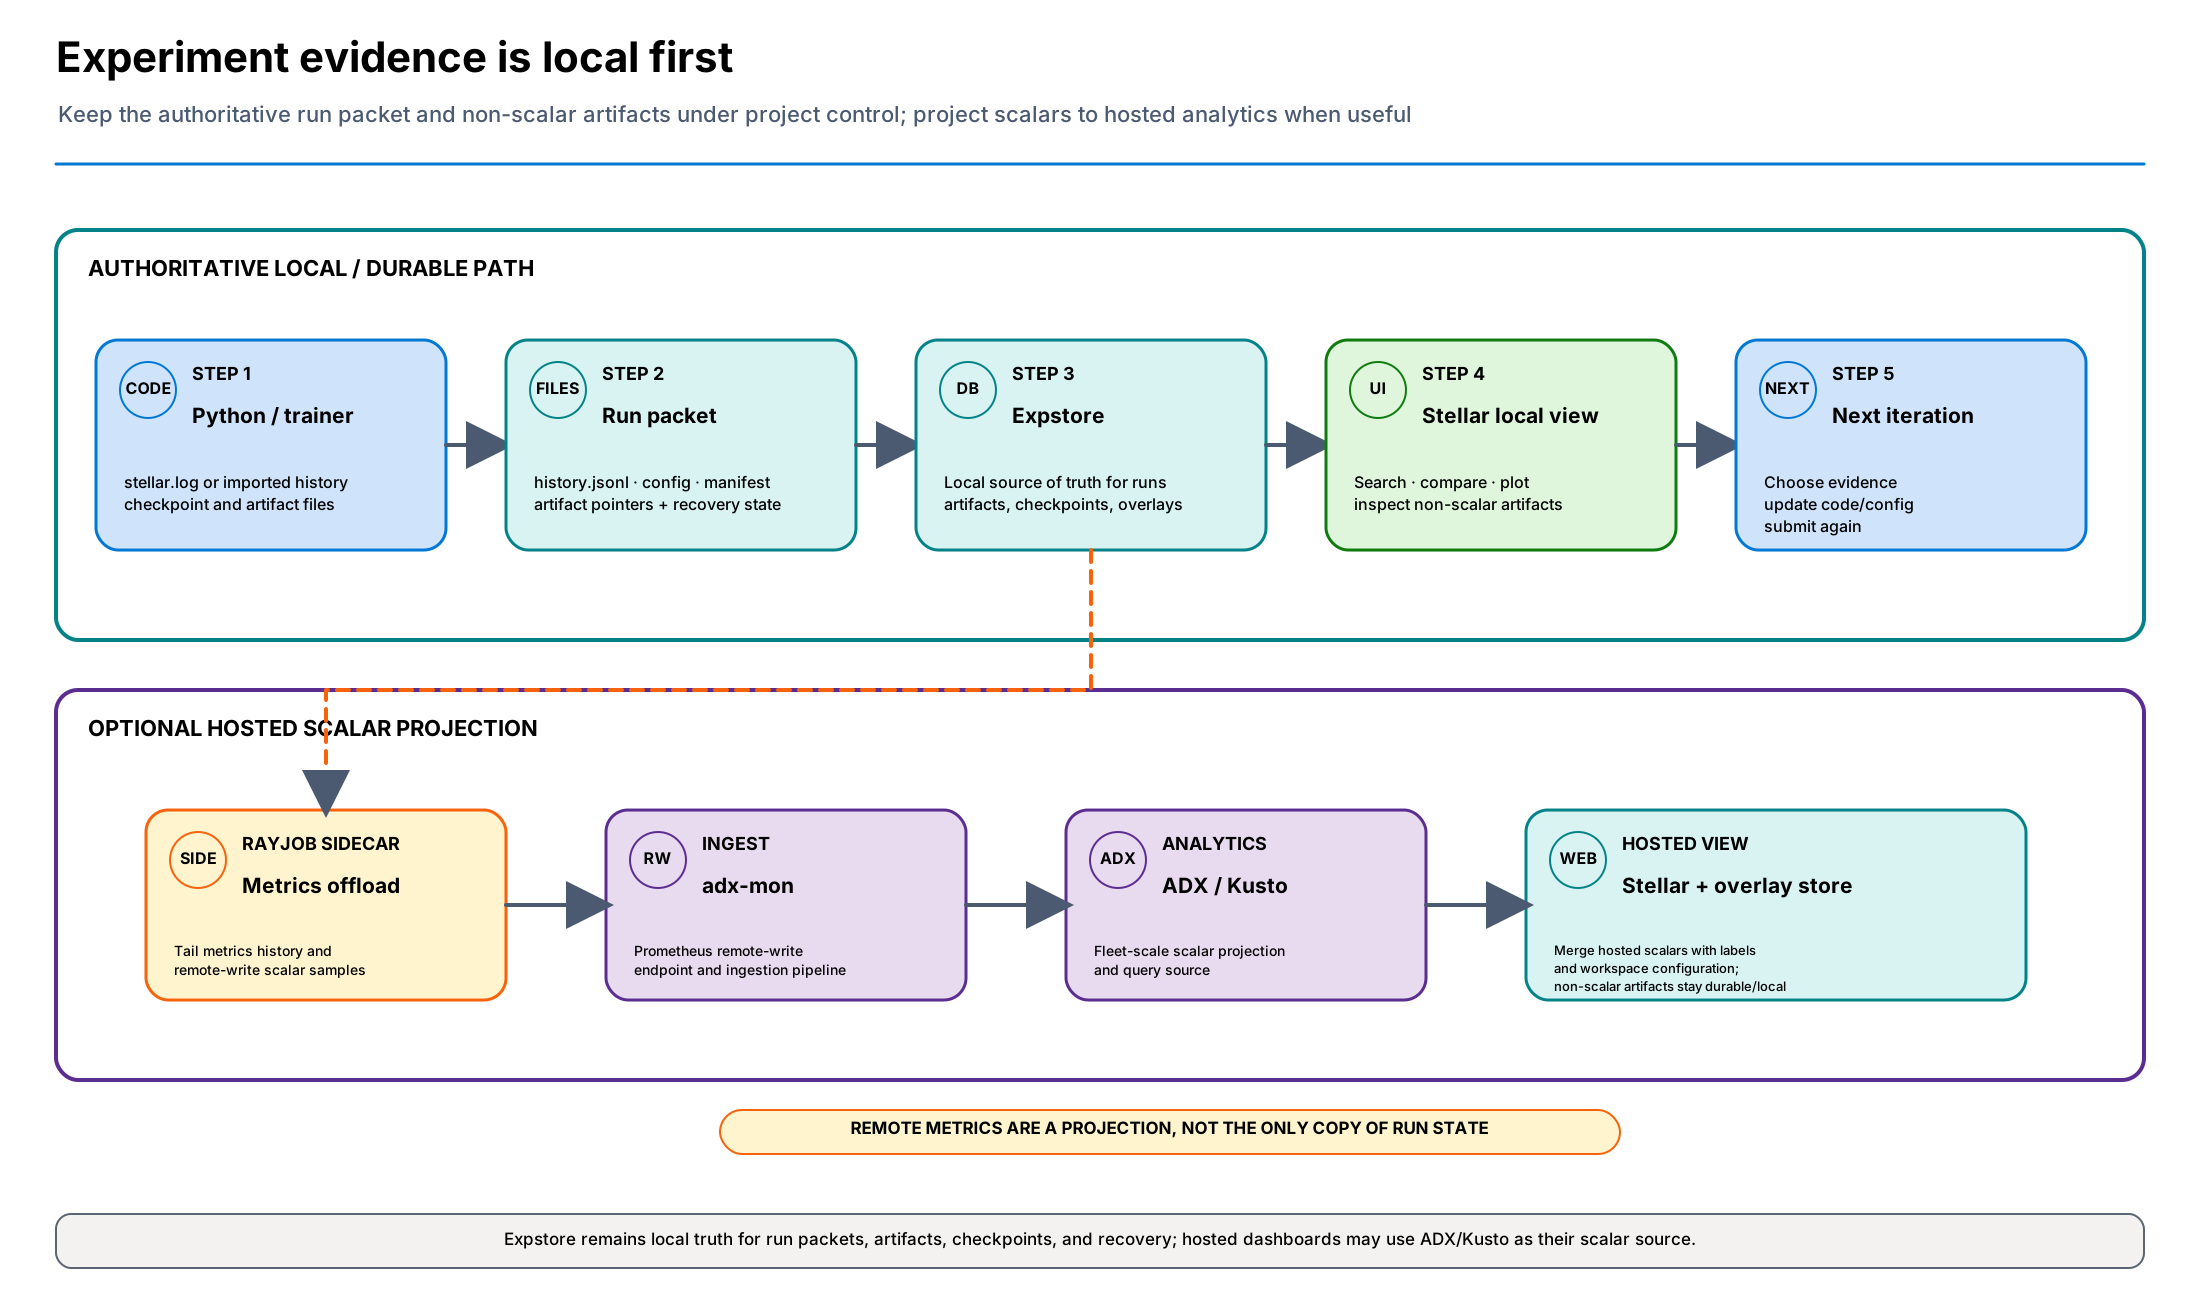
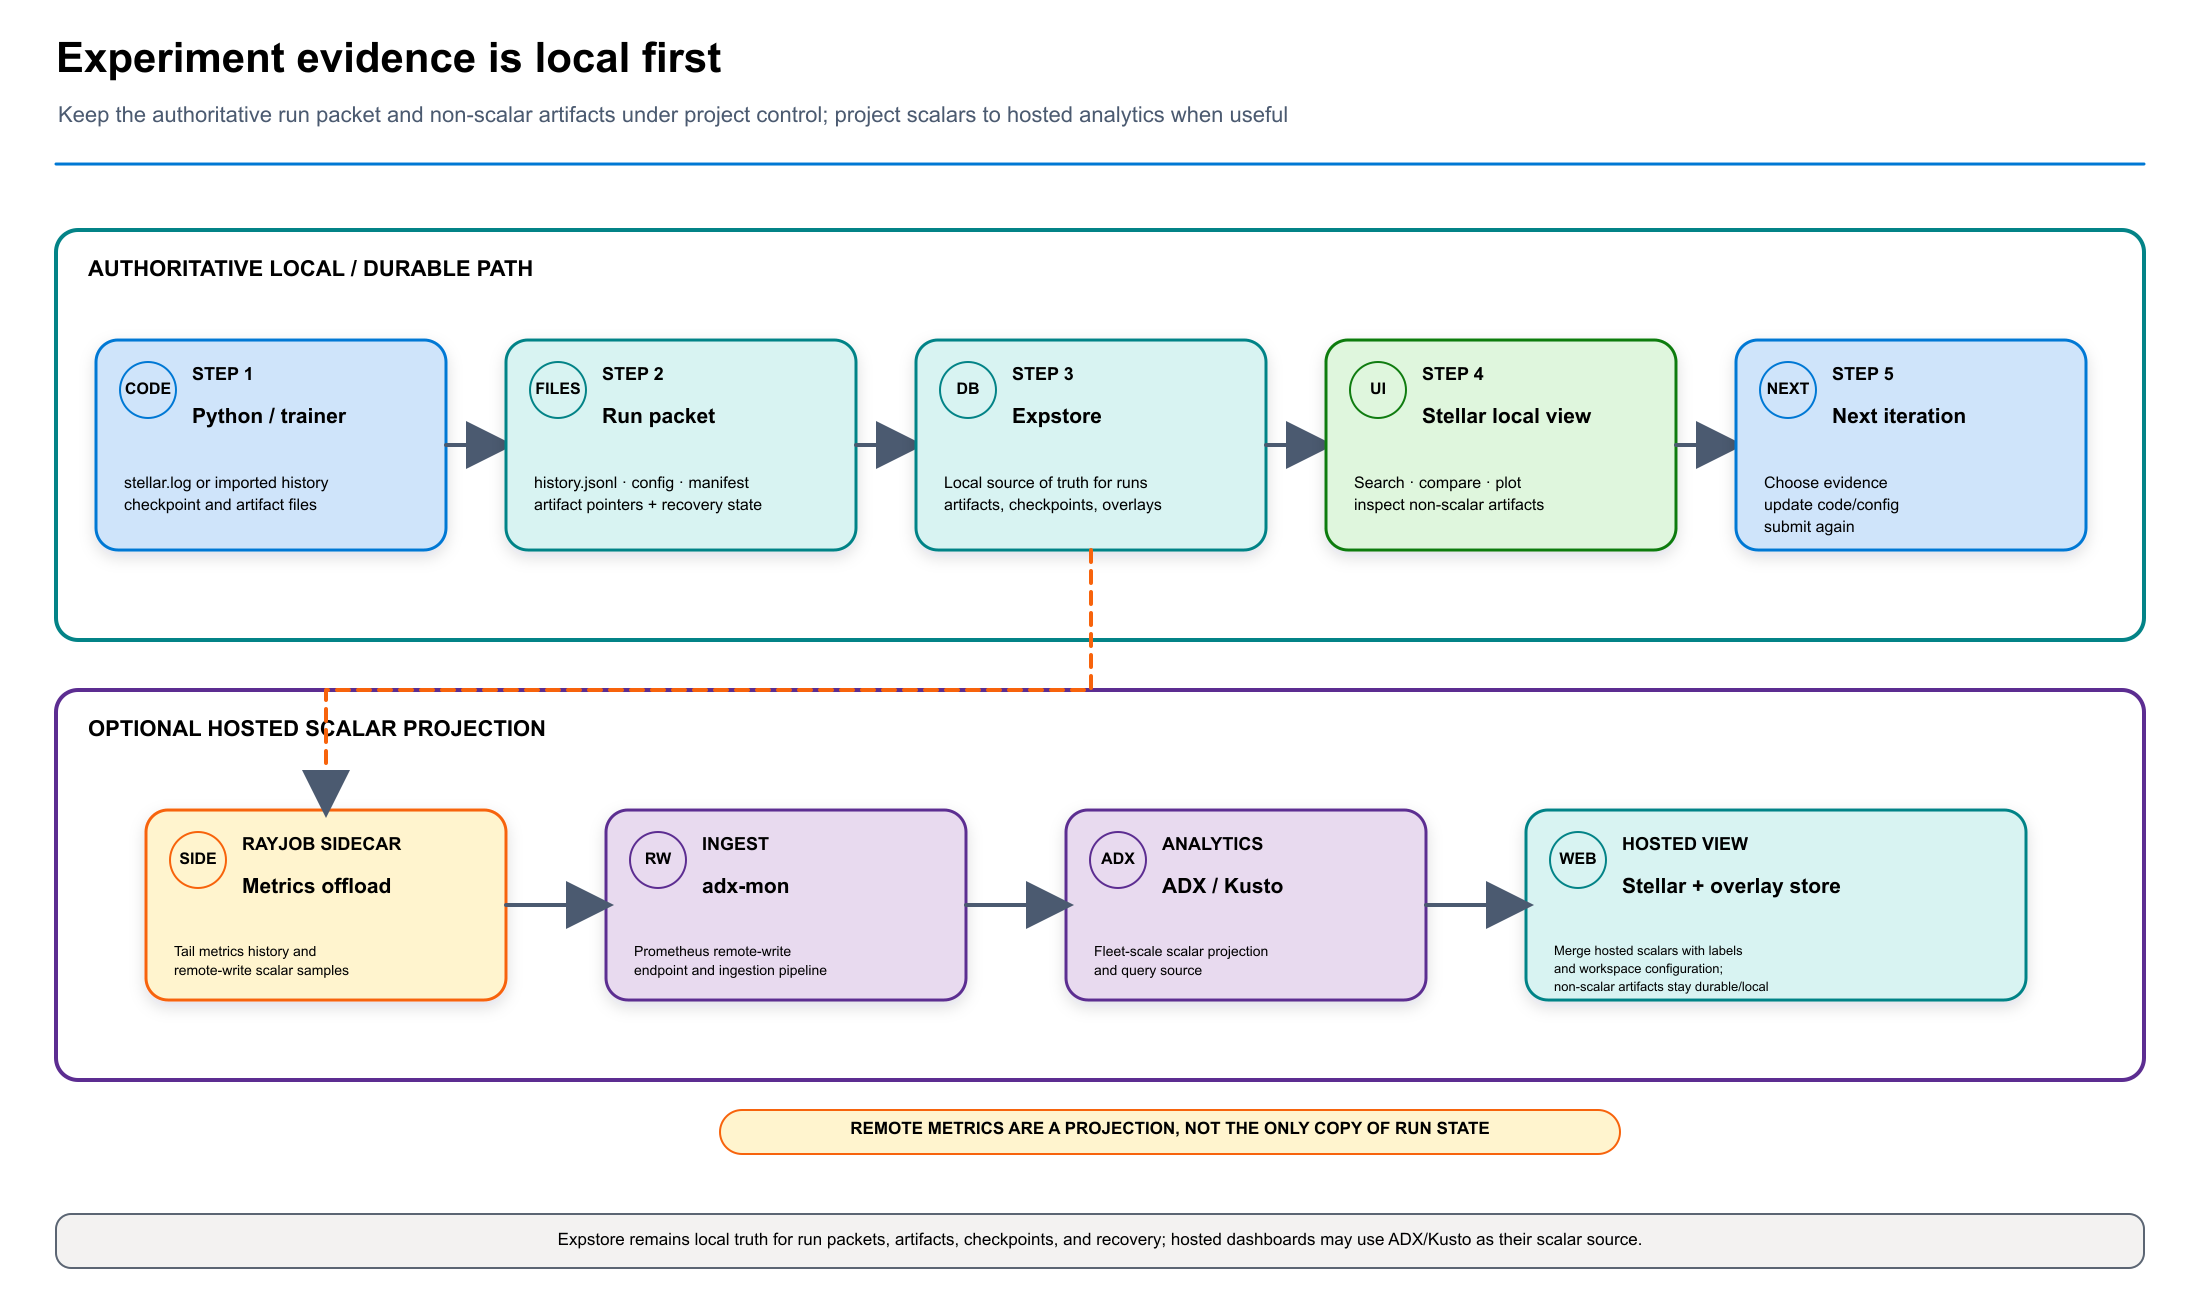
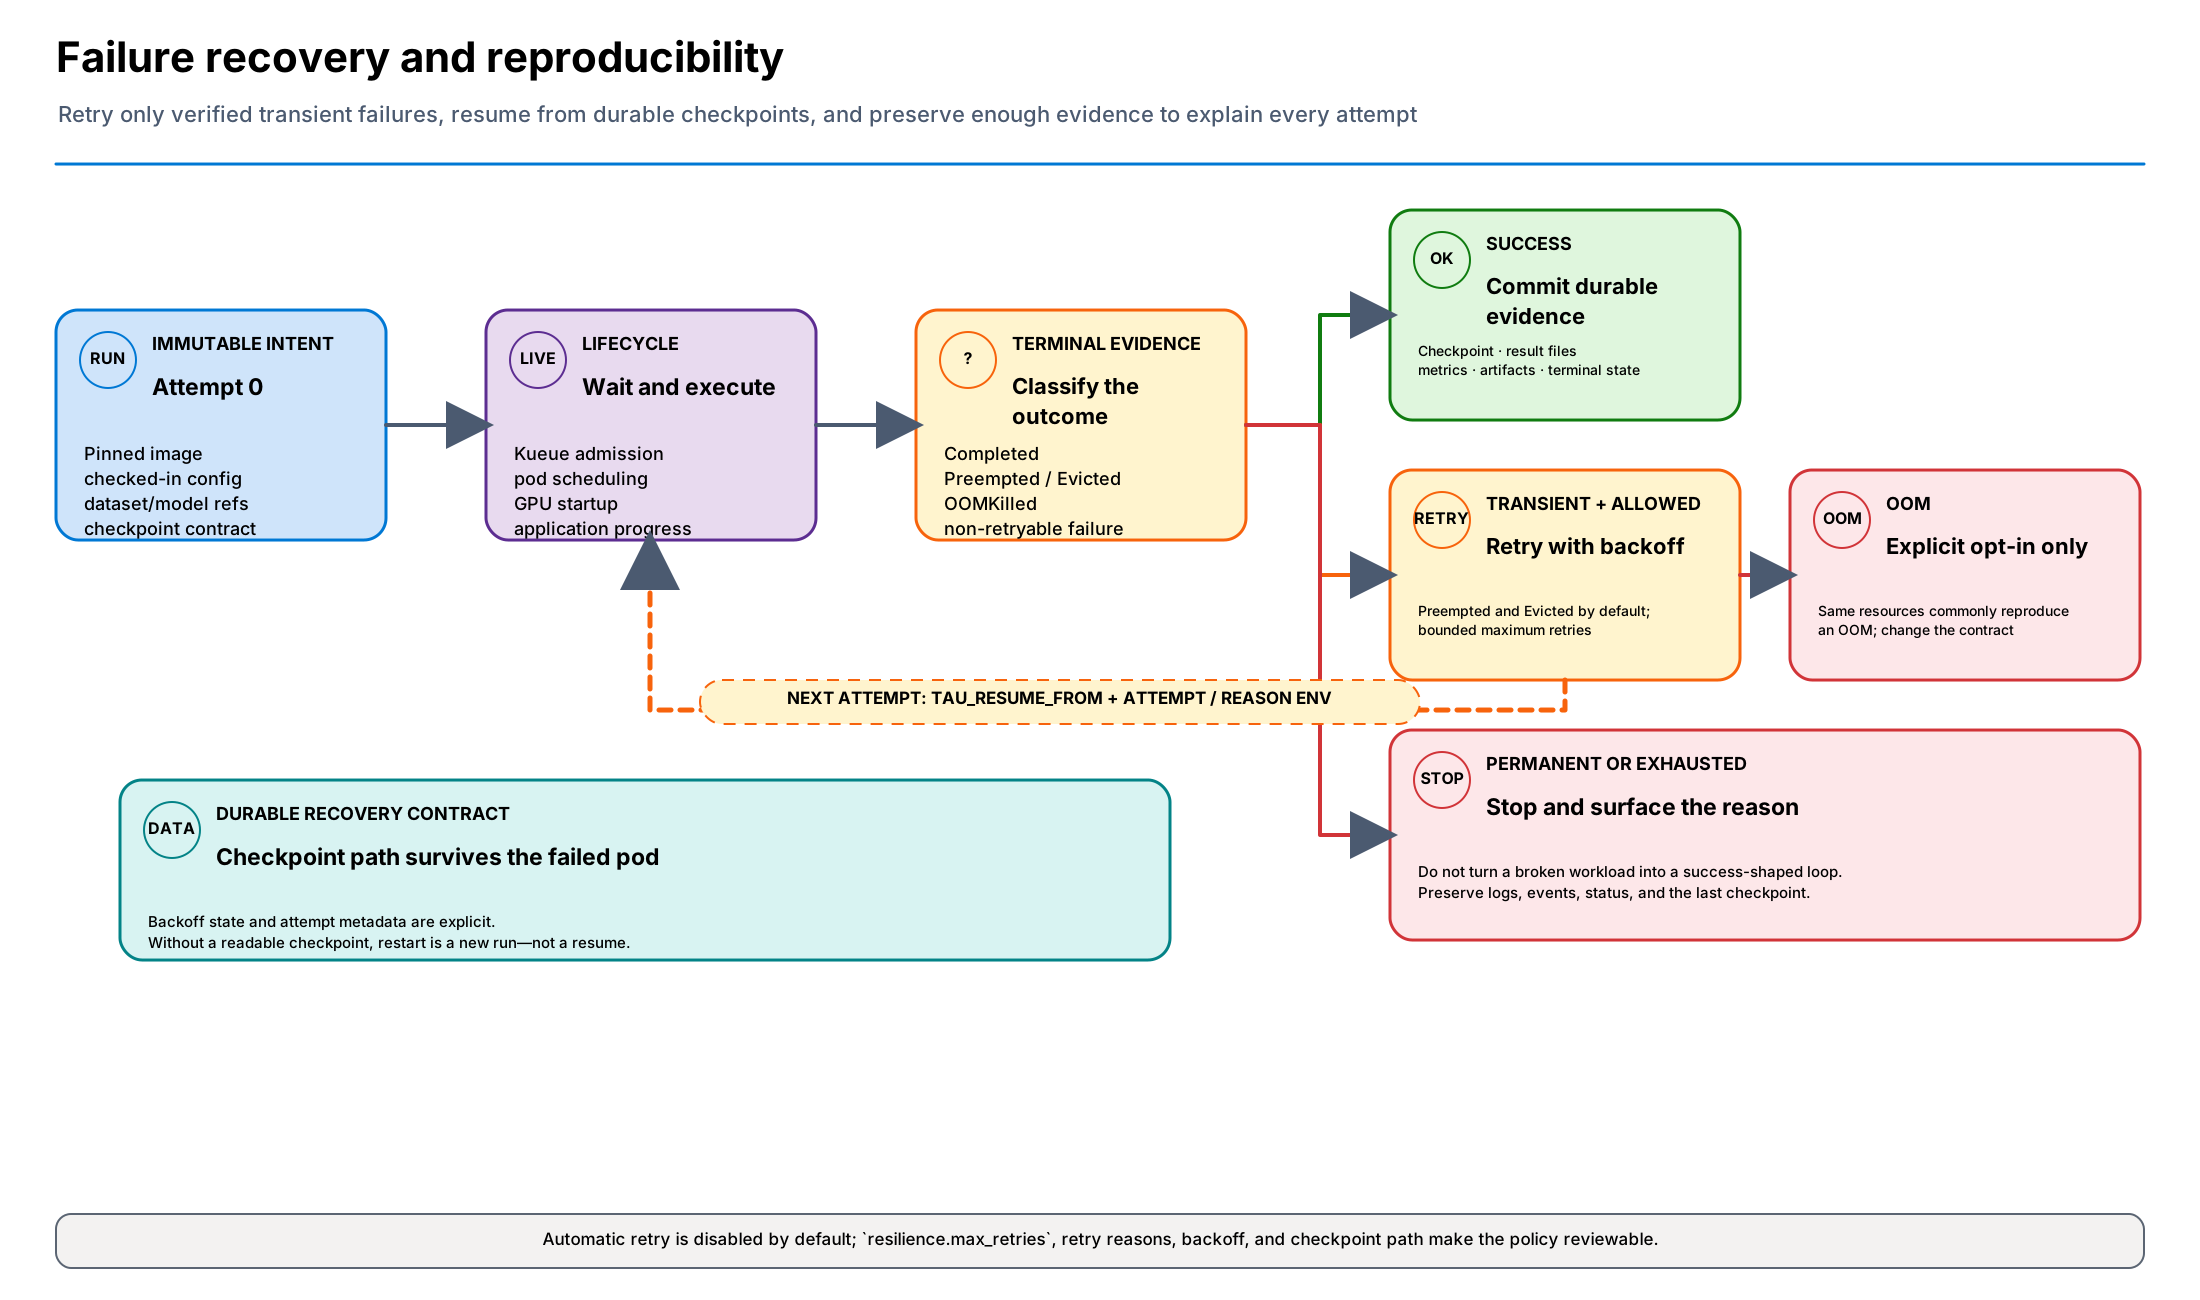
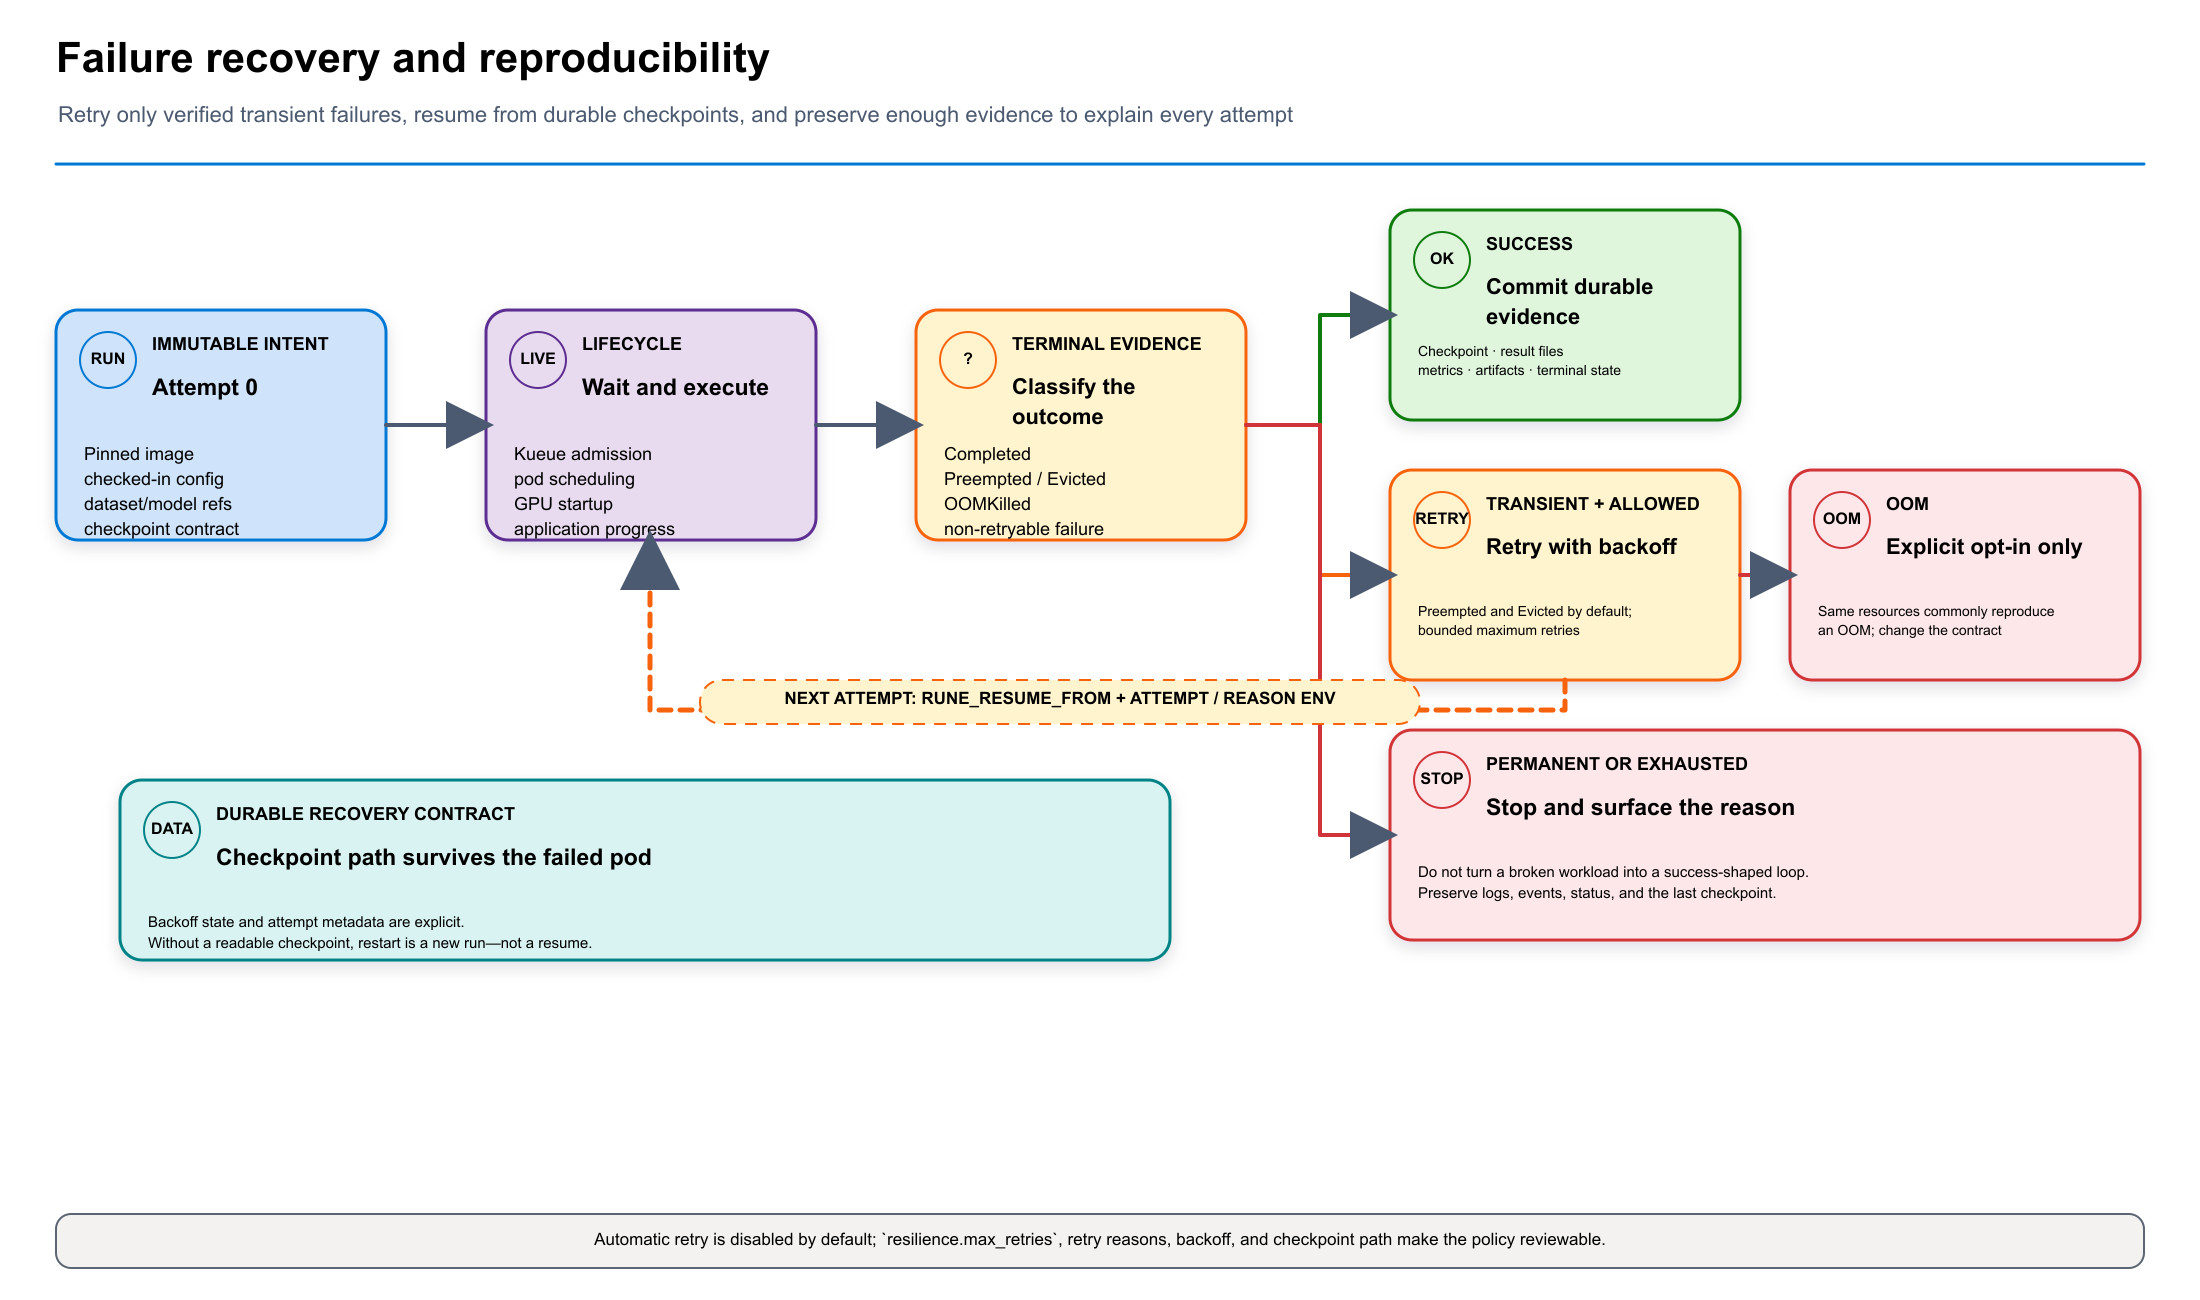
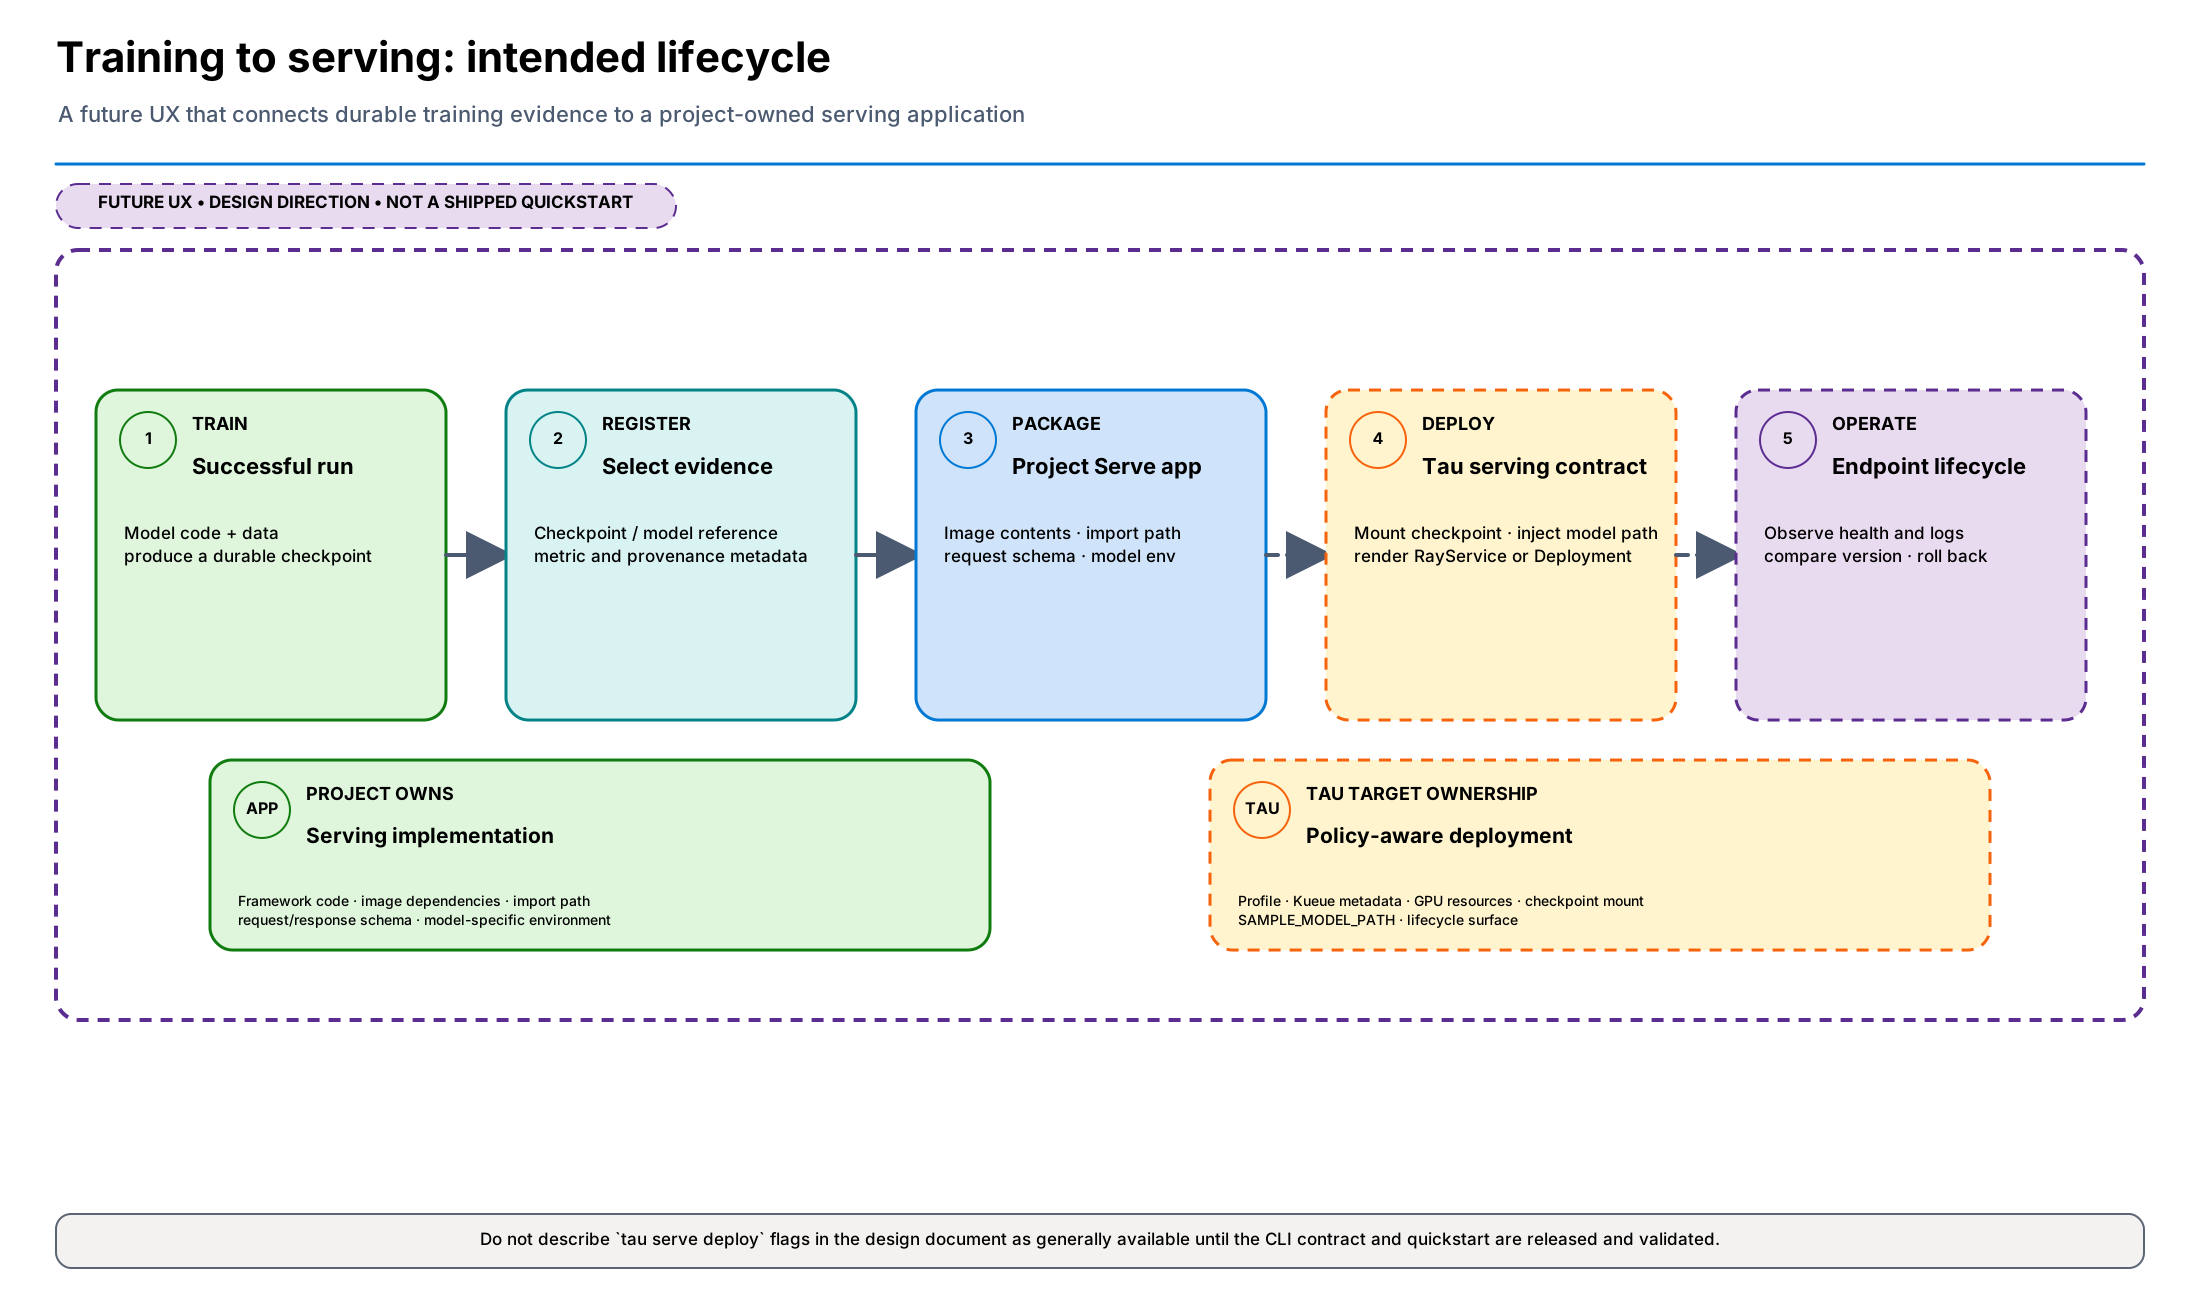
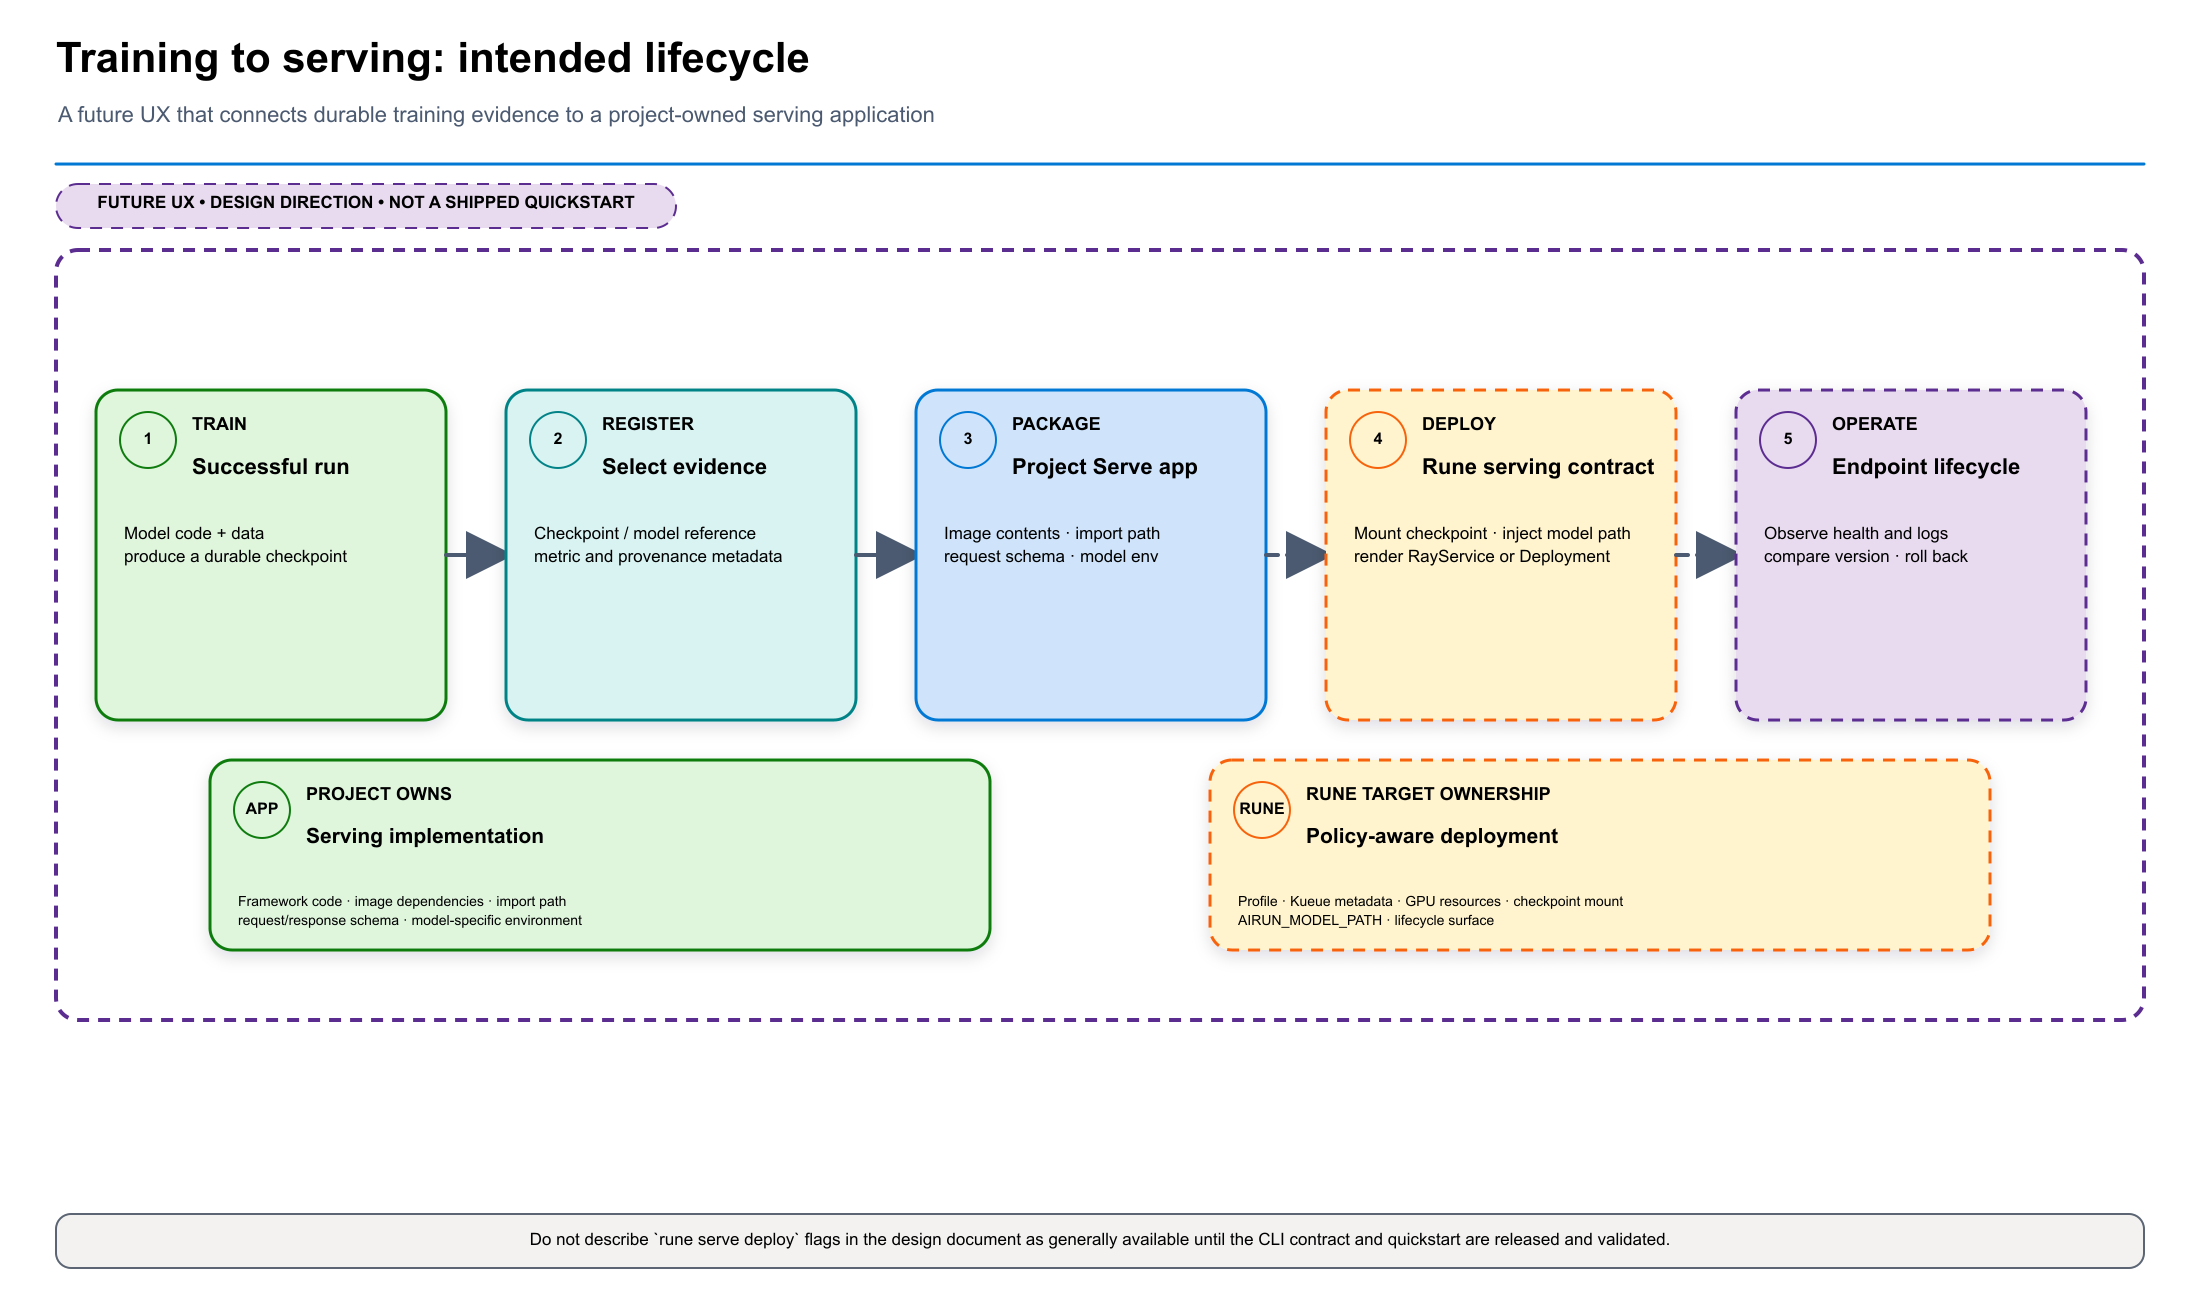
Operate TauGrid
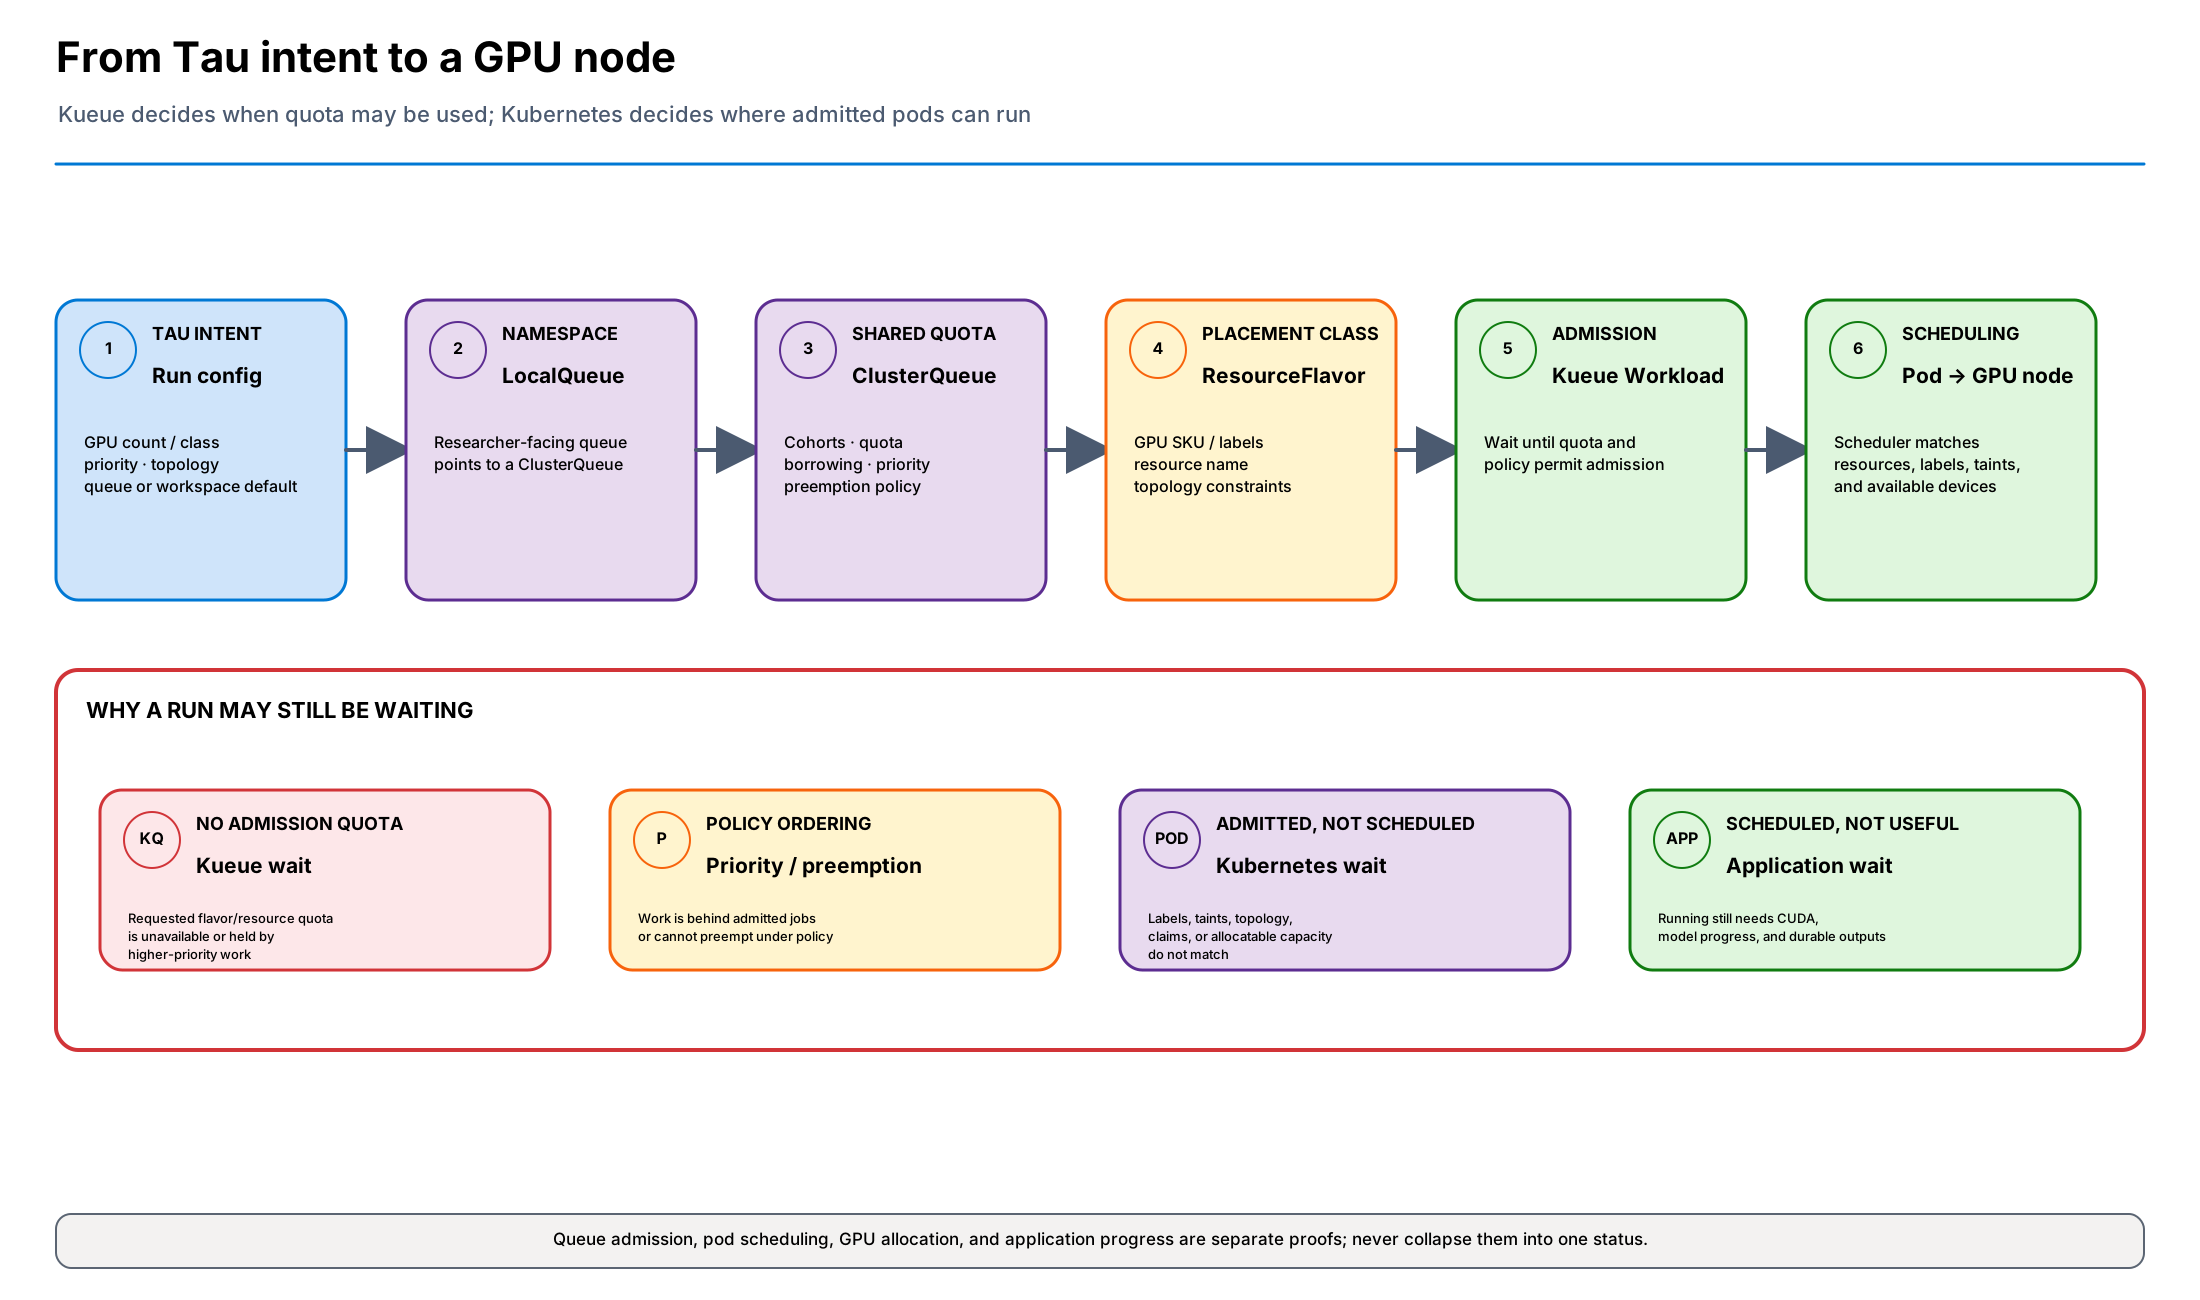
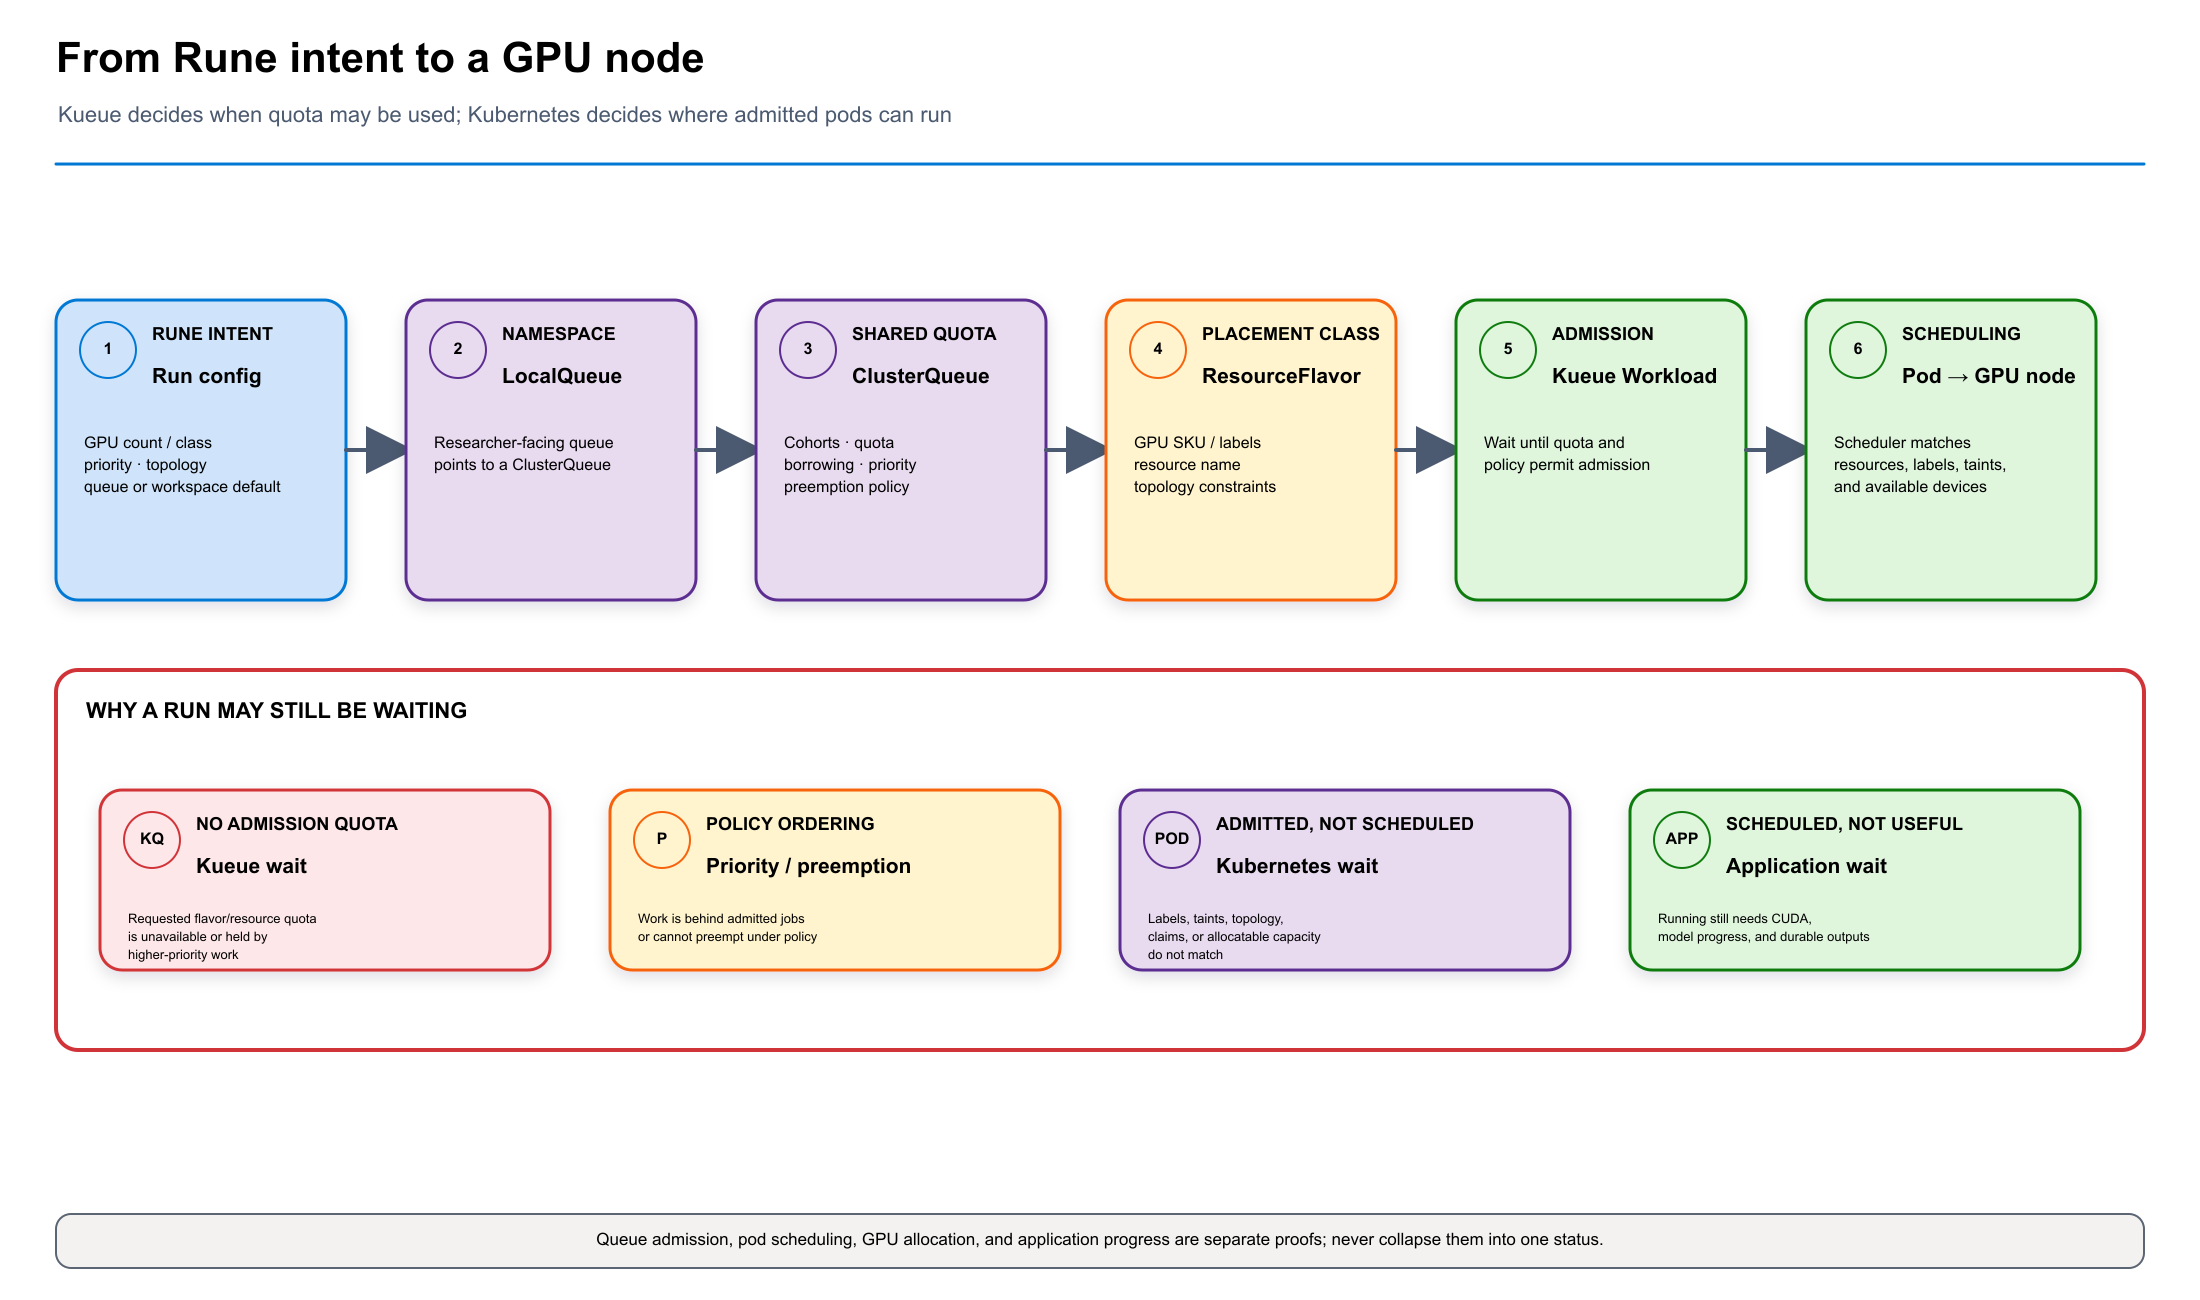
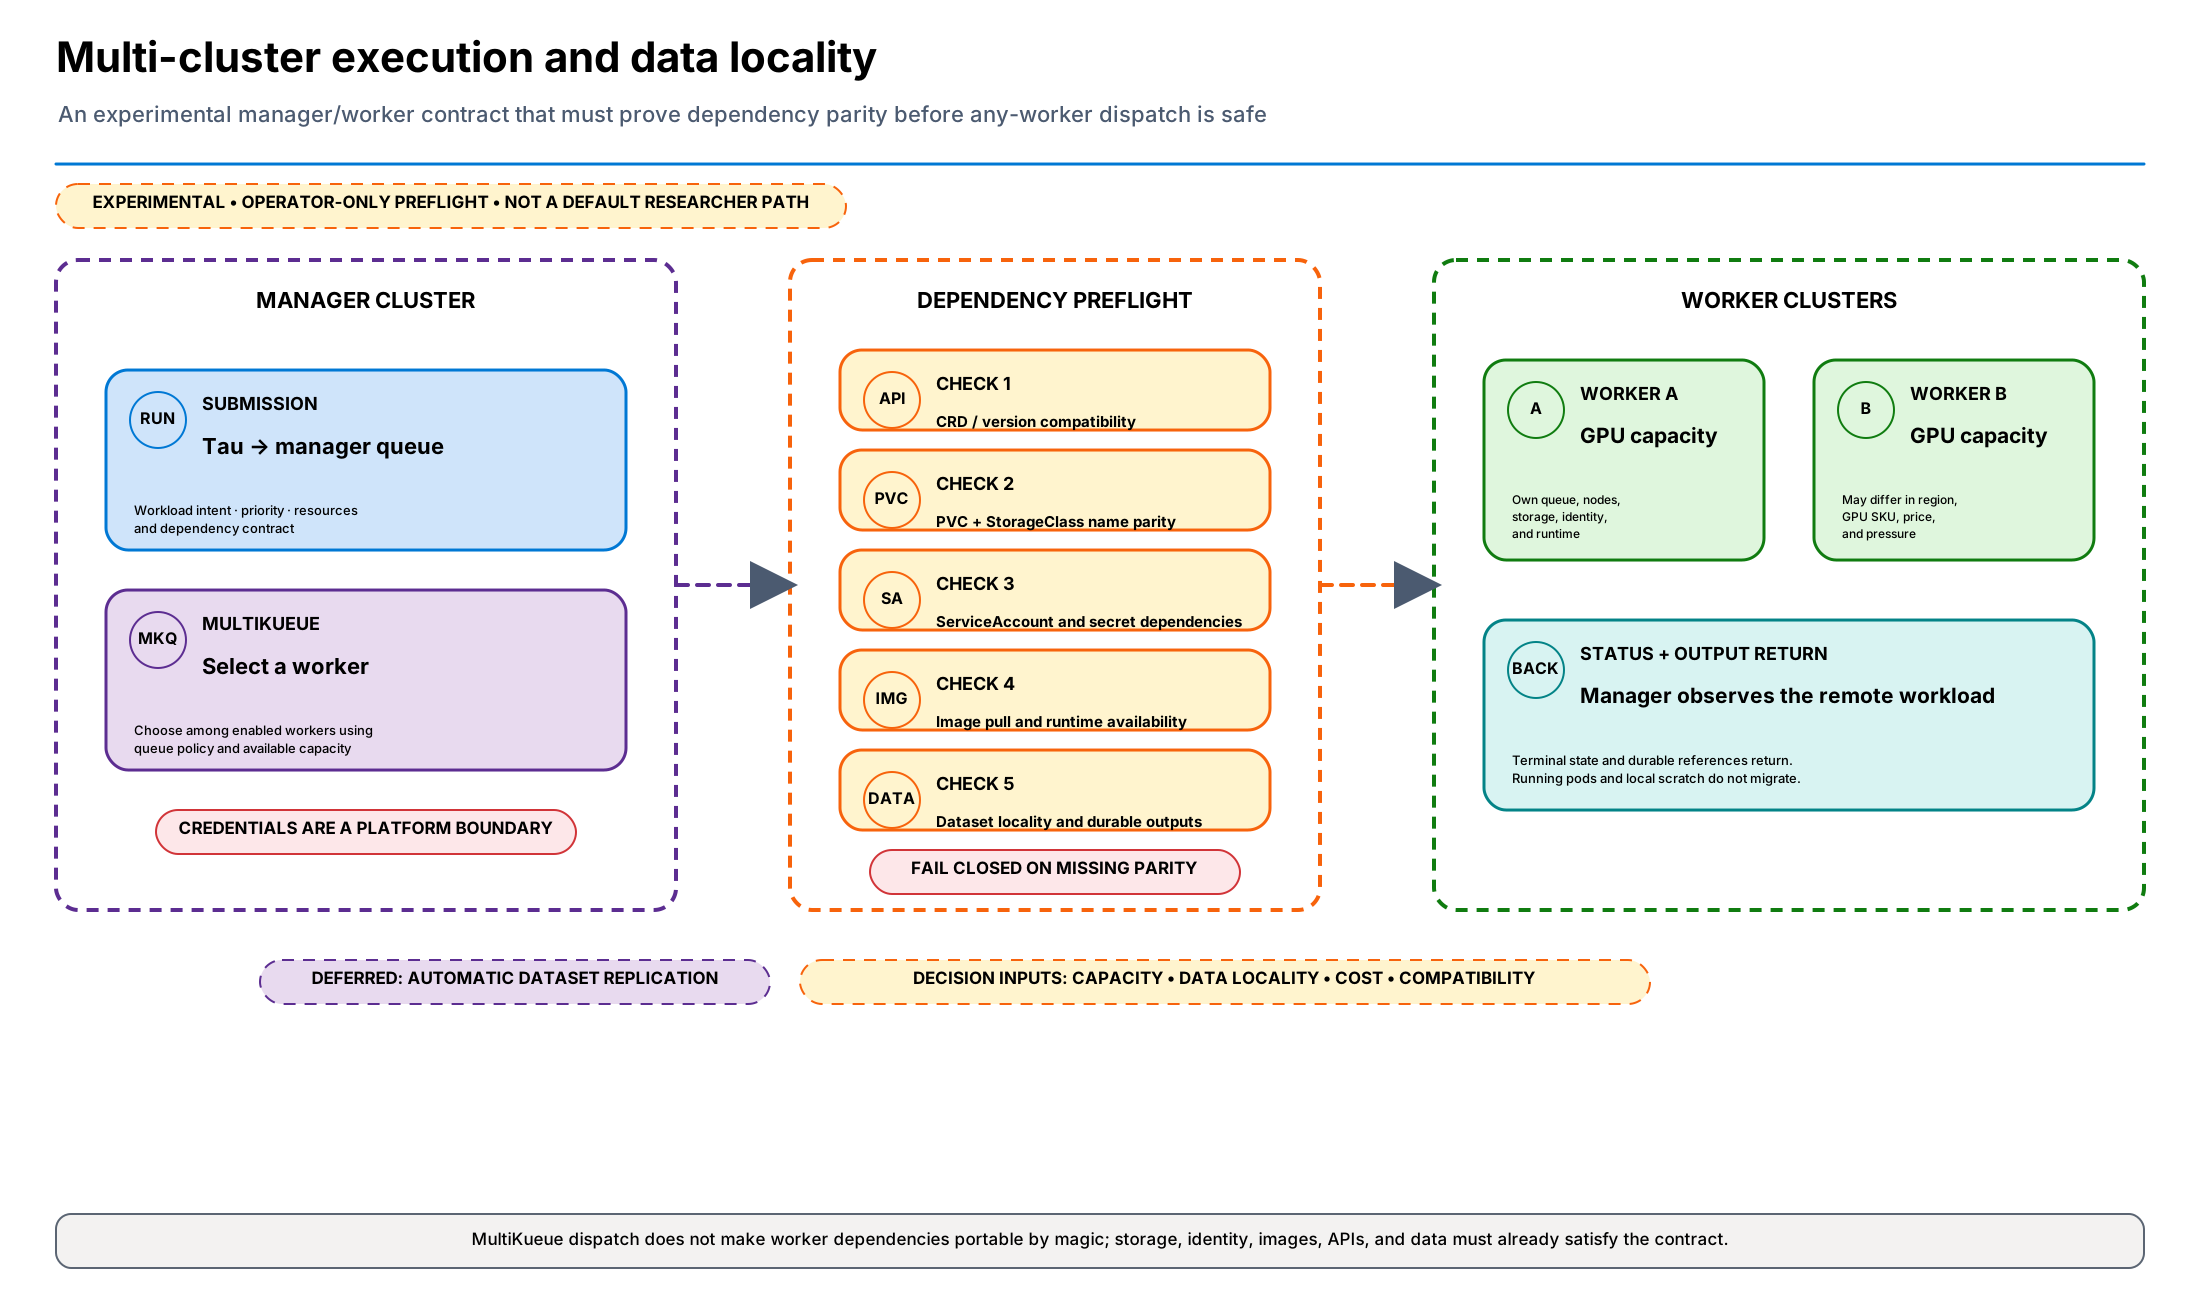
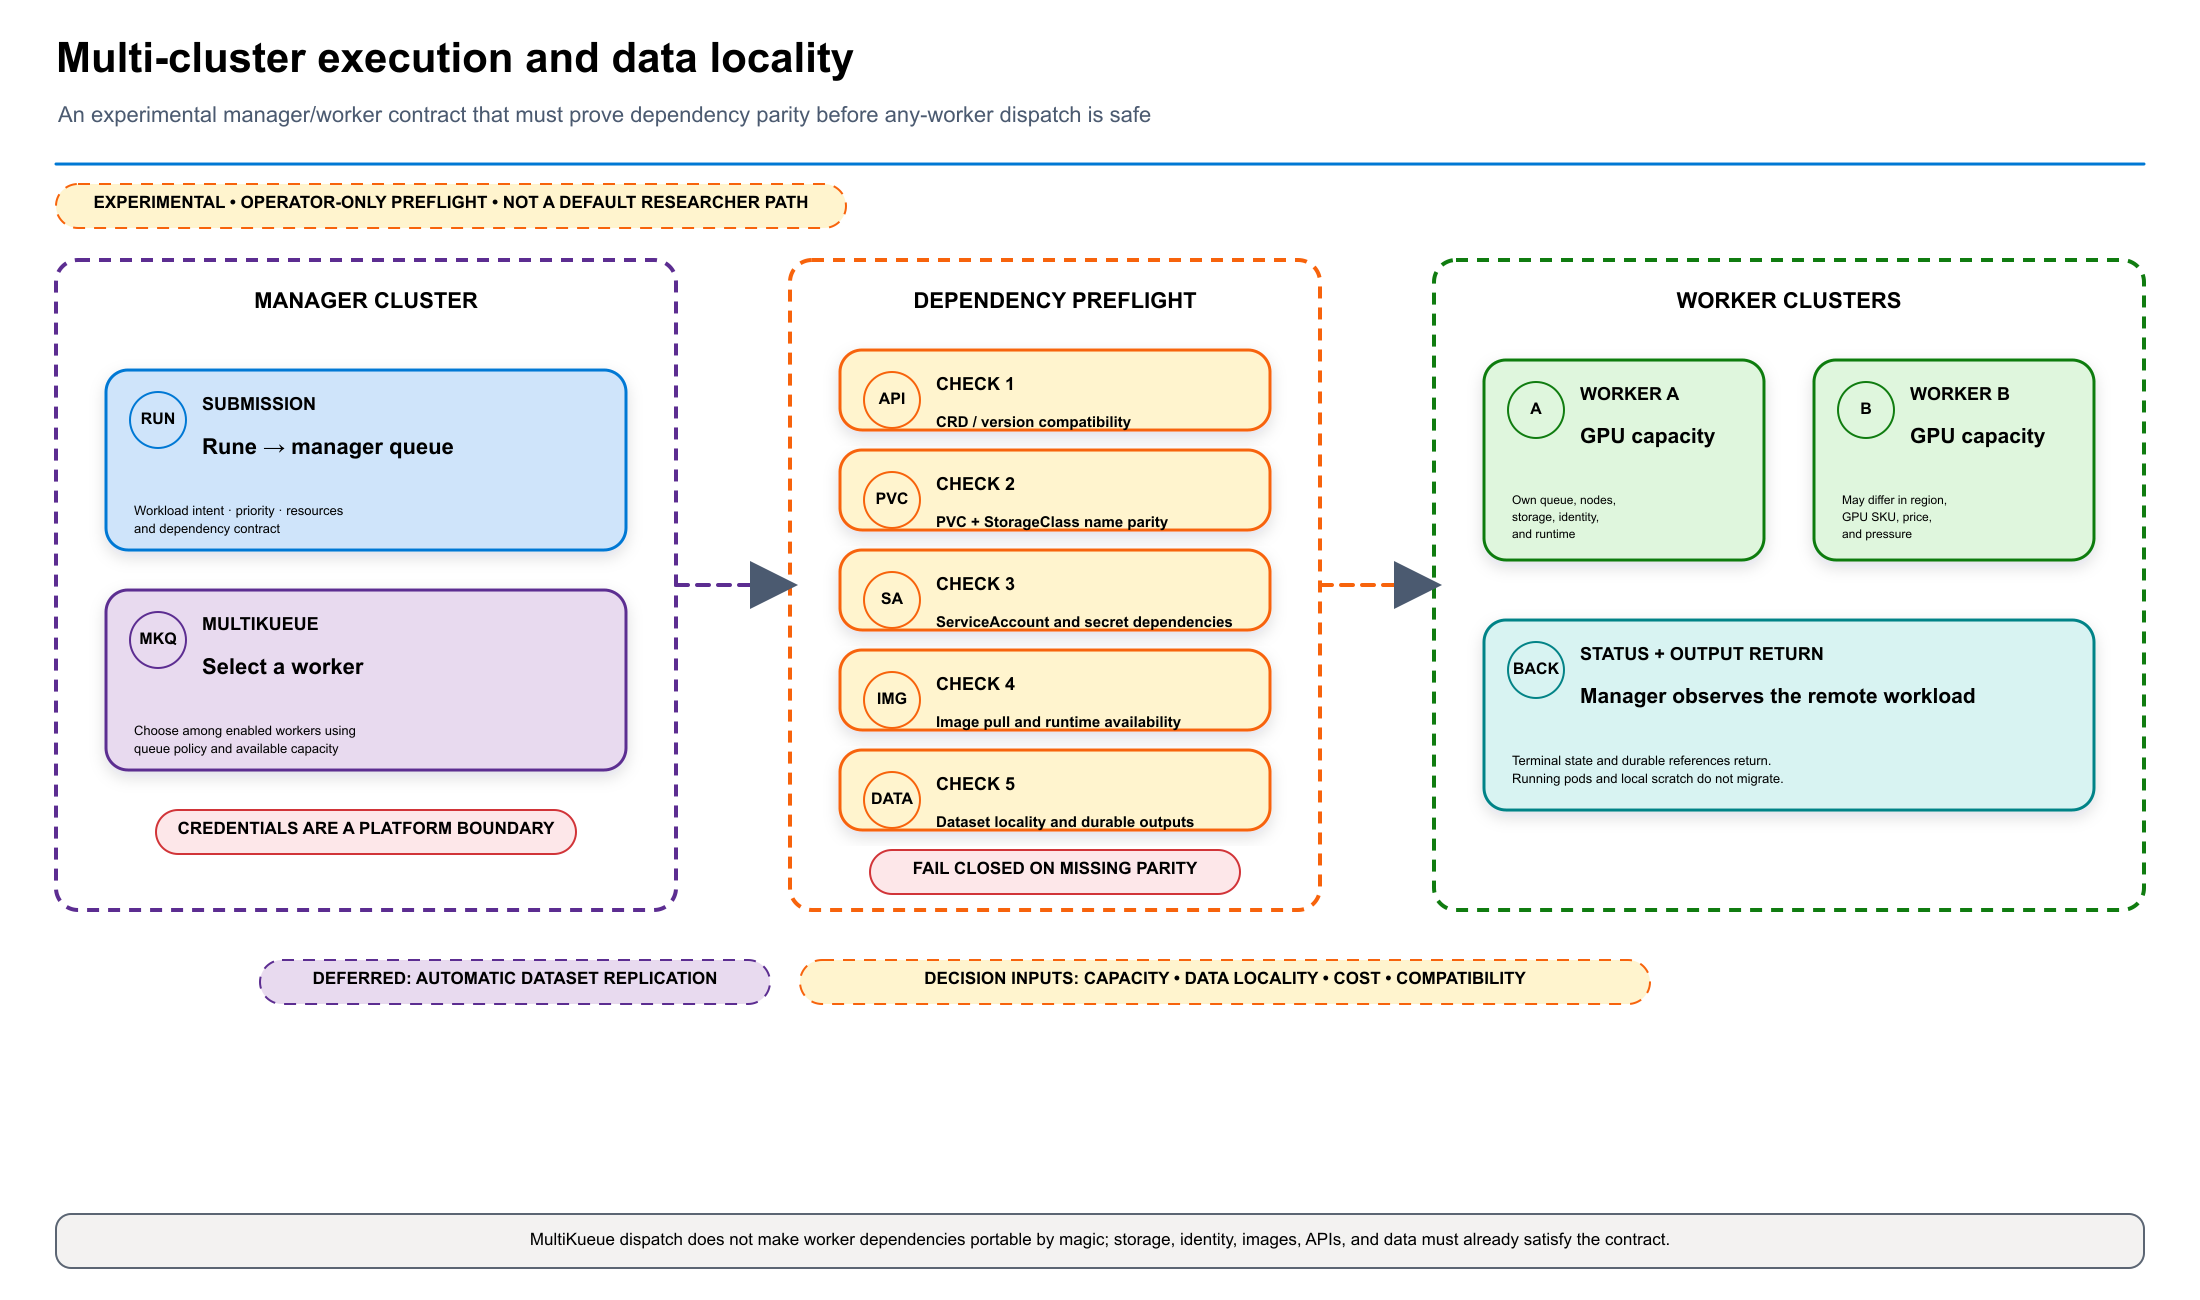
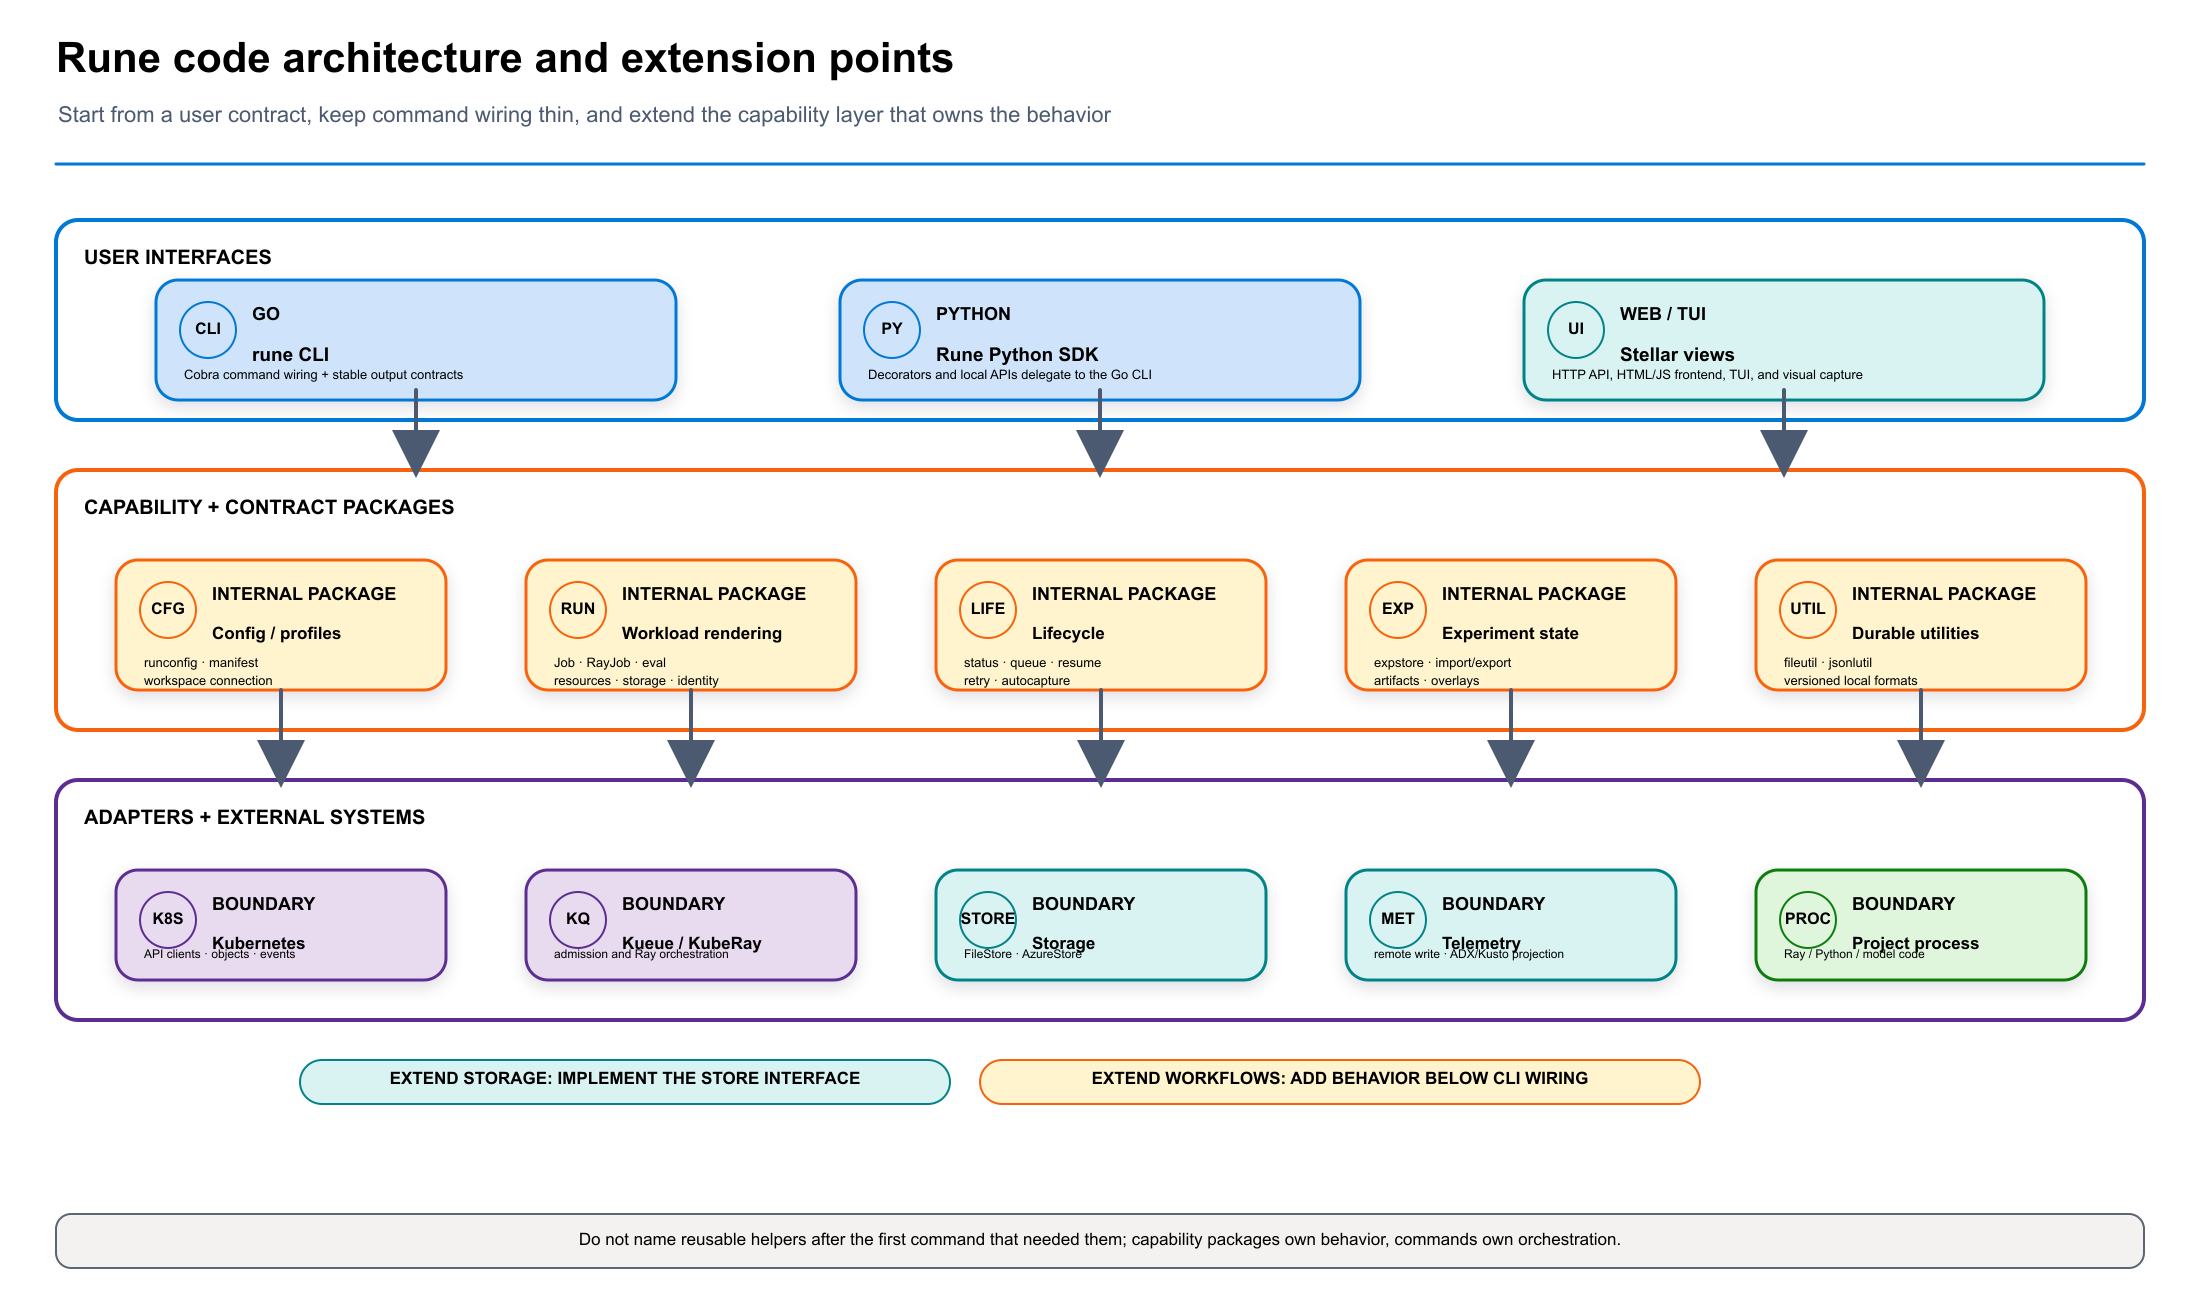
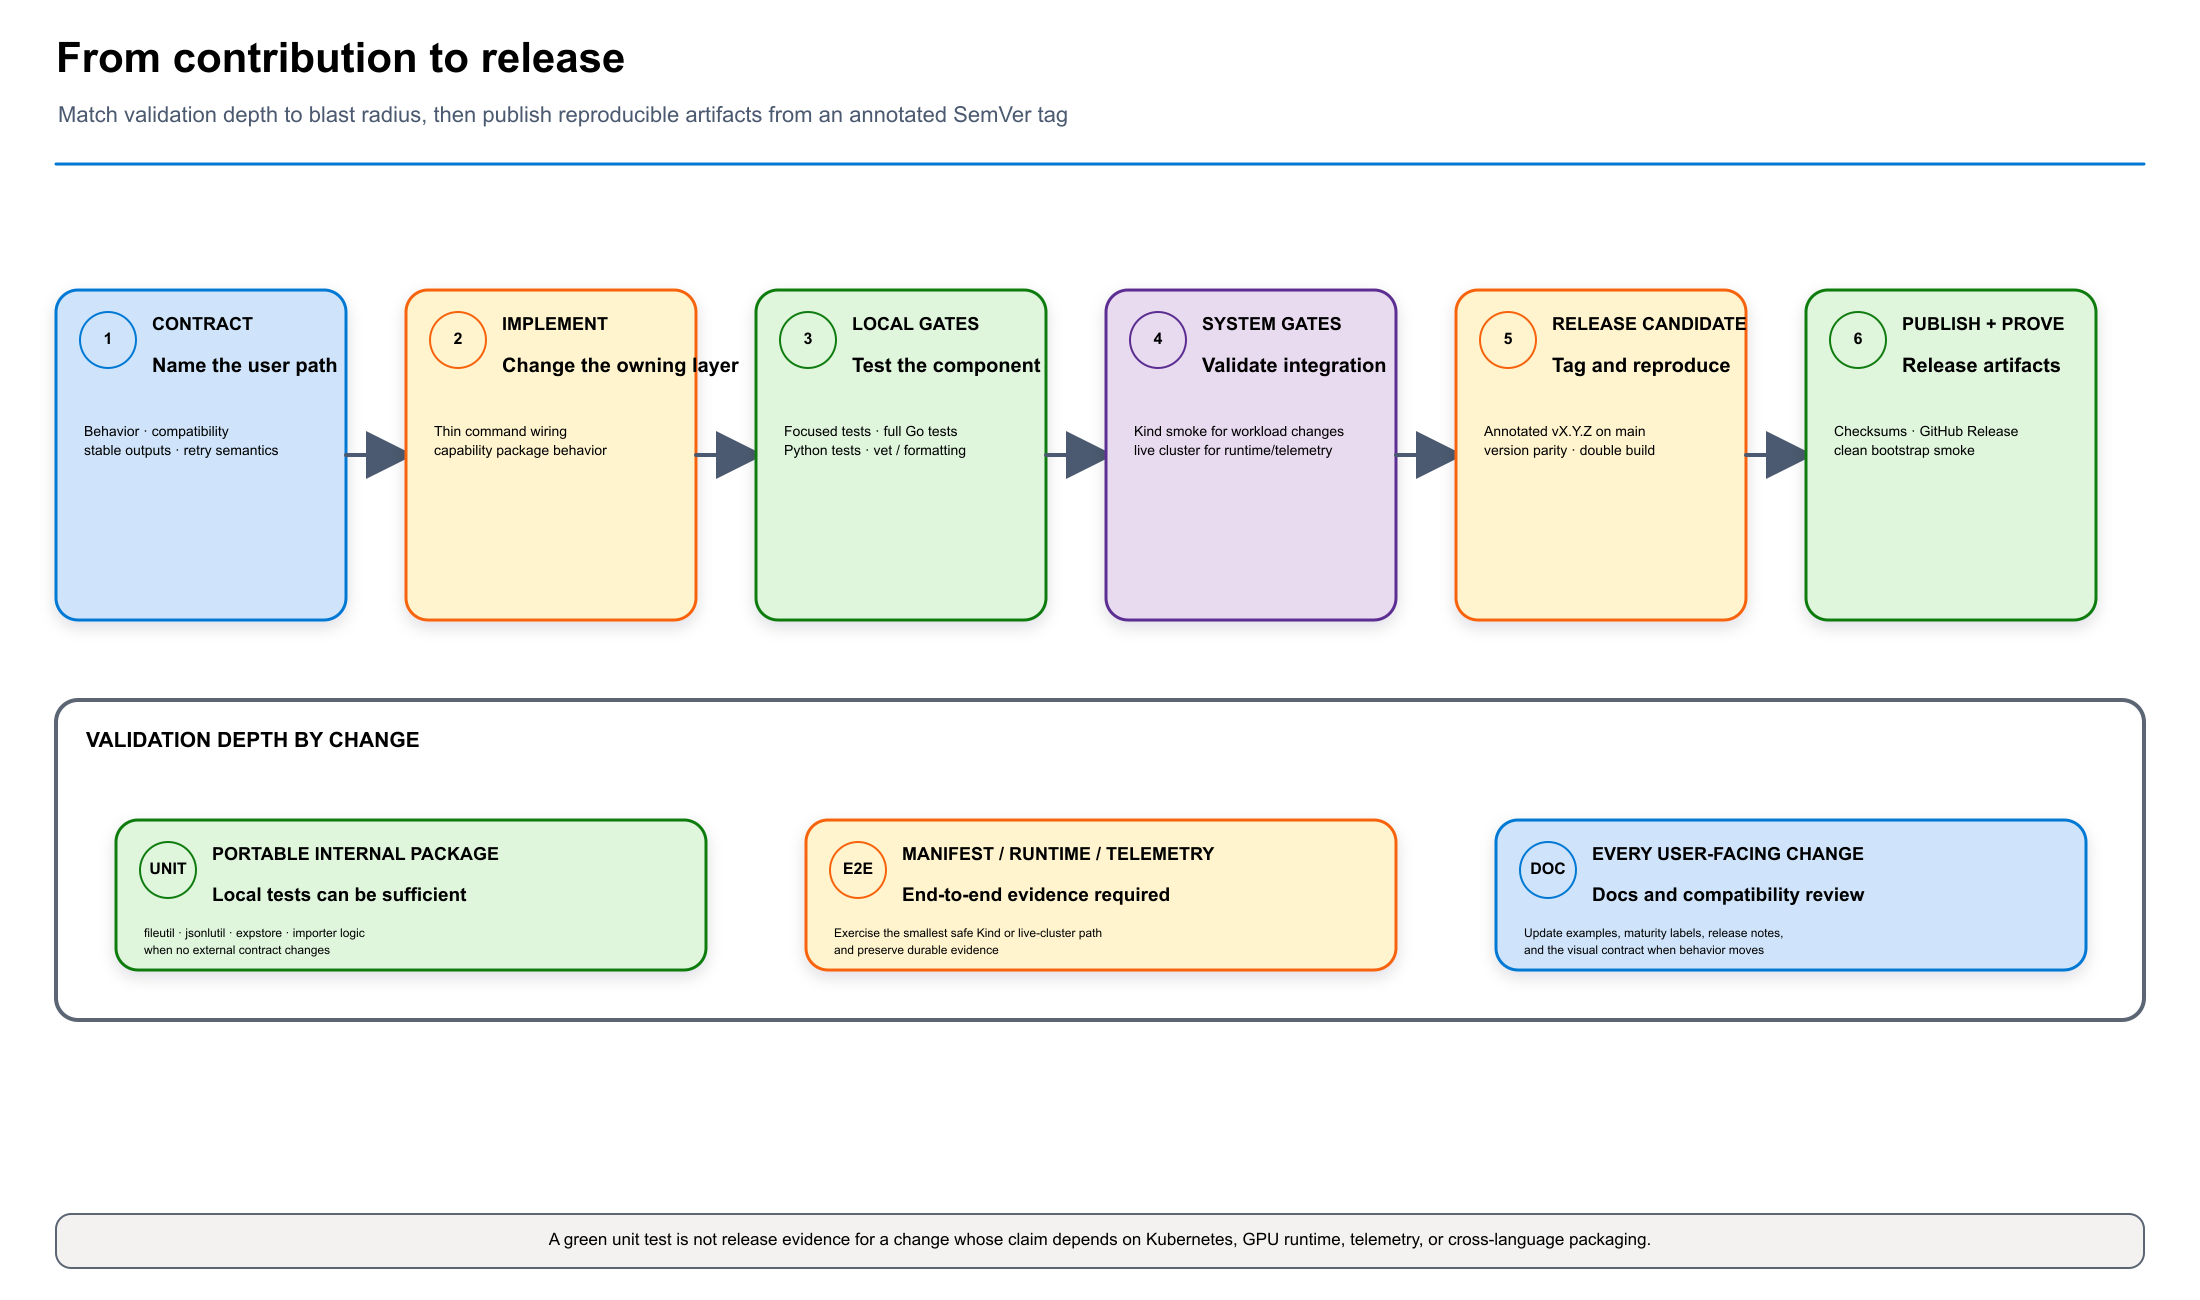
Extend and contribute