CPU Diagnostics Part 1: Identify and Diagnose High CPU issues
This is part one of our deep dive on Diagnosing CPU utilization issues in Azure App Service. In this post, you will learn about measuring CPU utilization for all apps hosted in an App Service Plan and identifying apps that are consuming maximum CPU resources.
This post applies to Windows web apps on Azure App Service.
First, we will cover troubleshooting tools for debugging Web Apps running on Azure App Services for Windows. These steps can be applied to apps built using any framework such as ASP.NET, Node, PHP, or Java running on a dedicated hardware tier (Basic or higher).
- Open a browser to the Azure Portal
- Navigate to one of oyur web apps
- On the left navigation bar, click the Diagnose and Solve Problems tab
- Select Availability and Performance section on the portal.
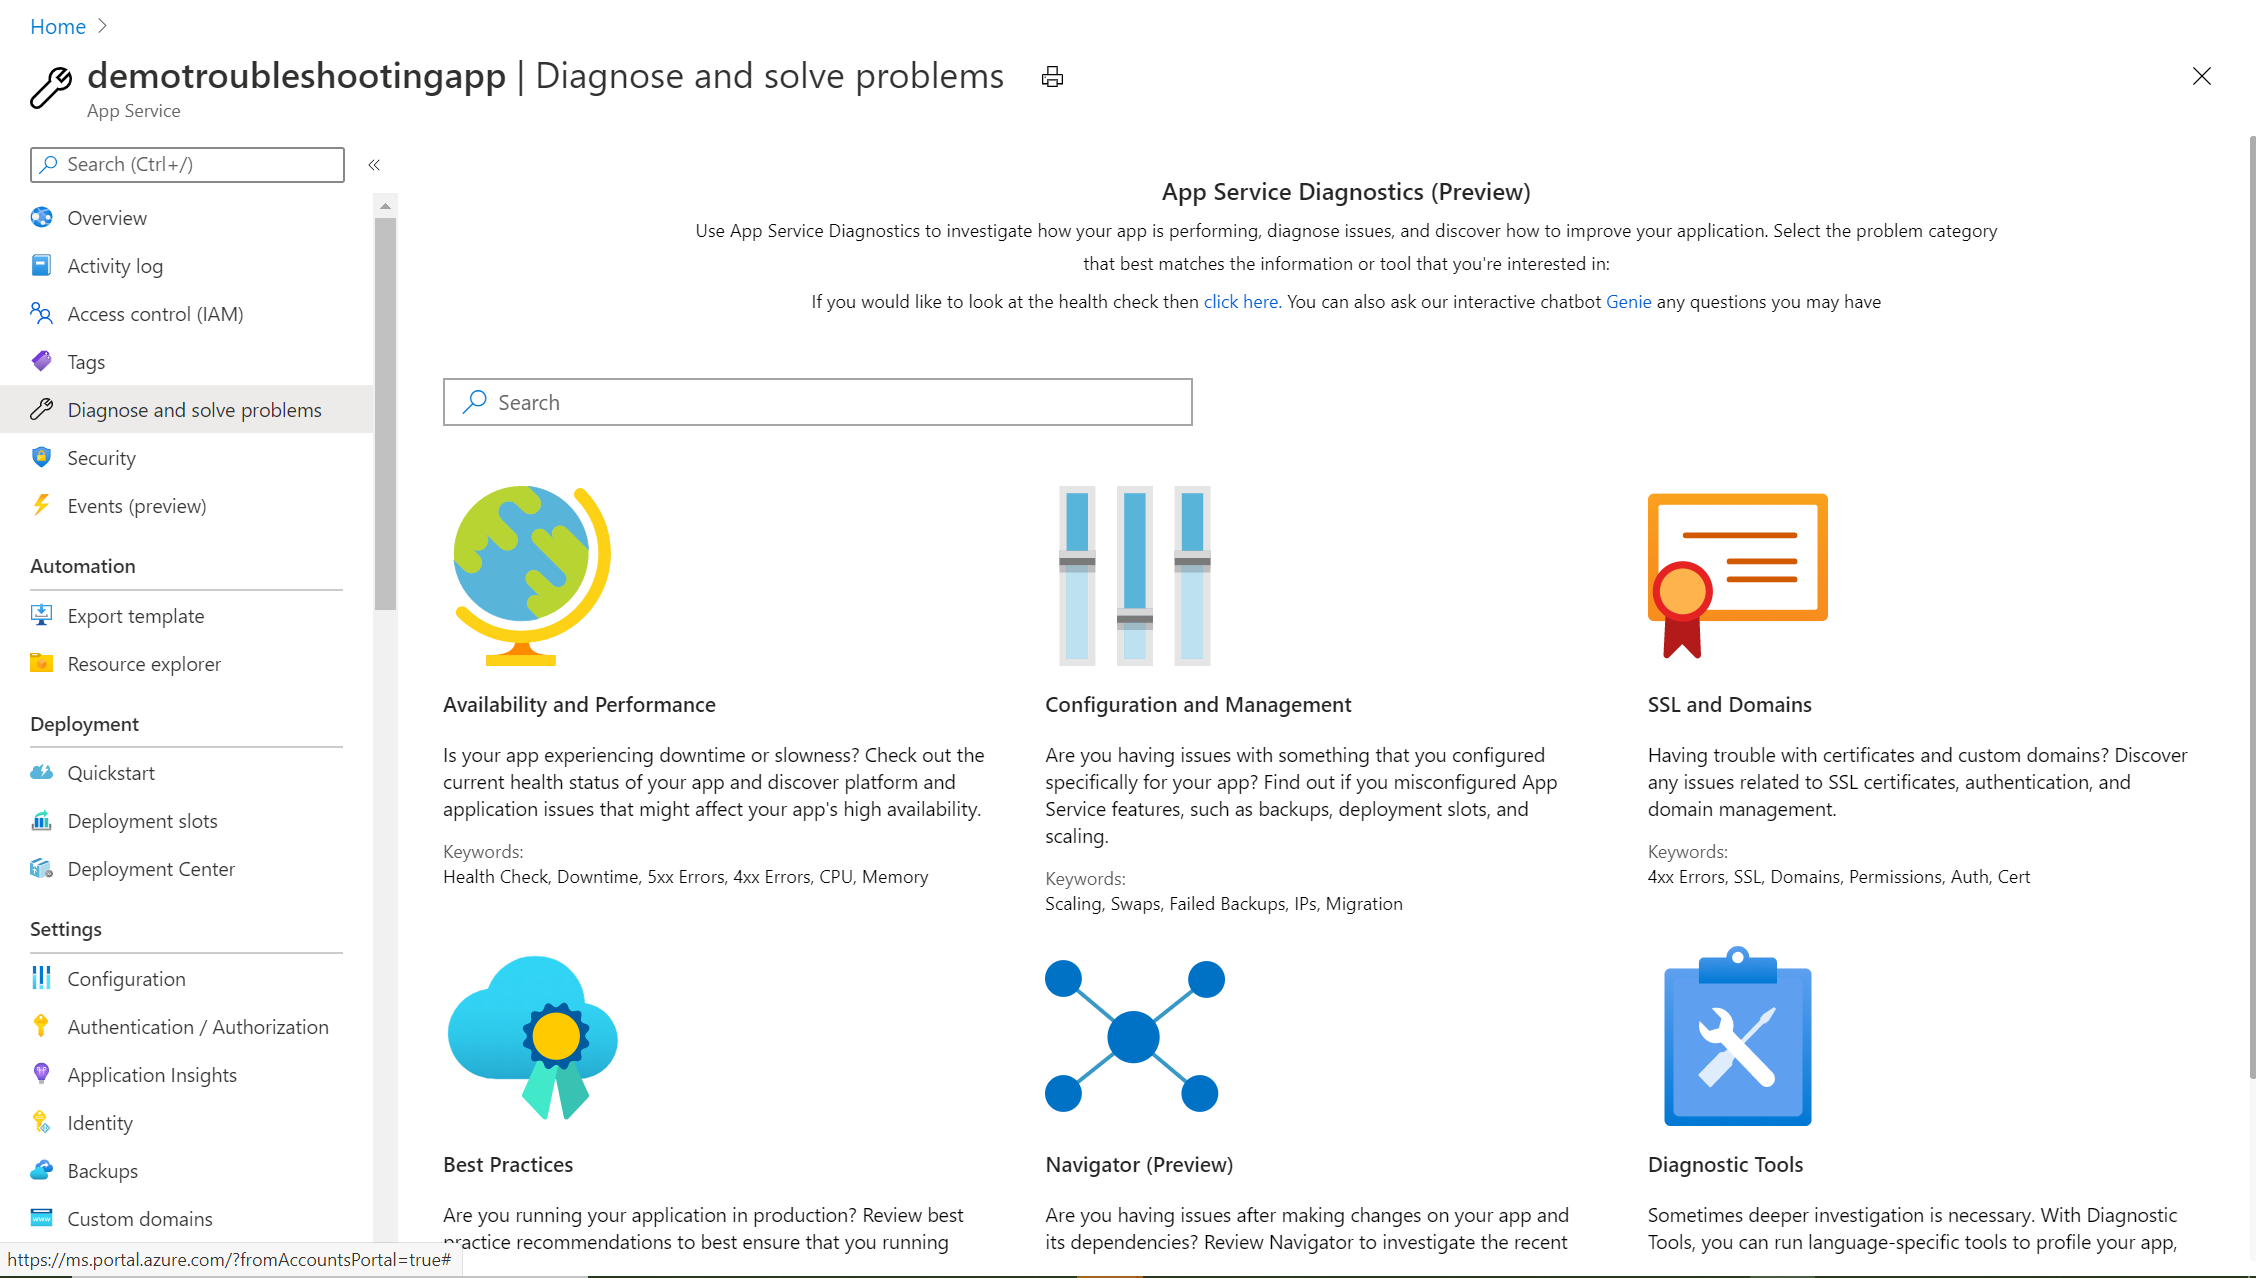
On this page, you can see an overview of your app’s health as well as various topics related to availability and performance. The time duration for the graph’s defaults is the last 24 hours, but you can modify it if needed.

The main topics presented are as follows:
- Failed Requests: Percentage of requests that have failed within the specified time range.
- Performance: Response time at the 90th percentile for the specified time range.
- CPU Usage: Maximum percentage of CPU Usage per instance over the specified time range.
- Memory Usage: Maximum Private bytes of memory usage for the current app.
Analyze high CPU usage
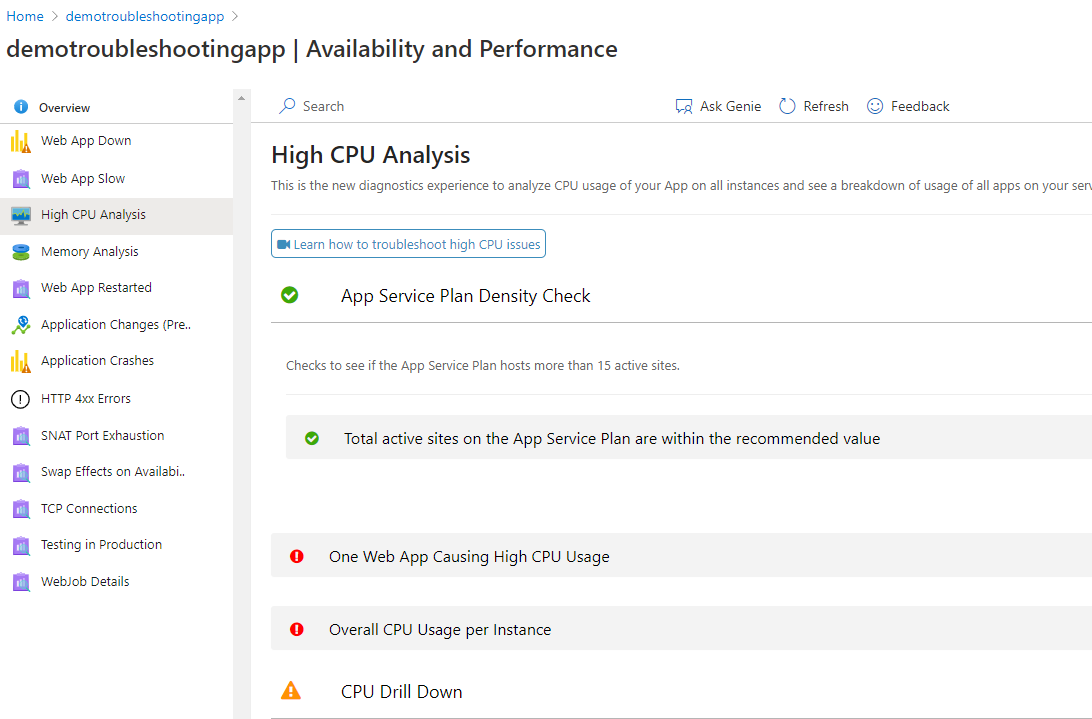
High CPU Analysis helps with troubleshooting issues related to the CPU.
- Click on the High CPU Analysis on the left-hand menu.
- Click the App Service Plan Density. This check will ensure the App Service Plan is not over the safe limit or overstuffed due to many apps in the service plan. In the post, we are only running three apps in the App Service Plan which is within safe limits for the SKU.
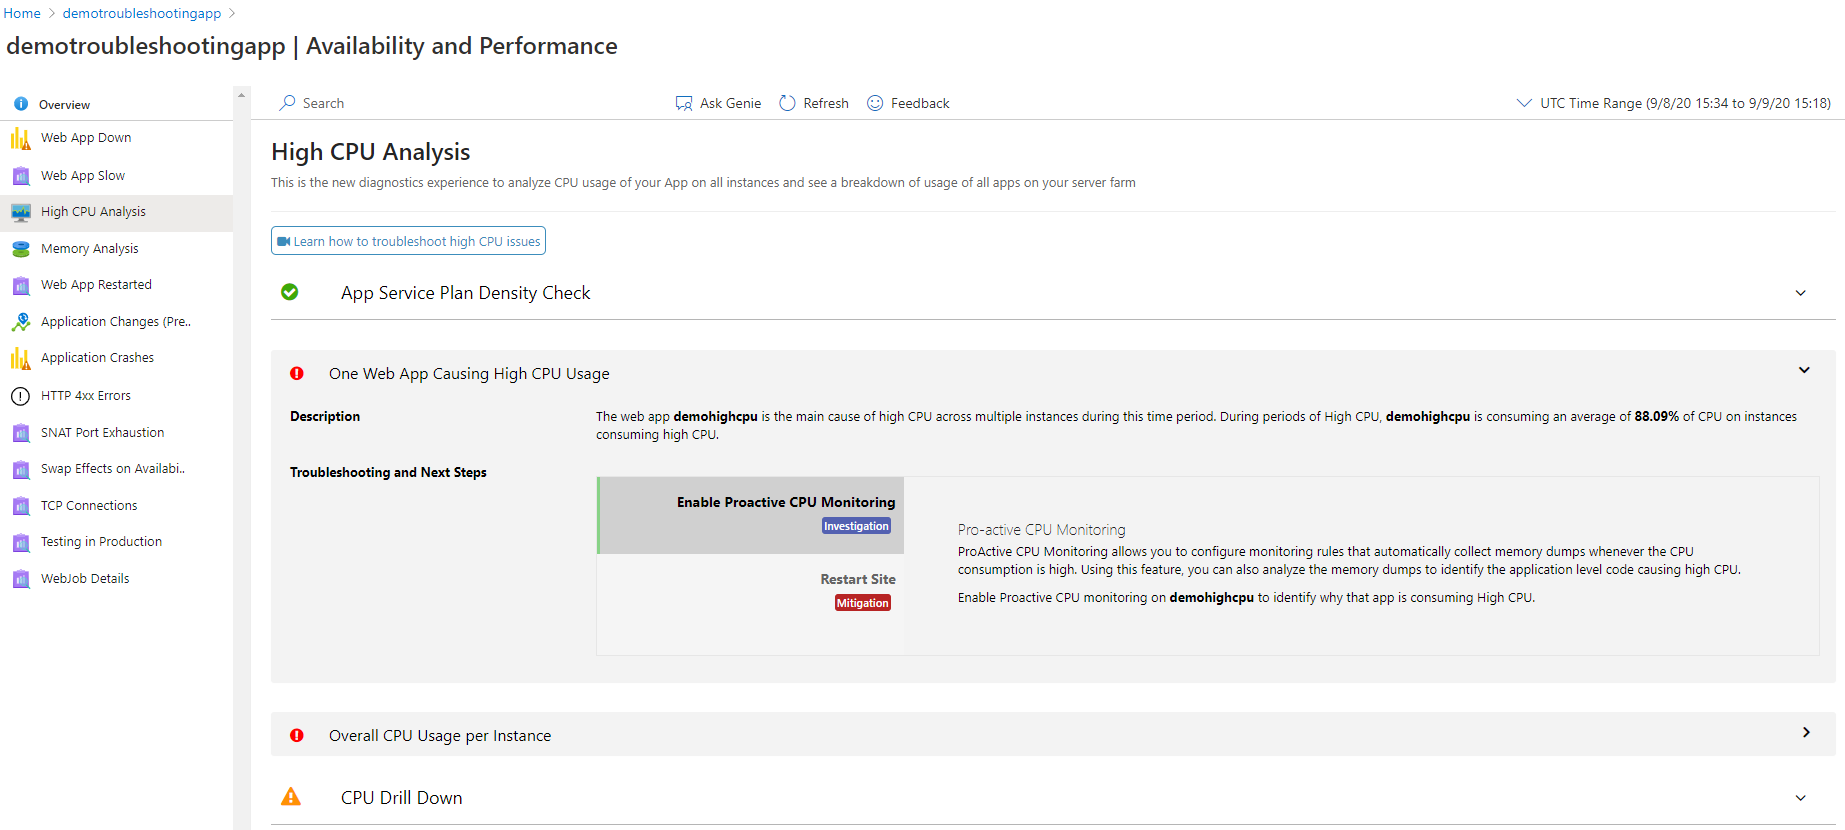
- Expand the insight for One Web App Causing High CPU Usage. This will identify the app consuming the maximum CPU resource on the App Service Plan.
Notice the app demohighcpu is consuming the highest CPU. This is different from the app we are currently looking at demotroubleshootingapp. The tool suggests to further debug the app demohighcpu.
Inspect CPU usage by instance
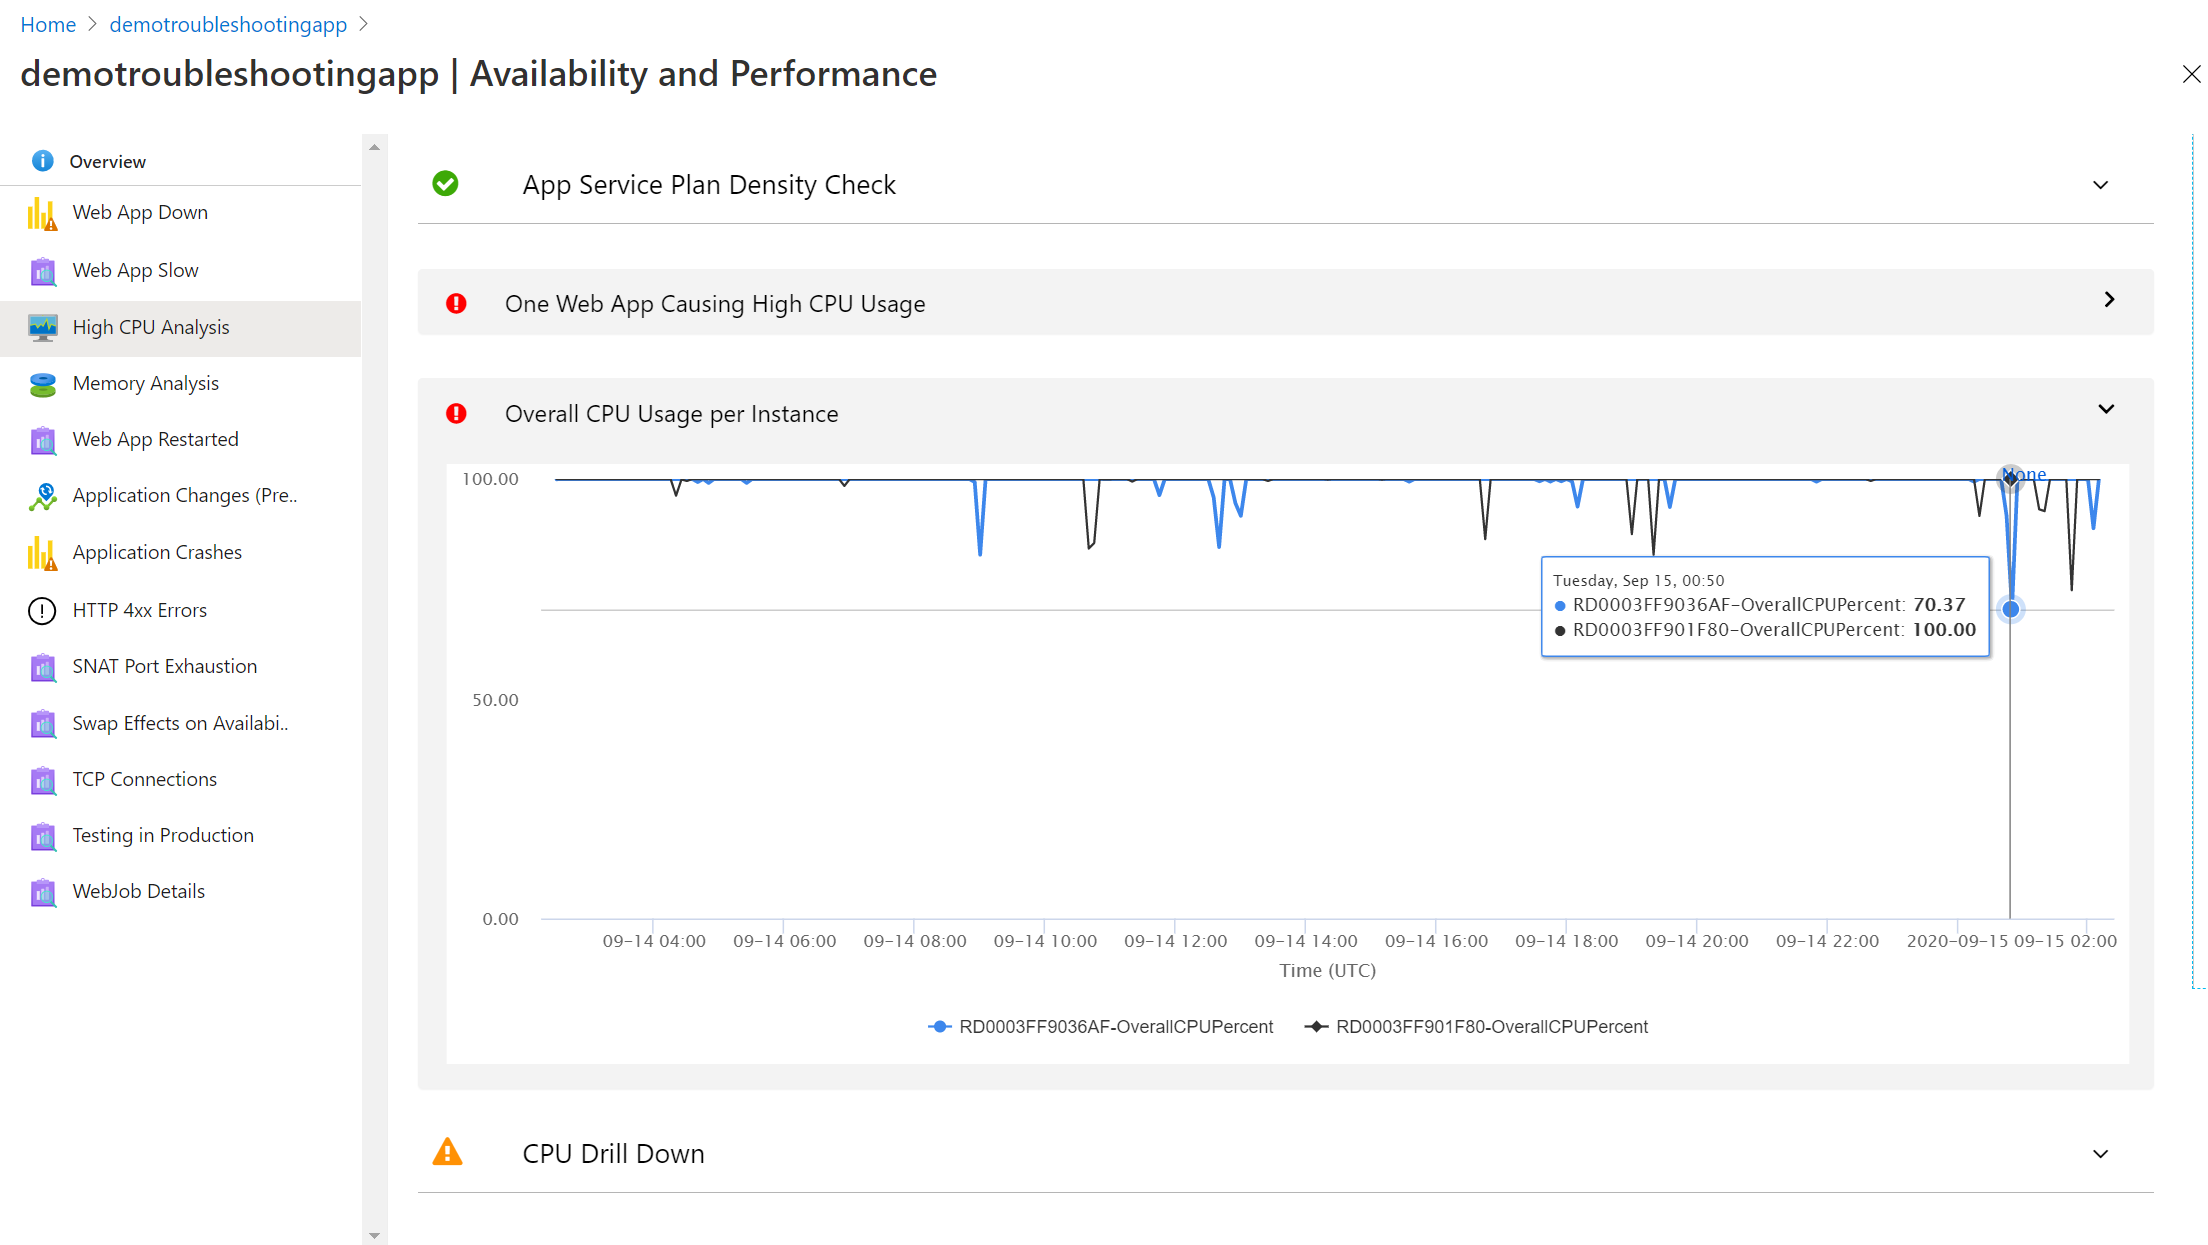
Below you can see the overall CPU usage for all the instances associated with the App Service Plan. In this example the app is running in two instances that are consuming high CPU.
- Click on the drop-down arrow for Overall CPU Usage per Instance.
- Hover over the graph of Overall CPU Usage Per Instance.
- You can see CPU consumption of each instance.
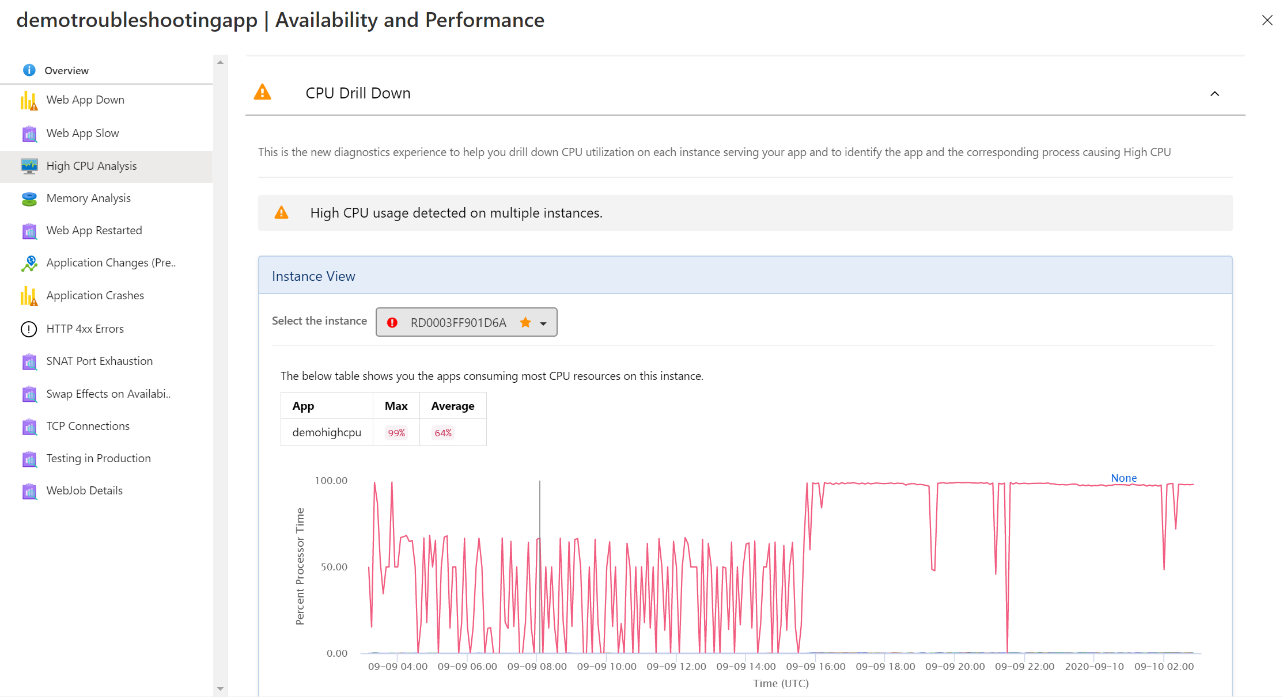
CPU Drill Down
Below the graph you can see a drill down view that displays the App-level CPU consumption for the app running on the same App Service plan. This tool identifies each individual apps running in the instance. By default, the instance with the maximum CPU usage will display first. In this example we can see the CPU maximum usage and average of demohighcpu.
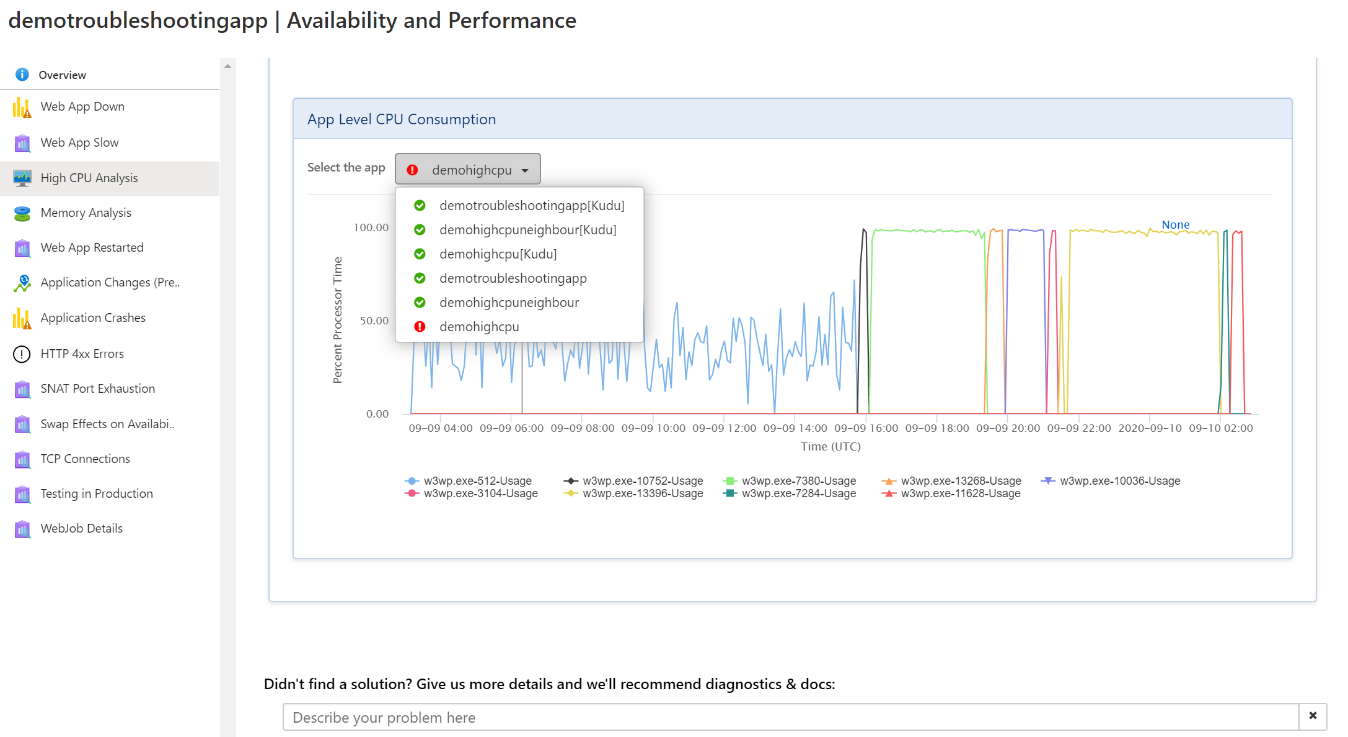
App Level CPU Consumption
Next, you can see a process level breakdown of each app. By default, the app with the maximum CPU is preselected.
- Next to Select the app, click on the app name.
A drop-down view appears. You can switch between apps running on the same app service plan. In the example, you can see a breakdown of the process name and process ID.
What’s Next?
After identifying the app causing high CPU, debug the app to identify why the CPU is high. The next article will go over the techniques you can use to debug the app. Some possible mitigations you can apply are:
- Restart the App as that may reduce the high CPU usage temporarily.
- Upgrading to the next tier can give you more resources if the app is consuming high CPU and you are on a lower tier.
- If multiple apps are experiencing high CPU due to an increase in requests, upgrading your App Service Plan to the next tier will allow it to benefit from an increase in scale.
- Isolating some apps to a dedicated app service plan can reduce the impact of other essential apps.
In the example, we saw demohighcpu is consuming the maximum CPU. Next, we will debug the app further to identify the cause of the high CPU in the next post. If you want to watch an in-depth tutorial on this topic, click on the video below!