Azure Functions now has direct integration with Application Insights
Donna Malayeri
Today we're encouraging everyone to go give Azure Functions' Application Insights integration a try. You can find full instructions and notes on how it works at https://aka.ms/func-ai. Now it takes (nearly) zero effort to add Application Insights to your Azure Functions and immediately unlock a powerful tool for monitoring your applications.
Application Insights is now available for all Functions users on "~1". If you're on "beta" now, please switch back to "~1" which has the latest version. If you stay on "beta", it's very likely you'll be broken by something at some point.
Getting Started
It’s fairly simple to get started – there is just two steps.- Create an Application Insights instance.
- Application type should be set to General
- Grab the instrumentation key
- Update your Function App’s settings
- Add App Setting –
APPINSIGHTS_INSTRUMENTATIONKEY={Instrumentation Key}
- Add App Setting –
Using Application Insights to the fullest
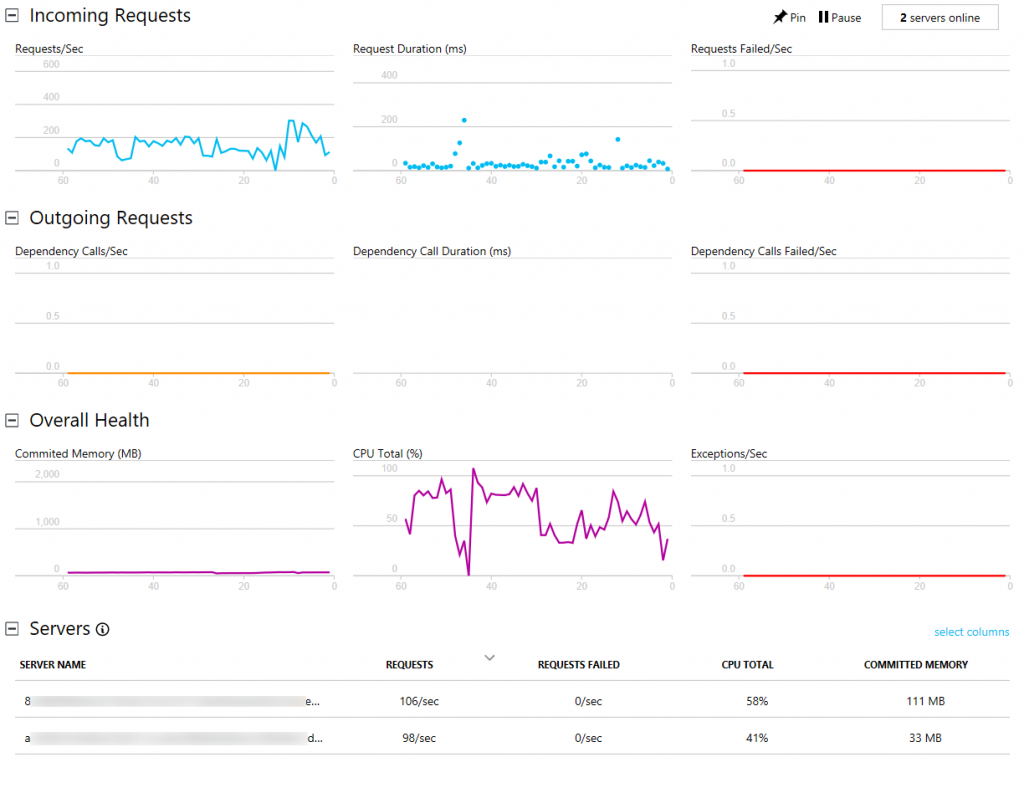
Now that your Function Apps are hooked up to Application Insights, let's take a quick look at some of the key things you'll want to try.Live Stream
If you open your Application Insights resource in the portal, you should see the option for “Live Metrics Stream” in the menu. Click on it and you’ll see a near-live view of what’s coming from your Function App. For executions, it has info on #/second, average duration, and failures/second. It also has information on resource consumption. You can pivot all of these by the “instance” your functions are on; providing you insight on whether a specific instance might be having an issue or all of your Functions.
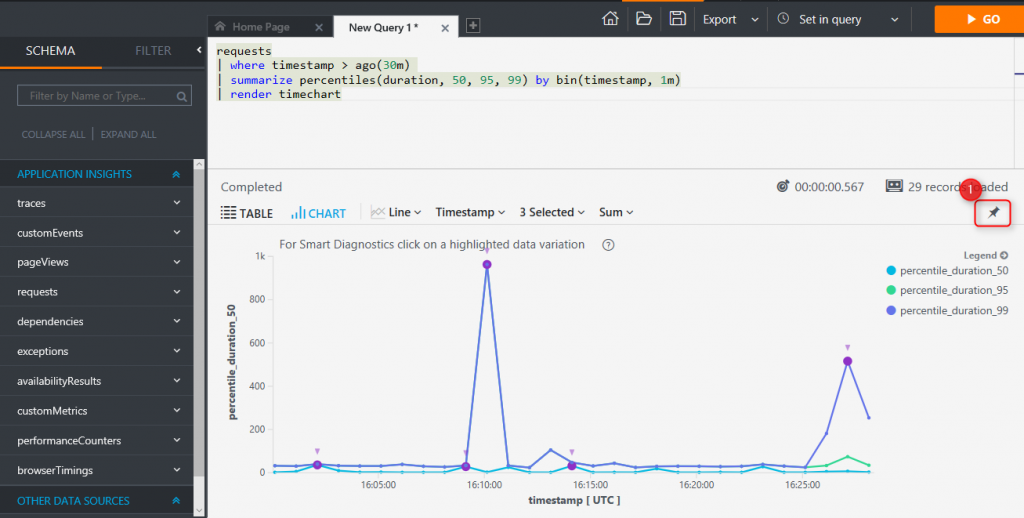
Analytics
The analytics portal provides you the ability to write custom queries against your data. This is one of the most powerful tools in your tool box. Currently, the following tables are full of data from the Functions runtime:- Requests – one of these is logged for each execution
- Exceptions – tracks any exceptions thrown by the runtime
- Traces – any traces written to context.log or ILogger show up here
- PerformanceMetrics – Auto collected info about the performance of the servers the functions are running on
- CustomEvents – Custom events from your functions and anything that the host sees that may or may not be tied to a specific request
- CustomMetrics – Custom metrics from your functions and general performance and throughput info on your Functions. This is very helpful for high throughput scenarios where you might not capture every request message to save costs, but you still want a full picture of your throughput/etc. as the host will attempt to aggregate these client side, before sending to Application Insights
